. 2015 Feb 9;27(2):177-92.
doi: 10.1016/j.ccell.2014.11.025.

14-3-3ζ turns TGF-β's function from tumor suppressor to metastasis promoter in breast cancer by contextual changes of Smad partners from p53 to Gli2

Affiliations

14-3-3ζ turns TGF-β's function from tumor suppressor to metastasis promoter in breast cancer by contextual changes of Smad partners from p53 to Gli2

Jia Xu et al. Cancer Cell. .

Abstract

Transforming growth factor β (TGF-β) functions as a tumor suppressor in premalignant cells but as a metastasis promoter in cancer cells. The dichotomous functions of TGF-β are proposed to be dictated by different partners of its downstream effector Smads. However, the mechanism for the contextual changes of Smad partners remained undefined. Here, we demonstrate that 14-3-3ζ destabilizes p53, a Smad partner in premalignant mammary epithelial cells, by downregulating 14-3-3σ, thus turning off TGF-β's tumor suppression function. Conversely, 14-3-3ζ stabilizes Gli2 in breast cancer cells, and Gli2 partners with Smads to activate PTHrP and promote TGF-β-induced bone metastasis. The 14-3-3ζ-driven contextual changes of Smad partners from p53 to Gli2 may serve as biomarkers and therapeutic targets of TGF-β-mediated cancer progression.


Conflict of interest statement

The authors declare no competing financial interests.

Figures
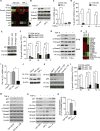
Figure 1
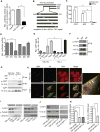
Figure 1. 14-3-3ζ inhibits TGF-β cytostatic program by downregulation of 14-3-3σ, p53, and p21
(A) Reverse-phase protein array (RPPA) analysis of 10A.Vec and 10A.ζ cells treated with vehicle (−) or 5 ng/mL TGF-β (+) for 2 hr. (B, C) Immunoblotting (IB) (B) and quantitative reverse transcriptase PCR (qRT-PCR) (C) analysis of p21 expression in 10A.Vec and 10A.ζ cells treated with vehicle (−) or 5 ng/mL TGF-β (+) for 2 hr. (D) Cell growth inhibition assay analysis of 10A.Vec or 10A.ζ cells treated with 5 ng/mL TGF-β. (E) IB of p21 in p21-knockdown MCF10A cells (10A.shp21–233 and 10A.shp21–535) and control cells transfected with control shRNA (10A.shCtrl). (F) Cell growth inhibition assay analysis of 10A.shCtrl or 10A.shp21 cells treated with 5 ng/mL TGF-β. (G) Immunoprecipitation (IP) of Smad2 and IB analysis of p53, p-Smad2 in indicated cells treated with vehicle (−) or 10 ng/ml TGF-β (+) for 2 hr. (H) Gene expression profiling of 10A.P, 10A.Vec and 10A.ζ cells by cDNA microarray. Heat map depicts 14-3-3ζ-induced top gene alterations. *SFN. (I, J) qRT-PCR (I) and IB (J) analysis of 14-3-3σ expression in 10A.P, 10A.Vec and 10A.ζ cells. (K) IB analysis of 14-3-3σ and p53 expression in 14-3-3σ-knockdown cells compared to 10A.P and 10A.shCtrl cells. (L) Cell growth inhibition assay analysis of 10A.shσ (−128 and −130) cells compared to 10A.shCtrl cells treated with 5 ng/mL TGF-β. (M) IB of indicated proteins of TGF-β cytostatic program in 10A.shCtrl and 10A.shσ-128 cells treated with vehicle (−) or 5 ng/mL TGF-β (+) for 2 hr. (N) IB analysis of protein expressions of TGF-β’s cytostatic program in indicated cells. (O) BrdU incorporation assay analysis of TGF-β-treated 10A.Vec, 10A.ζ, 10A.ζ.σ cells. Error bars represent SD, *p<0.05, **p<0.01, ***p<0.001. See also Figure S1.
Figure 2
Figure 2. 14-3-3ζ represses 14-3-3σ transcription by cytosolic sequestration of YAP1
(A) Luciferase activity assay of 14-3-3σ promoter (−1221)-driven luciferase (pGL3-14-3-3σ) expression in indicated cells 48 hr post-transfection. The pRL-TK vector was used as an internal control. (B) Schematic representation of sequential deletions of the 14-3-3σ promoter cloned in the upstream of the luciferase reporter (Top) and mutations (M1 to M5) of putative transcription factor binding sitse in the −922 to −741 region of the 14-3-3σ promoter (Bottom). (C) Relative luciferase activity driven by sequential deletions of 14-3-3σ promoter (−1221, −922, and −741) in 10A.Vec and 10A.ζ cells. (D) Relative luciferase activity driven by binding site mutations of 14-3-3σ promoter (−922) in 10A.Vec cells. (E) ChIP assay of YAP1 binding to 14-3-3σ promoter in 10A.Vec and 10A.ζ cells with indicated antibodies. (F) IP of HA-14-3-3ζ and IB analysis of indicated proteins in 10A.ζ cells. (G) IP of HA-14-3-3ζ and IB analysis of indicated proteins in 12A.Vec and 12A.ζ cells. IP Ab: Antibodies used for IP. (H) Immunofluorescence staining analysis of 14-3-3ζ and YAP1 in 10A.Vec and 10A.ζ cells. Arrows indicate co-localization of 14-3-3ζ and YAP1 in the cytosol of 10A.ζ cells. Scale bar represents 10 μm. (I) Cell fractionation of 10A.Vec and 12A.Vec or 10A.ζ and 12A.ζ cells and IB of indicated proteins. Tubulin serves as cytoplasmic marker; Lamin B serves as nuclear marker. (J, K) IB (J) and qRT-PCR (K) analysis of 14-3-3σ expression in YAP1-knockdown cells compared to 10A.shCtrl or 12A.shCtrl cells. Error bars represent SD, *p<0.05, **p<0.01, ***p<0.001. See also Figure S2.
Figure 3
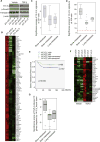
Figure 3. 14-3-3ζ-linked gene signature is associated with TGF-β-regulated genes in bone metastasis
(A) IB of indicated proteins in 231.shCtrl and 231.shζ cells treated with vehicle or TGF-β (5 ng/mL, 2 hr). (B) Expression heatmap of 14-3-3ζ 85-gene signature in 231.shCtrl cells compared to 231.shζ cells. (C) Significance score distribution of 14-3-3ζ signature from MDA-MB-231 cells in breast cancer metastases of indicated organs. (D) Significance score distribution of 14-3-3ζ-induced gene signature from MCF10A cells in metastases of breast cancer at different organs. Red dashed line indicates the significance level of p=0.0001. (E) Kaplan-Meier curves for bone metastasis-free survival according to 14-3-3ζ expression level in a subset of 253 breast tumors in the EMC-286 cohort. p value was calculated based on log-rank test. (F) Gene expression heatmap of 34 TGF-β-induced genes inhibited by 14-3-3ζ knockdown. (G) Significance score distribution of TGF-β-induced bone metastasis genes (10 of the genes identified in Fig. 3F) inhibited by 14-3-3ζ knockdown in metastases of indicated organs (GSE14020). Box plots show the distribution of scores. The thick line in the middle of the box shows median value. The top and bottom of the box represent upper (3rd) and lower (1st) quartile values, respectively, and the top and bottom of the line show maximum and minimum values, respectively. See also Figure S3.
Figure 4
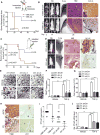
Figure 4. 14-3-3ζ promotes TGF-β-induced breast cancer bone metastasis by activating PTHrP
(A) Kaplan-Meier survival analysis of mice injected intra-cardially with 1×10 1566.shCtrl or 1566.shζ cells. (B) Representative BLI, X-ray and H&E images of bone metastatic lesions of mice in (A) at the indicated time. 14-3-3ζ expression level was shown by IHC staining. Arrows indicate osteolytic bone lesions; (T) tumor; (B) bone tissue. BLI, bioluminescence imaging. Scale bar: 50 μm. (C) Kaplan-Meier survival analysis of mice injected intra-tibially with 231.shCtrl or 231.shζ cells. (D) Representative BLI, X-ray and H&E images of bone lesions (day 49) of mice in (C). 14-3-3ζ expression level was shown by IHC staining. Arrows indicate osteolytic bone lesions; (T) tumor; (B) bone tissue. Scale bar: 50 μm. (E, F) Representative staining images (E) and quantification (F, three repeats) of TRAP+ mature osteoclasts culture with MC3T3 osteoblasts and 231 breast cancer cells treated with vehicle or TGF-β,. The arrows indicate TRAP+ mature osteoclasts. Scale bar: 200 μm. (G) Quantification of indicated GFP-labeled cancer cells grown under triple co-culture. Cells were trypsinized from each triple co-culture group, and re-cultured in 10 cm plates for counting. TGF-β treatment (5 ng/mL, 6 days). (H, I) Representative IHC images (H) and quantification (I) of PTHrP protein expression in mouse bone lesions. Note: 4 mice in 1566.shζ group and 5 mice in 231.shζ group had no bone lesions and were excluded from PTHrP protein analysis. Scale bar: 50 μm. (J) qRT-PCR analysis of PTHrP mRNA in 231.shCtrl or 231.shζ cells. Error bars represent SD, *p<0.05, **p<0.01, ***p<0.001. See also Figure S4.
Figure 5
Figure 5. 14-3-3ζ enhances TGF-β-induced PTHrP mRNA expression by stabilization of Gli2
(A–B) Representative IHC images (A) and quantification (B) of Gli2 expression in the indicated mouse bone lesions. Scale bar: 50 μm. (C) IB analysis of Gli2 expression in 231.shCtrl and 231.shζ (−4 and −5) cells treated by vehicle or TGF-β (5 ng/mL). (D) IB analysis of Gli2 protein in 231.shCtrl and 231.shζ cells treated with TGF-β (5 ng/mL) and MG132 (10 μM) for indicated times. (E) IP of Myc-Gli2 and IB analysis of Gli2 ubiquitination in indicated cells treated with TGF-β (5 ng/mL) and MG132 (10 μM). (F) IP of Myc-Gli2 and IB analysis of indicated proteins in cells treated with TGF-β (5 ng/mL) and MG132 (10 μM). (G) IP of Myc-Gli2 and IB analysis of indicated proteins. 231.shζ cells were transfected with Myc-Gli2 and treated with TGF-β (5 ng/mL) and MG132 (10 μM). Cell lysates were incubated with or without GST (1 μM) or GST-14-3-3ζ (200 nM or 1 μM) overnight. (H) qRT-PCR analysis of PTHrP mRNA level in indicated cells with indicated treatment. (I) IP of Smad2 and IB analysis of indicated proteins in indicated cells. IP Ab: Antibodies used for IP. Error bars represent SD, *p<0.05, **p<0.01, ***p<0.001. See also Figure S5.
Figure 6
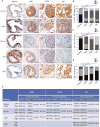
Figure 6. High 14-3-3ζ is associated with TGF-β’s functional switch during breast cancer development
(A) Representative IHC staining of 14-3-3ζ, YAP1, 14-3-3σ, p21, and Gli2 in normal breast tissue, ADH, DCIS, and IDC. Scale bar: 50 μm. (B–D) Percentage of 14-3-3σ (B), p21 (C), and Gli2 (D) IHC score distribution in the indicated breast tissues. Unpaired t-test with Welch’s correction was used to compare IHC score in ADH, DCIS, and IDC to normal tissue. *p<0.05, **p<0.01, ***p<0.001, by two-tailed t-test. (E) The association between 14-3-3ζ expression and the expression level of nuclear YAP1, 14-3-3σ, p21, and Gli2 in ADH, DCIS, and IDC compared to normal tissue. Number of cases and percent of positive staining in the corresponding group (%) are shown in the table. p values were determined by Chi-square analysis. See also Figure S6.
Figure 7
Figure 7. Diagram of 14-3-3ζ-driven contextual changes of Smad partners from p53 in pre-malignant cells to Gli2 in cancer cells
In pre-malignant human MECs, YAP1 is a critical transcription co-activator for 14-3-3σ, and 14-3-3σ stabilizes p53, a Smad partner for transactivation of p21, which is the key executor of TGF-β’s cytostatic and tumor suppression program (left). In breast cancer cells, Gli2 is a Smad partner for transactivation of PTHrP, which is a key facilitator of TGF-β’s bone osteolysis and bone metastasis program (right). 14-3-3ζ overexpression in pre-malignant cells turns off TGF-β’s cytostatic tumor suppressor function by binding to YAP1 and sequestering YAP1 in the cytosol, thereby blocking YAP1-induced transactivation of 14-3-3σ; conversely, 14-3-3ζ overexpression in breast cancer cells turns on TGF-β’s metastasis promoter function by blocking β-TrCP binding to, and ubiquitination of, Gli2, thus stabilizing Gli2. Together, 14-3-3ζ serves as a molecular switch turning TGF-β from a tumor suppressor to a metastasis promoter by altering cellular contextual determinants of Smads. Solid lines represent findings described in this study, and dashed lines represent previously described links.

Comment in

References

    1. Akahira J, Sugihashi Y, Suzuki T, Ito K, Niikura H, Moriya T, Nitta M, Okamura H, Inoue S, Sasano H, et al. Decreased expression of 14-3-3 sigma is associated with advanced disease in human epithelial ovarian cancer: its correlation with aberrant DNA methylation. Clin Cancer Res. 2004;10:2687–2693. - PubMed
    1. Akhurst RJ, Hata A. Targeting the TGFbeta signalling pathway in disease. Nat Rev Drug Discov. 2012;11:790–811. - PMC - PubMed
    1. Bai N, Zhang C, Liang N, Zhang Z, Chang A, Yin J, Li Z, Luo N, Tan X, Luo Y, et al. Yes-associated protein (YAP) increases chemosensitivity of hepatocellular carcinoma cells by modulation of p53. Cancer biology & therapy. 2013;14:511–520. - PMC - PubMed
    1. Barry ER, Morikawa T, Butler BL, Shrestha K, de la Rosa R, Yan KS, Fuchs CS, Magness ST, Smits R, Ogino S, et al. Restriction of intestinal stem cell expansion and the regenerative response by YAP. Nature. 2013;493:106–110. - PMC - PubMed
    1. Basu S, Totty NF, Irwin MS, Sudol M, Downward J. Akt phosphorylates the Yes-associated protein, YAP, to induce interaction with 14-3-3 and attenuation of p73-mediated apoptosis. Mol Cell. 2003;11:11–23. - PubMed

Publication types

MeSH terms

Associated data