. 2014 Apr 28:13:93.
doi: 10.1186/1476-4598-13-93.

Reexpression of LSAMP inhibits tumor growth in a preclinical osteosarcoma model

Affiliations

Reexpression of LSAMP inhibits tumor growth in a preclinical osteosarcoma model

Tale Barøy et al. Mol Cancer. .

Abstract

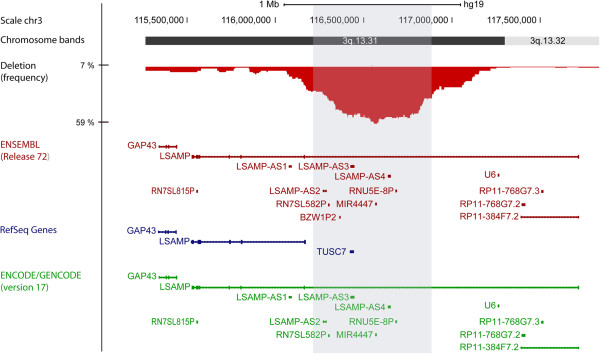
Background: Osteosarcomas are the most common primary malignant tumors of bone, showing complex chromosomal rearrangements with multiple gains and losses. A frequent deletion within the chromosomal region 3q13.31 has been identified by us and others, and is mainly reported to be present in osteosarcomas. The purpose of the study was to further characterize the frequency and the extent of the deletion in an extended panel of osteosarcoma samples, and the expression level of the affected genes within the region. We have identified LSAMP as the target gene for the deletion, and have studied the functional implications of LSAMP-reexpression.

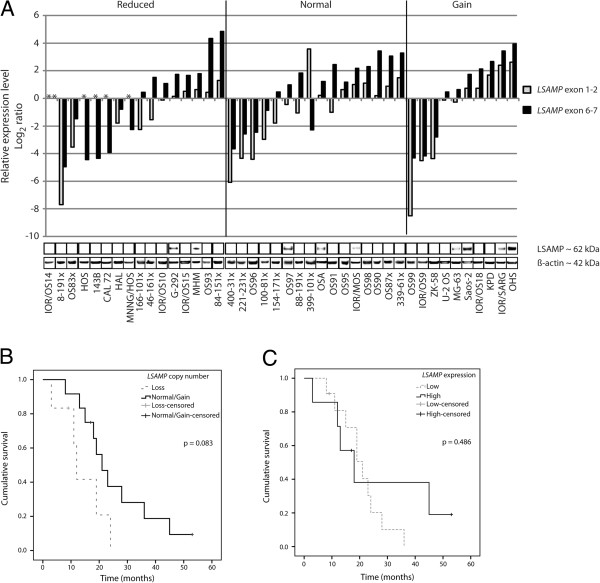
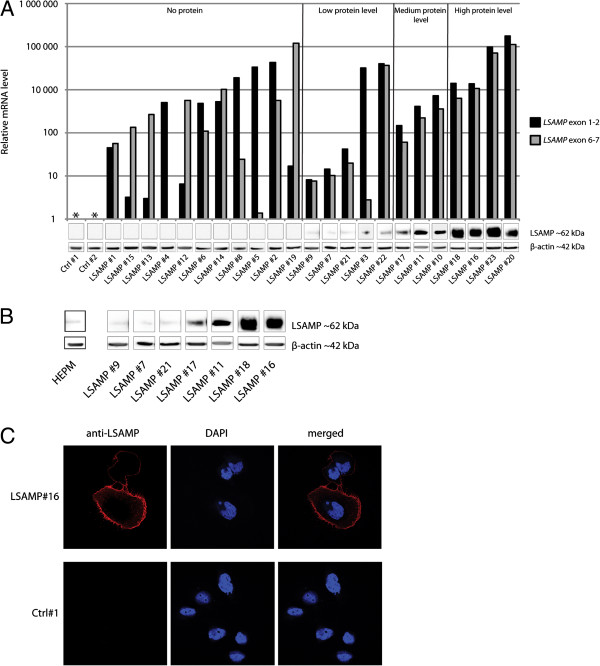
Methods: LSAMP copy number, expression level and protein level were investigated by quantitative PCR and western blotting in an osteosarcoma panel. The expression of LSAMP was restored in an osteosarcoma cell line, and differences in proliferation rate, tumor formation, gene expression, migration rate, differentiation capabilities, cell cycle distribution and apoptosis were investigated by metabolic dyes, tumor formation in vivo, gene expression profiling, time-lapse photography, differentiation techniques and flow cytometry, respectively.

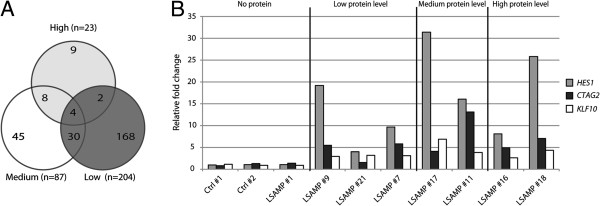
Results: We found reduced copy number of LSAMP in 45/76 osteosarcoma samples, reduced expression level in 25/42 samples and protein expression in 9/42 samples. By restoring the expression of LSAMP in a cell line with a homozygous deletion of the gene, the proliferation rate in vitro was significantly reduced and tumor growth in vivo was significantly delayed. In response to reexpression of LSAMP, mRNA expression profiling revealed consistent upregulation of the genes hairy and enhancer of split 1 (HES1), cancer/testis antigen 2 (CTAG2) and kruppel-like factor 10 (KLF10).

Conclusions: The high frequency and the specificity of the deletion indicate that it is important for the development of osteosarcomas. The deletion targets the tumor suppressor LSAMP, and based on the functional evidence, the tumor suppressor function of LSAMP is most likely exerted by reducing the proliferation rate of the tumor cells, possibly by indirectly upregulating one or more of the genes HES1, CTAG2 or KLF10. To our knowledge, this study describes novel functions of LSAMP, a first step to understanding the functional role of this specific deletion in osteosarcomas.


Figures

Figure 1
Figure 1
Chromosome map and frequency plot of the observed deletions in 3q13.31 in osteosarcoma samples (n = 76). The shaded gray area (chr3:116,269,000-116,896,000) corresponds to a frequency of ≥ 30% of the samples. Below the frequency plot are the genes within 3q13.31 annotated by the databases ENSEMBL (red) and RefSeq (blue), and supporting annotation by ENCODE/GENCODE data (green).
Figure 2
Figure 2
LSAMP aberrations and patient survival. A: The correlation between LSAMP copy number, expression level and protein level in osteosarcoma samples (n = 42). The samples are sorted according to their copy number (reduced, normal or gain). The relative expression level was measured by qRT-PCR using two probes to cover the length of the gene (located in exon junction 1–2 and 6–7). No detectable expression level is indicated with an asterisk (*). The corresponding LSAMP protein level was determined using western blot, with β-actin as loading control. B: Kaplan-Meier plot showing overall survival for patients with loss (n = 6) and normal/gain (n = 12) of LSAMP copy number. C: Kaplan-Meier plot showing overall survival for patients with low (n = 11) and high (n = 7) expression of LSAMP, compared to the average expression of two normal bone samples.
Figure 3
Figure 3
LSAMP reexpression. A: LSAMP expression and protein level in clones with ectopic expression of LSAMP. The expression level was measured using qRT-PCR, using two probes (located in exon junction 1–2 and 6–7). The corresponding LSAMP protein level was determined using western blot, with β-actin as loading control. The clones are sorted according to whether they have undetectable, low, medium or high protein levels. B: Comparison of the endogenous levels of the LSAMP protein in the non-cancerous cell line HEPM and seven LSAMP-expressing clones with increasing amount of protein. C: Subcellular location of the ectopically expressed LSAMP protein in LSAMP-expressing cells (LSAMP #16) and control cells (Ctrl #1) determined using immunofluorescence confocal microscopy. Red color represents stain for anti-LSAMP-antibody, blue represents staining of the nuclei (DAPI).
Figure 4
Figure 4
Proliferation rate and in vivo tumor growth. A: Relative proliferation rate of LSAMP-expressing cells (LSAMP #7, #9 and #21) compared to cells without LSAMP-expression (Ctrl #1 and #2 and non-transfected cells). The experiment was performed twice. The midline is the median observation, and the whiskers represent the total spread of the observations. The difference was tested statistically significant with a Mann–Whitney test (p = 0.004). B: In vivo tumorigenicity measured as time until tumor appearance, represented by a Kaplan-Meier plot. The difference between the LSAMP-expressing cells (LSAMP #7, #9 and #21) and the cells without LSAMP-expression (Ctrl #1 and #2) was tested statistically significant by a Mantel-Cox test (p = 0.002).
Figure 5
Figure 5
Differential gene expression: A) Venn diagram showing the number of differentially expressed genes in the clones with low (LSAMP #7, #9 and #21), medium (LSAMP #11 and #17) and high (LSAMP #16 and #18) LSAMP protein level compared to the average of the two control clones (Ctrl #1 and #2). B: Validation of the mRNA expression profiling results for the genes HES1, CTAG2 and KLF10, determined by qRT-PCR. Fold change is compared to the average of the two control clones (Ctrl #1 and #2).

References

    1. Martin JW, Squire JA, Zielenska M. The genetics of osteosarcoma. Sarcoma. 2012;2012:627254. - PMC - PubMed
    1. Fletcher CDM, Unni KK, Mertens F. World Health Organization Classification of Tumours. Pathology and Genetics: Tumours of Soft Tissue and Bone. Lyon: IARCPress; 2002.
    1. Dorfman HD, Czerniak B. Bone cancers. Cancer. 1995;75:203–210. doi: 10.1002/1097-0142(19950101)75:1+<203::AID-CNCR2820751308>3.0.CO;2-V. - DOI - PubMed
    1. Mackall CL, Meltzer PS, Helman LJ. Focus on sarcomas. Cancer Cell. 2002;2:175–178. doi: 10.1016/S1535-6108(02)00132-0. - DOI - PubMed
    1. Helman LJ, Meltzer P. Mechanisms of sarcoma development. Nat Rev Cancer. 2003;3:685–694. doi: 10.1038/nrc1168. - DOI - PubMed

Publication types

MeSH terms

Substances

Associated data