

Reduced proteasome activity in the aging brain results in ribosome stoichiometry loss and aggregation
- PMID: 32558274
- PMCID: PMC7301280
- DOI: 10.15252/msb.20209596
Reduced proteasome activity in the aging brain results in ribosome stoichiometry loss and aggregation
Abstract
A progressive loss of protein homeostasis is characteristic of aging and a driver of neurodegeneration. To investigate this process quantitatively, we characterized proteome dynamics during brain aging in the short-lived vertebrate Nothobranchius furzeri combining transcriptomics and proteomics. We detected a progressive reduction in the correlation between protein and mRNA, mainly due to post-transcriptional mechanisms that account for over 40% of the age-regulated proteins. These changes cause a progressive loss of stoichiometry in several protein complexes, including ribosomes, which show impaired assembly/disassembly and are enriched in protein aggregates in old brains. Mechanistically, we show that reduction of proteasome activity is an early event during brain aging and is sufficient to induce proteomic signatures of aging and loss of stoichiometry in vivo. Using longitudinal transcriptomic data, we show that the magnitude of early life decline in proteasome levels is a major risk factor for mortality. Our work defines causative events in the aging process that can be targeted to prevent loss of protein homeostasis and delay the onset of age-related neurodegeneration.
Keywords: aging; lifespan; proteome; stoichiometry; transcriptome.
©2020 The Authors. Published under the terms of the CC BY 4.0 license.
Conflict of interest statement
The authors declare that they have no conflict of interest.
Figures
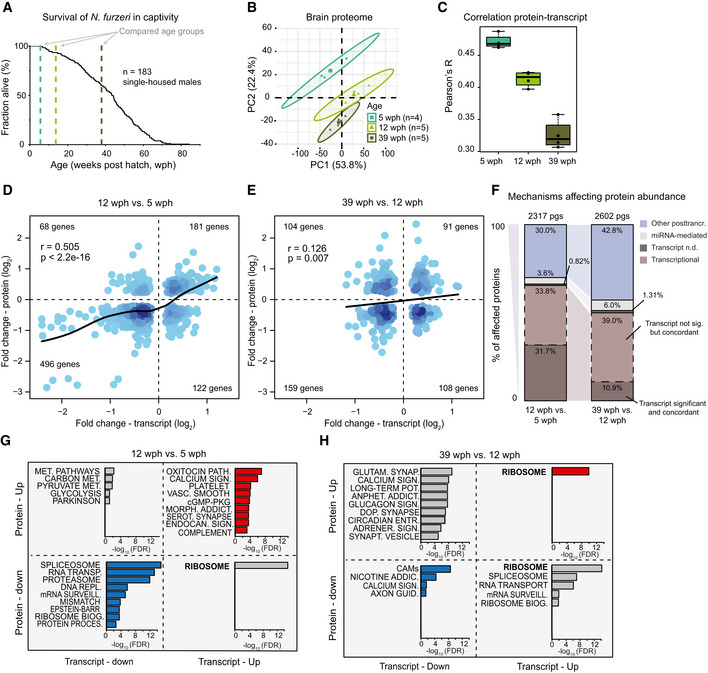
- A
Survival curve of N. furzeri in the FLI facility. Recording of deaths starts at age of 5 wph, which corresponds to sexual maturity, and the colored dashed lines indicate the three age groups analyzed in this study (five animals/group), namely 5 weeks post‐hatching (wph, young, sexual maturity), 12 wph (adult), and 39 wph (old, past median lifespan) of a wild‐derived strain that exhibits a median lifespan of 7–8 months.
- B
Principal component analysis (PCA) of brain samples based on the abundance of all proteins identified by label‐free mass spectrometry. The smaller dots represent individual samples and the larger dots the centroids of each age‐matched group. Ellipses represent 95% confidence intervals. The percentage of variance explained by the first two PC axes is reported in the axis titles.
- C
Global protein–transcript correlation for each sample, grouped by age. RPKM and iBAQ values were used to estimate transcript and protein levels from matched RNA‐seq and TMT‐based proteomics data obtained from the same animal. An ANOVA test was performed to evaluate significance among the age groups (mean correlation at 5 wph: 0.48; at 12 wph: 0.43; and at 39 wph: 0.33; P = 3.05e−07, n = 5 per age group). In boxplots, the horizontal line represents the median, the bottom, and top of the box the 25th and 75th percentile, respectively, and the whiskers extend 1.5‐fold the interquartile range.
- D, E
Scatter plot of log2 fold changes for genes differentially expressed both at transcript and protein levels (adj. P < 0.05). The color gradients indicate gene density in the regions where individual points overlap. Numbers of genes in each quadrant and the value of Pearson's coefficient of correlation, r, are reported for each graph. Solid lines represent a spline fit (r = 0.505 for genes significantly affected at both transcript and protein levels, P < 2.2 × 10⁻¹⁶, D; r = 0.126, P = 0.007, E).
- F
Mechanisms affecting protein abundance during aging. Barplots are based on all the proteins affected in either one of the age comparisons (adj. P < 0.05). Proteins were divided into following five groups: (i) proteins and transcripts with significant and consistent changes (dark brown), (ii) proteins with significant changes, and with consistent changes of the transcripts (light brown), (iii) proteins with no transcripts detected (dark gray), (iv) proteins with transcripts whose translation is potentially regulated by miRNAs (light gray), as assessed by the workflow displayed in Fig EV2D, and (v) all the remaining proteins that we classified as regulated by other post‐transcriptional mechanisms (violet). pgs, protein groups.
- G, H
Barplots representing enriched KEGG pathways among genes that showed significant changes at both transcript and protein levels in aging. Genes were grouped according to the four possible patterns of transcript and protein regulation, as visualized by their positions in the four quadrants shown in (D) and (E), respectively. Only pathways significantly enriched (FDR < 0.05) are shown. The complete list of enriched pathways is reported in Dataset EV4.
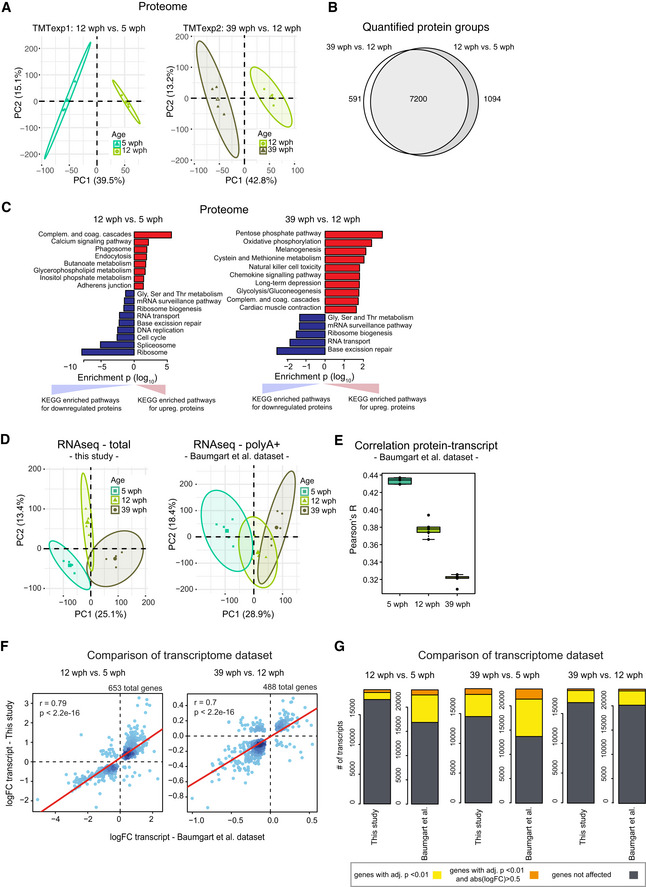
Principal component analysis (PCA) of brain samples based on proteome profiles obtained by tandem mass tag (TMT) quantification for the 12 vs 5 wph and 39 vs 12 wph comparisons. For each sample group, the four samples displaying the highest within group correlation were selected and used for differential expression analysis. The smaller dots represent individual samples and the larger dots the centroids of each age‐matched group. Ellipses represent 95% confidence intervals. The percentage of variance explained by the first two PC axes is reported in the axis titles.
Overlap between the quantified protein groups across the two TMT experiments. Only proteins quantified with at least two unique (proteotypic) peptides were considered.
Barplots representing enriched KEGG pathways among proteins affected by aging in killifish brain. Pathway enrichment was performed using gage (Luo et al, 2009). Significant pathways enriched among up‐regulated (red) or down‐regulated proteins (blue) are shown (P < 0.05). The complete list of enriched pathways is reported in Dataset EV2.
Principal component analysis (PCA) of brain samples based on total RNA (“this study”, same sample used for proteome analysis) or polyA+ RNA sequencing (Baumgart et al, 2014)). The smaller dots represent individual samples and the larger dots the centroids of each age‐matched group. Ellipses represent 95% confidence intervals. The percentage of variance explained by the first two PC axes is reported in the axis titles.
Correlation between transcript and protein during aging. RPKM and iBAQ values were used to estimate transcript and protein levels from RNA‐seq (Baumgart et al, 2014) and TMT‐based proteomics data (this study). Since in this case samples were not matched, proteomic data from each individual sample were compared against combined RPKM values obtained from the average of the samples for each group. The ANOVA test was performed to evaluate significance among the age groups (mean correlation at 5 wph: 0.43; at 12 wph: 0.38; and at 39 wph: 0.32; P = 2.02e−12, n = 5 per age group). In boxplots, the horizontal line represents the median, the bottom, and top of the box the 25th and 75th percentile, respectively, and the whiskers extend 1.5‐fold the interquartile range.
Comparison between RNA‐seq data obtained in this work and previous data obtained from (Baumgart et al, 2014). Fold changes (log2) were compared and plotted for both the aging comparisons (12 wph vs 5 wph and 39 wph vs 12 wph) for significantly affected transcripts in both comparisons (adj. P < 0.01).
Statistics of differentially expressed genes in the two RNA‐seq datasets. The same datasets used for G were analyzed. Differentially expressed genes obtained for three different age comparisons were compared between the datasets. Dark gray boxes correspond to not‐affected transcripts, while yellow (adj. P < 0.01) and orange (adj. P < 0.01 and absolute log2 fold change > 0.5) boxes to differentially expressed genes. The complete list of quantified transcripts is reported in Dataset EV3.
Analysis of age‐related changes of abundance for long‐lived proteins. Average fold changes (log2) are displayed as bars for transcripts (light blue) and proteins (dark blue), for a subset of extremely long‐lived proteins identified by (Toyama et al, 2013).
Validation of an increased level of glial fibrillary acidic protein (GFAP) in old killifish brain that manifests exclusively at the protein level. Double immunostaining for S100 (green) and GFAP (red) in the central region of the optic tectum of 7 wph fish (upper panels) vs 30 wph fish (lower panels). Scale bar = 100 μm. Average transcript and protein fold changes (log2) are displayed as bars for transcript (light blue) and protein (dark blue) levels of GFAP.
Age‐related changes of markers for specific cell types in the brain of Nothobranchius furzeri. Fold changes for different age pairwise comparisons (12 vs 5 wph in white; 39 vs 5 wph in blue) were plotted using the cell‐type markers from (Sharma et al, 2015) (in particular neuronal, oligodendrocytes, microglia, and astrocytes markers). For each cell type, the top 100 marker genes (ranked according to adj. P value) were plotted. Both transcriptome and proteome fold changes are displayed. In boxplots, the horizontal line represents the median, the bottom, and top of the box the 25th and 75th percentile, respectively, and the whiskers extend 1.5‐fold the interquartile range.
Workflow for the identification of proteins potentially affected by miRNA regulation during aging. For this analysis, proteins were divided into two groups: (i) proteins affected by aging (adj. P < 0.05) whose abundance change could be explained by transcript expression change and (ii) proteins affected by aging whose transcript was either regulated but with opposite fold change (discordant cases) or not regulated at all. miRNA analysis was performed only on the latter. To obtain a list of miRNAs affected by aging, differential expression was performed on both the age comparisons (12 vs 5 wph and 39 vs 12 wph) separately. The resulting list of miRNAs affected by aging is available in Dataset EV3.
- A
Abundance changes of ribosomal proteins and their transcripts during aging. Cytoplasmic ribosomal proteins of large and small subunits are displayed separately, and changes are shown for both the age comparisons as boxplots. Transcripts are displayed as light blue and proteins as dark blue boxes. Changes of individual proteins are displayed as dots; orange dots identify significant cases (adj. P < 0.05, n = 4 per age group for proteome and n = 5 per age group for transcriptome). In boxplots, the horizontal line represents the median, the bottom and top of the box the 25th and 75th percentile, respectively, and the whiskers extend 1.5‐fold the interquartile range.
- B
Visualization of age‐related changes of proteins and transcripts projected on the 80S ribosome complex structure. Ribosomal RNAs are depicted in ribbon form: 28S rRNA, 5S rRNA, and 5.8S rRNA of large subunit are depicted in light gray, and 18S rRNA of small subunit is depicted in black. Ribosomal proteins are depicted as molecular surfaces and shown only if significant changes in the level of corresponding mRNA or protein were detected. Affected proteins of large and small subunits are visualized in two different shades of red (up‐regulated), or blue (down‐regulated). For clarity, down‐regulated components are displayed as transparent molecular surfaces. Visualization was performed with USCF Chimera (version 1.12), according to Protein Data Bank archive— human 80S ribosome 3D model: 4UG0.
- C
Brains from young (5 wph) and old (39 wph) were homogenized and clarified lysates separated by size‐exclusion chromatography (SEC). For each age group, two pools of brains were processed separately. For each experiment (four in total), 39 fractions were collected along the chromatogram, digested into peptides, and analyzed by data independent acquisition (DIA) quantitative mass spectrometry.
- D
Co‐elution of members of protein complexes in SEC. For each experiment, the distribution of pairwise correlations between members of the same protein complex was analyzed (green). As expected, members of protein complexes tend to co‐elute in all SEC experiments, as indicated by positive correlation values. A set of randomly defined protein complexes was used as control (gray). For all the experiments, the correlations of real complexes are significantly higher than random ones, Wilcoxon rank‐sum test.
- E, F
Co‐elution profiles for selected protein complexes. For each complex, the median abundance of all the quantified subunits was used to generate the complex profile across fractions (Dataset EV5). All the complex profiles are scaled to the max value (set to 1) to make profiles comparable across experiments. The estimated molecular weight of the displayed complexes is indicated in brackets.
- G
Statistics of protein complexes undergoing stoichiometry changes with aging. Only protein complexes that had at least five members quantified were considered for each comparison. Complexes were considered affected if at least two members showed significant stoichiometry change (adj. P < 0.05 and absolute log2 fold change > 0.5). The complete list of stoichiometry changes is available in Dataset EV6.
- H
Violin plots depicting interquartile ranges (IQRs) of individual members of protein complexes during aging. The IQR for each protein complex considered in G was calculated using transcript (total RNA dataset, light blue) or protein (dark blue) log2 fold changes between two age groups (n = 4 per age group for proteome and n = 5 per age group for transcriptome). *P < 0.05, Wilcoxon rank‐sum test. The central line of the violin plots indicates the median value.
- I
Heatmap showing relative protein fold changes for members of selected complexes affected by aging. Names of significantly affected members in the 39 vs 12 wph comparison (adj. P < 0.05 and absolute log2 fold change > 0.5) are highlighted in bold with a star. Data information: Related to Fig EV3 and [Link], [Link].
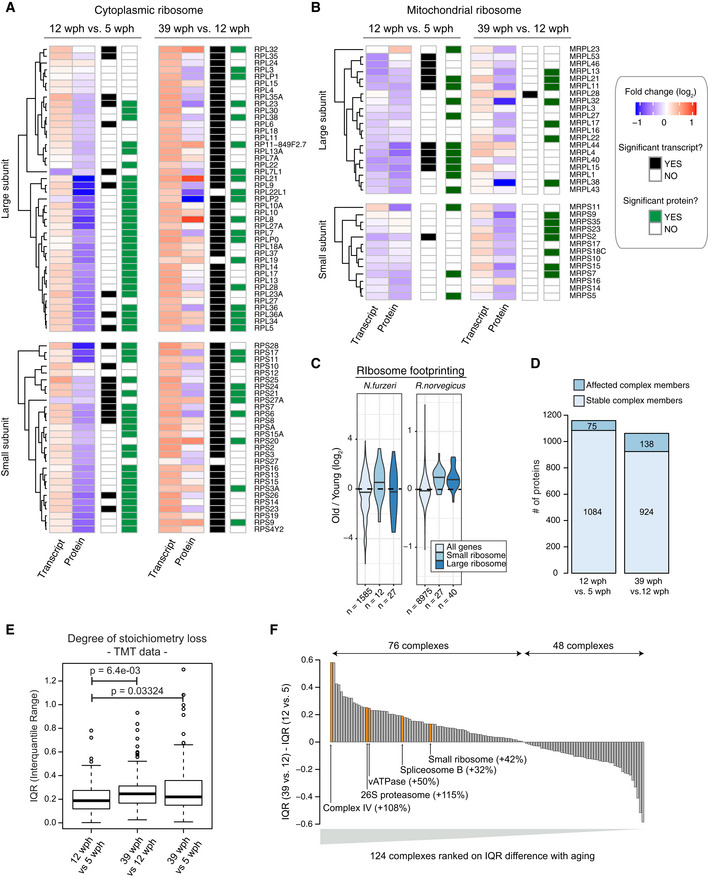
- A, B
Heatmap showing transcript and protein fold changes for members of the cytoplasmic (A) and mitochondrial (B) ribosome. Genes are annotated according to whether they are significantly affected at the transcript (adj. P < 0.05, black and white heatmap) or protein (adj. P < 0.05, black and green heatmap) level.
- C
Ribosome footprinting analysis of young and old killifish brain. Ribosome footprinting was performed from young (6 wph) and old (26 wph) killifish brains (n = 4 per age group). Fold changes were estimated for each gene from mean TPMs of young and old samples. For comparison, age‐related changes in translation output measured in rat brain from (Ori et al, 2015) are shown. The central line of the violin plots indicates the median value.
- D
Statistics of members of protein complexes undergoing stoichiometry changes with aging. Members were considered as affected when their abundance differed significantly (adj. P < 0.05) from the mean of the protein complex to which they belong, as described in Ori et al (2016). Only protein complexes that had at least five members quantified were considered for each comparison. The complete list of stoichiometry changes is available in Dataset EV6.
- E
Degree of stoichiometry loss across different age comparisons. The interquartile range (IQR) of fold changes for members of the same protein complex was used to estimate the degree of stoichiometry loss (Janssens et al, 2015). All the measurements were performed in a single TMT experiment (n = 3 for each age group), and P values were calculated using Wilcoxon rank‐sum test. In boxplots, the horizontal line represents the median, the bottom, and top of the box the 25th and 75th percentile, respectively, and the whiskers extend 1.5‐fold the interquartile range.
- F
Barplot showing the ranking of protein complexes based on the difference in protein level IQR for each complex between the 39 vs 12 wph and 12 vs 5 wph comparison. Selected complexes are highlighted and the percent of IQR increase between the two age comparisons is indicated in brackets.
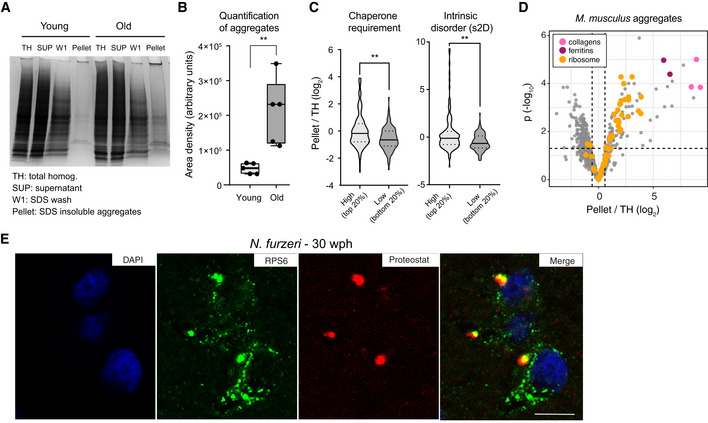
Representative Coomassie‐stained SDS–PAGE gel showing the isolation of SDS‐insoluble aggregates from mouse brain lysates. SUP = supernatant, TH = total homogenate, W1 = SDS‐soluble fraction, Pellet = formic acid soluble fraction (see Fig EV4A).
Quantification of the yield of SDS‐insoluble aggregates from young and old brain lysates was based on densitometry analysis of Coomassie‐stained gel bands obtained from different animals, n = 5 per age group (Fig EV4B); **P < 0.01, unpaired t‐test. In boxplots, the horizontal line represents the median, the bottom, and top of the box the 25th and 75th percentile, respectively, and the whiskers extend 1.5‐fold the interquartile range.
Proteins enriched in aggregates show a predicted higher molecular chaperone requirement for folding (top vs bottom 20% P = 0.0055, Kolmogorov–Smirnov test) and are richer in intrinsically disordered regions (s2D‐derived scores, top vs bottom 20% P = 0.0019, Kolmogorov–Smirnov test). Violin plots: The solid line shows the median and the dotted lines the interquartile ranges. The same result was obtained with cleverSuite‐derived scores (top vs bottom 20% P = 0.0201, Kolmogorov–Smirnov test; Fig EV4C). **P < 0.01, Kolmogorov–Smirnov test.
Volcano plot based on protein quantification by label‐free mass spectrometry depicting the enrichment of specific proteins in protein aggregates. The x‐axis indicates the log2 ratio between protein abundance in aggregates (Pellet) and starting total homogenate (TH). The horizontal dashed line indicates a P value cut‐off of 0.05 and vertical lines a log2 fold change cut‐off of ± 0.5. Selected proteins are highlighted as colored dots as indicated in the figure legend. Protein quantification was based on samples obtained from three independent isolations.
Double labeling of telencephalic sections of Nothobranchius furzeri with anti‐RPS6 (green) as ribosomal marker and Proteostat as a marker for aggregated proteins (red). Nuclear counterstaining was performed with DAPI (blue). Scale bar = 10 μm.
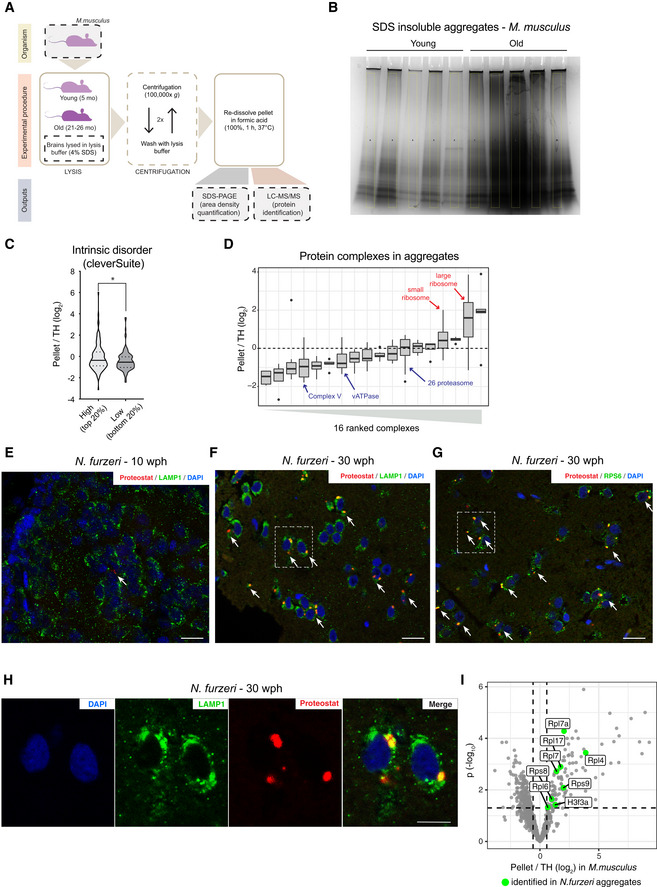
- A
Workflow for the isolation of SDS‐insoluble aggregates from mouse brain lysates.
- B
Coomassie‐stained SDS–PAGE gel used for quantification of SDS‐insoluble aggregates obtained from young and old mouse brain shown in Fig 3B. For each sample, a region of interest of the same area was selected for densitometry quantification (highlighted in yellow).
- C
Plot representing the fold enrichment in the insoluble fraction of protein with either high (top 20% scores) or low (bottom 20% scores) content of intrinsically disordered region, as predicted with the cleverSuite classifier. Violin plots: The solid line shows the median and the dotted lines the interquartile ranges. *P < 0.05, Kolmogorov–Smirnov test.
- D
Boxplots of complexes ranked according to the median enrichment of protein complex members in the aggregates (n = 3 per group). Only complexes with at least 3 members quantified were considered. In boxplots, the horizontal line represents the median, the bottom, and top of the box the 25th and 75th percentile, respectively, and the whiskers extend 1.5‐fold the interquartile range.
- E–G
Double labeling of telencephalic sections of Nothobranchius furzeri with Proteostat as a marker of aggregated proteins (red) and anti‐LAMP1 as lysosomal marker (E and F, green), or RPS6 to evidence the ribosomal component of protein aggregates in old fish (G, green). Nuclear counterstaining was performed with DAPI (blue). The region of interest shown in Fig 3E and in (H) is indicated by a white box. Scale bars = 20 μm.
- H
Magnification of the selected area in (F) showing a detail of the co‐localization between lysosomal structures (green) and protein aggregates (red) in the old brain. Scale bar = 10 μm.
- I
Ribosomal proteins enriched in mouse aggregates can also be identified in N. furzeri aggregates. Volcano plot based on protein quantification by label‐free mass spectrometry depicting the enrichment of specific proteins in protein aggregates in mice (same as shown in Fig 3D). The x‐axis indicates the log2 ratio between protein abundance in aggregates (Pellet) and starting total homogenate (TH). The horizontal dashed line indicates a P value cut‐off of 0.05 and vertical lines a log2 fold change cut‐off of ± 0.5. Proteins identified in mouse and killifish aggregates are highlighted as green dots (the entire list of proteins identified in killifish aggregates with at least two unique peptides in at least one replicate is reported in Dataset EV7).
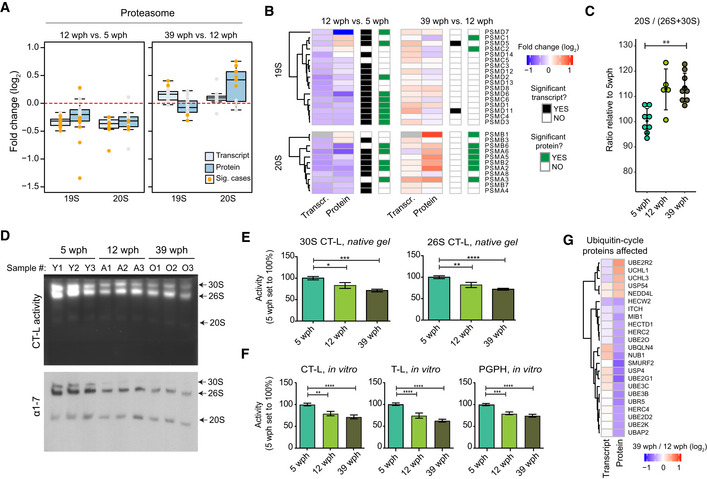
Abundance changes of proteasome proteins and their transcripts during aging. Members of the 19S and 20S complex are displayed separately, and changes are shown for both the age comparisons as boxplots. Transcripts are displayed as light blue and proteins as dark blue boxes. Changes of individual proteins are displayed as dots and orange dots represent significant cases (adj. P < 0.05, n = 4 per age group for proteome and n = 5 per age group for transcriptome). In boxplots, the horizontal line represents the median, the bottom, and top of the box the 25th and 75th percentile, respectively, and the whiskers extend 1.5‐fold the interquartile range.
Heatmap showing transcript and protein fold changes for members of the 26 proteasome (19S and 12S complexes). Genes are annotated according to significance of their changes at the level of transcript (adj. P < 0.05: black, adj. P > 0.05: white) or protein (adj. P < 0.05: green, adj. P > 0.05: white).
The between 20S and 26S + 30S proteasome abundance assessed by immunoblot on native gels (Fig EV5A). **P < 0.001, Wilcoxon rank‐sum test. The bars indicate mean ± SD.
In‐gel proteasome assay following native gel electrophoresis (top) and immunoblotting of proteasome complexes (30S, 26S and 20S; bottom) in young (5 wph), adult (12 wph), and old (39 wph) killifish brains. For additional samples and low exposure pictures, see Fig EV5B and C.
Barplots depicting the quantification of chymotrypsin‐like (CT‐L) activity from native gels calculated for doubly capped (30S) or singly capped (26S) proteasomes. n ≥ 5 per sample group; error bars indicate standard error of the mean. *P < 0.05, **P < 0.005, ***P = 0.0001, ****P < 0.001, one‐way ANOVA, Holm–Sidak's multiple comparison test. For each sample group, the mean value of activity in young samples (5 wph) was set to 100%.
Percentage (%) of chymotrypsin‐like (CT‐L), trypsin‐like (T‐L), and peptidylglutamyl peptide hydrolyzing or caspase‐like (PGPH) proteasome activities in brain extracts of killifish of different ages. n ≥ 6 per sample group; error bars indicate standard error of the mean. **P < 0.005, ***P = 0.0001, ****P < 0.001, one‐way ANOVA, Holm–Sidak's multiple comparison test. For each sample group, the mean value of each activity in young samples (5 wph) was set to 100%.
Age‐related changes of proteins involved in the ubiquitin cycle. All the displayed proteins showed significant protein level changes in the 39 vs 12 wph comparison (adj. P < 0.05).
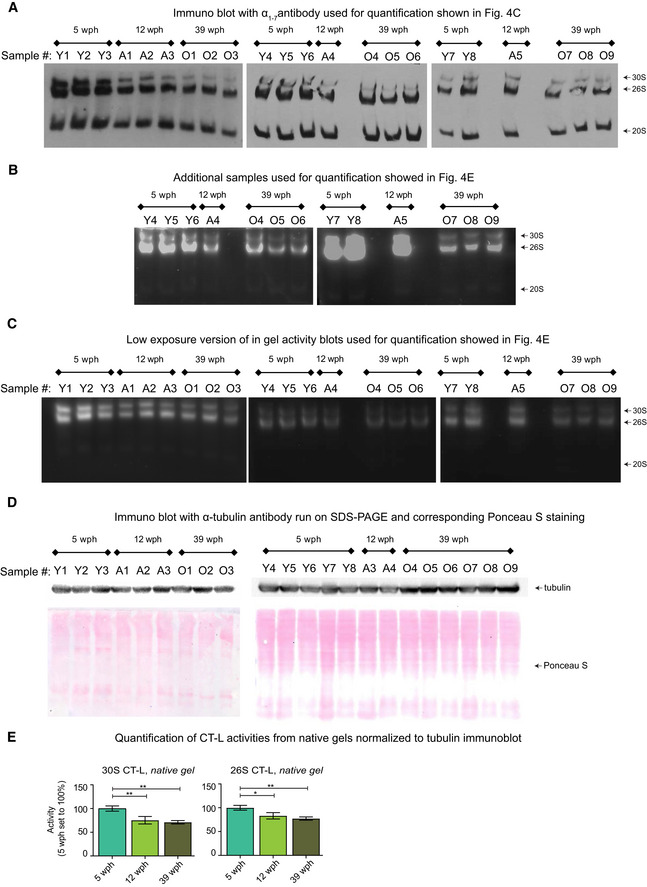
Immunoblot following native gel electrophoresis in brain extracts of killifish of different ages using an antibody recognizing the ⍺ subunits (1–7) of the proteasome.
In‐gel proteasome activity following native gel electrophoresis in brain extracts of killifish of different ages. This independent group of samples was quantified together with the ones displayed in Fig 4D, and the quantification results are displayed in Fig 4E.
Low exposure of the blots shown in Figs 4D and EV5B. The loading of the native PAGE was based on protein quantification using the Bradford method, as described in Myeku et al (2011)
Equal protein loading was confirmed by Ponceau S (bottom) and immunoblotting (top) against the housekeeping protein α‐tubulin (T9026, Sigma, 1:5,000) using the same samples.
Barplots depicting the quantification of chymotrypsin‐like (CT‐L) activity from native gels normalized to α‐tubulin immunoblot. Activity of doubly capped (30S) or singly capped (26S) proteasomes is shown. n ≥ 5 per sample group; error bars indicate standard error of the mean. *P < 0.05, **P < 0.005, one‐way ANOVA, Holm–Sidak's multiple comparisons test. For each sample group, the mean value of activity in young samples (5 wph) was set to 100%.
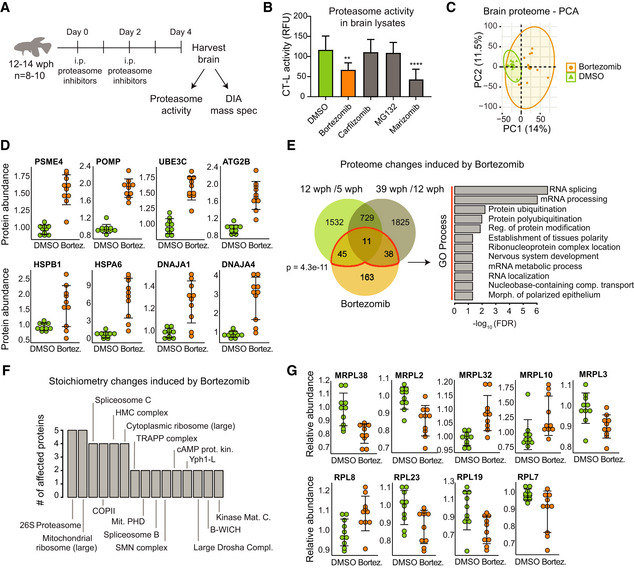
Study design. Adult (12–14 wph) killifish were treated with different proteasome inhibitors or vehicle control for 4 days. Proteasome activity and proteome changes were analyzed in brains from treated and control fish.
Chymotrypsin‐like (CT‐L) proteasome activity in brain extracts of killifish treated with different proteasome inhibitors. The activity was measured at day 4 after the beginning of treatment. n = 8 per sample group; error bars indicate standard deviation. **P < 0.01, ****P < 0.0001, one‐way ANOVA followed by Holm–Sidak's multiple comparisons test.
Principal component analysis (PCA) of brain samples based on proteome profiles obtained by data independent acquisition (DIA) quantification treated with Bortezomib or vehicle control (DMSO). n = 10 per sample group. The smaller dots represent individual samples and the larger dots the centroids of each age‐matched group. Ellipses represent 95% confidence intervals. The percentage of variance explained by the first two PC axes is reported in the axis titles.
Proteasome inhibition induces proteasome activators (PSME4), assembly factors (POMP) ubiquitin ligases (UBE3C), mediators of autophagosome formation (ATG2B), heat shock proteins, and chaperones in killifish brain. Protein abundances were quantified by DIA mass spectrometry, and they are shown relative to the mean value of vehicle control samples (DMSO) set to 1, n = 10 per sample group. Adj. P < 0.05 for all the displayed proteins. Error bars indicate mean ± SD.
Overlap between proteins affected by Bortezomib treatment and aging in killifish brain. For all comparisons, only significantly affected proteins adj. P < 0.05 were considered. A significant overlap between Bortezomib and aging‐affected proteins is detected (Fisher's test, as indicated in the figure panel). Significantly enriched GO biological process terms in the subset of overlapping proteins are indicated (FDR < 0.05).
Bortezomib treatment affects the stoichiometry of a subset of protein complexes. The number of affected proteins (adj. P < 0.25) for each protein complex is indicated. Only protein complexes that had at least two members affected are shown.
Members of the mitochondrial and cytoplasmic ribosomes affected by Bortezomib treatment. Relative protein abundances (normalized to the mean of the protein complex to which they belong) are shown. The mean value of vehicle control samples (DMSO) was set to 1. n = 10 per sample group. Adj. P < 0.25 for all the displayed proteins. Error bars indicate mean ± SD.
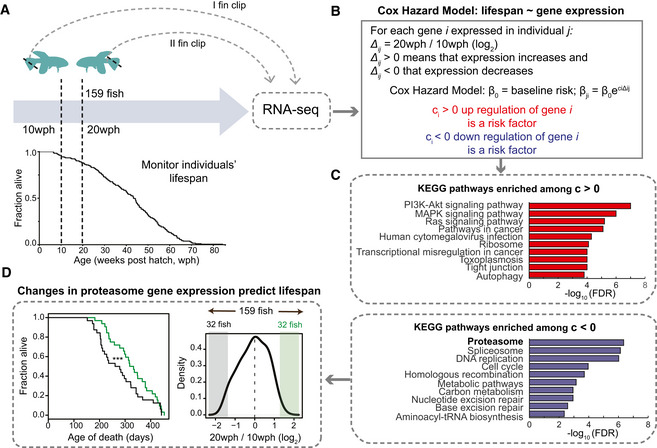
Study design. Two fin clips were taken at 10 and 20 weeks post‐hatching (wph) from 159 killifish and individual lifespans monitored. RNA sequencing was employed to compare transcriptome changes between 10 and 20 wph for each individual fish.
A Cox–Hazard model was used to correlate lifespan to gene expression changes. Two groups of genes were identified: (i) genes whose increased expression between 20 and 10 wph is a risk factors (i.e., associated to increased mortality risk; red) and (ii) genes whose decreased expression is a risk factors (blue).
KEGG pathways enriched among genes whose regulation is associated to mortality. Only pathways with FDR < 0.05 are shown.
Distribution of change in expression for proteasome transcripts across the entire cohort of 159 fish. Lifespan was compared among fish that showed extreme changes in proteasome levels between 10 and 20 wph (32 fish showing the most pronounced decreases, shown in black vs 32 fish showing the most pronounced increases). ***P < 0.001 log‐rank test.
References
-
- Assoc AS (2018) 2018 Alzheimer's disease facts and figures. Alzheimers Dement 14: 367–425
-
- Baumgart M, Priebe S, Groth M, Hartmann N, Menzel U, Pandolfini L, Koch P, Felder M, Ristow M, Englert C et al (2016) Longitudinal RNA‐seq analysis of vertebrate aging identifies mitochondrial complex I as a small‐molecule‐sensitive modifier of lifespan. Cell Syst 2: 122–132 - PubMed
Publication types
MeSH terms
Substances
Associated data
- Actions
- Actions
- Actions
- Actions
- Actions
- Actions
LinkOut - more resources
Full Text Sources
Other Literature Sources
Medical
Molecular Biology Databases
