. 2014 Feb 20;15(2):R37.
doi: 10.1186/gb-2014-15-2-r37.

The relationship between DNA methylation, genetic and expression inter-individual variation in untransformed human fibroblasts

The relationship between DNA methylation, genetic and expression inter-individual variation in untransformed human fibroblasts

James R Wagner et al. Genome Biol. .

Abstract

Background: DNA methylation plays an essential role in the regulation of gene expression. While its presence near the transcription start site of a gene has been associated with reduced expression, the variation in methylation levels across individuals, its environmental or genetic causes, and its association with gene expression remain poorly understood.

Results: We report the joint analysis of sequence variants, gene expression and DNA methylation in primary fibroblast samples derived from a set of 62 unrelated individuals. Approximately 2% of the most variable CpG sites are mappable in cis to sequence variation, usually within 5 kb. Via eQTL analysis with microarray data combined with mapping of allelic expression regions, we obtained a set of 2,770 regions mappable in cis to sequence variation. In 9.5% of these expressed regions, an associated SNP was also a methylation QTL. Methylation and gene expression are often correlated without direct discernible involvement of sequence variation, but not always in the expected direction of negative for promoter CpGs and positive for gene-body CpGs. Population-level correlation between methylation and expression is strongest in a subset of developmentally significant genes, including all four HOX clusters. The presence and sign of this correlation are best predicted using specific chromatin marks rather than position of the CpG site with respect to the gene.

Conclusions: Our results indicate a wide variety of relationships between gene expression, DNA methylation and sequence variation in untransformed adult human fibroblasts, with considerable involvement of chromatin features and some discernible involvement of sequence variation.


Figures

Figure 1
Figure 1
Fibroblast methylation beta values are bimodal and the two modes show different breakdown in terms of CpG islands and genes. Distribution of methylation beta values in type II probes across the genome, partitioned by position relative to (A) CpG islands (with a shore defined by Illumina as less than 2 kb from an annotated CpG island, a shelf as 2 to 4 kb, and open sea as more than 4 kb) and (B) annotated genes.
Figure 2
Figure 2
Mean and variance of beta values of CpG probes associate with several genome marks. Proportion of type II CpG probes falling in various types of genomics regions identified by ENCODE, partitioned by (A) CpG probe mean beta value and (B) percentile of beta value standard deviation (Std. dev.). All data types, except for 28-way conservation, are derived from broad peaks in BJ human foreskin fibroblast cells.
Figure 3
Figure 3
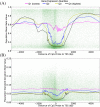
The mean and variance of beta values of CpG probes near transcription start sites depend on the gene’s expression level. Mean (A) and standard deviation (B) of type II CpG probes with respect to their position relative to TSSs of annotated genes. Each green dot corresponds to a CpG probe, and the four lines show the running median for probes based on the quartile of the expression level (from RNA-seq in four individuals) of the gene they are associated with.
Figure 4
Figure 4
Variable CpG sites are more likely to be correlated with expression or sequence. Proportion of probes being significantly correlated (5% FDR) to either an mQTL or a gene’s expression levels, by percentile of population standard deviation.
Figure 5
Figure 5
mQTLs are preferentially close to CpG sites. (A) Distribution of the mQTL to CpG probe distances for all correlated SNP-CpG pairs at 5% FDR. For each CpG probe, when more than one SNP is significantly correlated, a single one is retained as having either the most significant correlation (gray bars) or being located closest to the CpG probe (black bars). (B) Quantile-quantile plot of SNP/CpG probe Spearman’s rho P-values, grouped by pairwise distances. For each CpG probe included in the mQTL analysis, the most strongly correlated SNP within 250 kb was identified and the P-value obtained included in the set of P-values to be plotted for the distance bin in question. All SNPs in linkage disequilibrium with the selected SNP (R2 > 0.8) were removed, and the next most strongly correlated SNP was taken, until all SNPs within the range of the CpG probe in question were considered. The number of significant mQTLs decays with distance, but is still more than expected by chance at distances greater than 100 kb.
Figure 6
Figure 6
eQTLs are concentrated near the transcription start and end sites of genes. (A) Distribution of the distance between eQTLs and the closest of the boundaries (TSS or TES) of the gene whose expression they correlated with, for all pairs at 5% FDR. When a gene’s expression correlates significantly with more than one SNP, a single SNP is retained as having either the set of genotypes with the most significant correlation (gray bars) or being the most proximal to one of the two gene boundaries (TSS or TES). (B,C) Quantile-quantile plot of SNP/gene P-values, grouped by distances from the SNP to TSS (B) and TES (C). Selection of P-values to be plotted followed a similar procedure to that in Figure 4B, with all SNPs located up to 250 kb on either side of the gene boundaries or within the gene body included for consideration.
Figure 7
Figure 7
aeQTLs are concentrated near boundaries of aeRegions. Distribution of the distance between aeRegion boundary and the SNP they correlate with (5% FDR). When an aeRegion’s allelic expression correlates significantly with more than one SNP, a single SNP is retained as having either the set of genotypes with the most significant correlation (gray bars) or being the most proximal to one of the two aeRegion boundaries (black bars).
Figure 8
Figure 8
CpG sites where methylation positively or negatively correlates with expression differ with respect to chromatin marks. Proportion of CpG probes having various chromatin marks in at least one of five ENCODE fibroblast cell lines or located at various positions with respect to genes, with CpG probes grouped into three categories based on the type of correlation seen with an adjacent gene expression values.
Figure 9
Figure 9
Positive and negative methylation/expression correlations are seen at all positions with respect to the gene. (A) Distribution of the distance between expression-correlated CpGs and the closest of the boundaries (TSS or TES) of the gene whose expression they correlated with, for all pairs at 5% FDR. When a gene's expression correlates significantly with more than one CpG site, it is retained as having either the set of methylation beta values with the most significant correlation (gray bars) or being the most proximal to one of the two gene boundaries (TSS or TES) (black bars). (B) Quantile-quantile plot of methylation/expression rank based correlation (Spearman’s rho), grouped by distances from the SNP to gene boundaries.
Figure 10
Figure 10
The proportion of CpG sites where methylation correlates with expression depends on the site location, DHS and histone marks. Proportion of CpG probes showing correlation with gene expression, ±95% confidence interval, for probes located in intergenic regions (left), within 1.5 kb of the TSS (middle), or within the gene body (right), and showing either negative (top row) and positive (bottom row) correlation, depending on the presence of DHS, H3K4me3 and H3K27me3. For DHS and H3K4me3 marks, the individual bars are based on the number (out of five) of ENCODE fibroblast cell lines that have the mark in question.
Figure 11
Figure 11
Methylation-expression relationships in genomic context. Schematic of significant methylation-expression relationships for (A-D) the four HOX clusters, and (E,F) genes TBX1 and TBX3. Gold and blue lines link the TSS of the gene and the CpG probes correlated to that gene’s expression, with gold indicating negative correlation and blue indicating positive correlation. Red and blue blocks above indicate the presence of DHS or H3K4me3 marks in at least one of five ENCODE fibroblast cell lines. Where a domain boundary from Dixon et al.[28] was found, the domains are indicated with distinct colors.
Figure 12
Figure 12
Overlap of genes with an eQTL, genes with expression correlated with methylation, and genes adjacent to mQTLs. Number of genes corresponding to various categories or relationships.
Figure 13
Figure 13
emQTL relationships in genomic context. Schematic of methylation-sequence-expression relationships in the loci surrounding the (A)C21ORF56, (B)PAX8, (C)GSTM1-GSTM5, and (D)GSTT1-GSTT2 genes. Annotations are similar to those in Figure 13, with added grey and cyan lines indicating mQTL and eQTL relationships, respectively.

References

    1. Payer B, Lee JT. X chromosome dosage compensation: how mammals keep the balance. Annu Rev Genet. 2008;42:733–772. doi: 10.1146/annurev.genet.42.110807.091711. - DOI - PubMed
    1. Yoder JA, Walsh CP, Bestor TH. Cytosine methylation and the ecology of intragenomic parasites. Trends Genet. 1997;13:335–340. doi: 10.1016/S0168-9525(97)01181-5. - DOI - PubMed
    1. Li E, Beard C, Jaenisch R. Role for dna methylation in genomic imprinting. Nature. 1993;366:362–365. doi: 10.1038/366362a0. - DOI - PubMed
    1. Baylin SB, Herman JG, Graff JR, Vertino PM, Issa JP. Alterations in DNA methylation: a fundamental aspect of neoplasia. Adv Cancer Res. 1998;72:141–196. - PubMed
    1. Kass SU, Landsberger N, Wolffe AP. DNA methylation directs a time-dependent repression of transcription initiation. Curr Biol. 1997;7:157–165. doi: 10.1016/S0960-9822(97)70086-1. - DOI - PubMed

Publication types

Associated data