. 2014 Mar 27;507(7493):448-54.
doi: 10.1038/nature13163. Epub 2014 Mar 19.

REST and stress resistance in ageing and Alzheimer's disease

Affiliations

REST and stress resistance in ageing and Alzheimer's disease

Tao Lu et al. Nature. .

Erratum in

Abstract

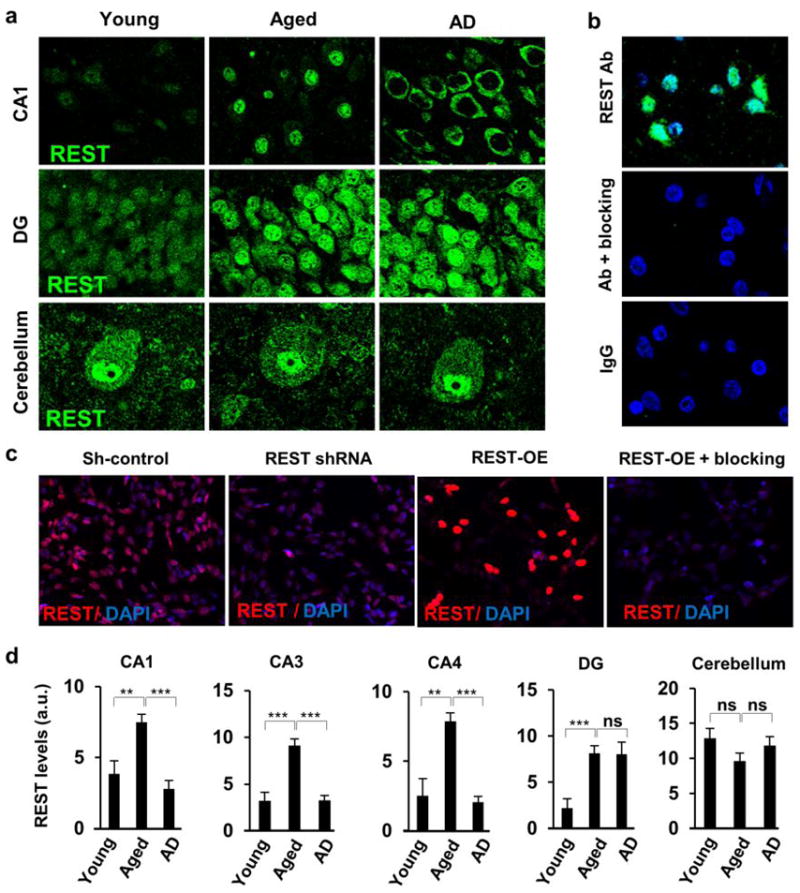
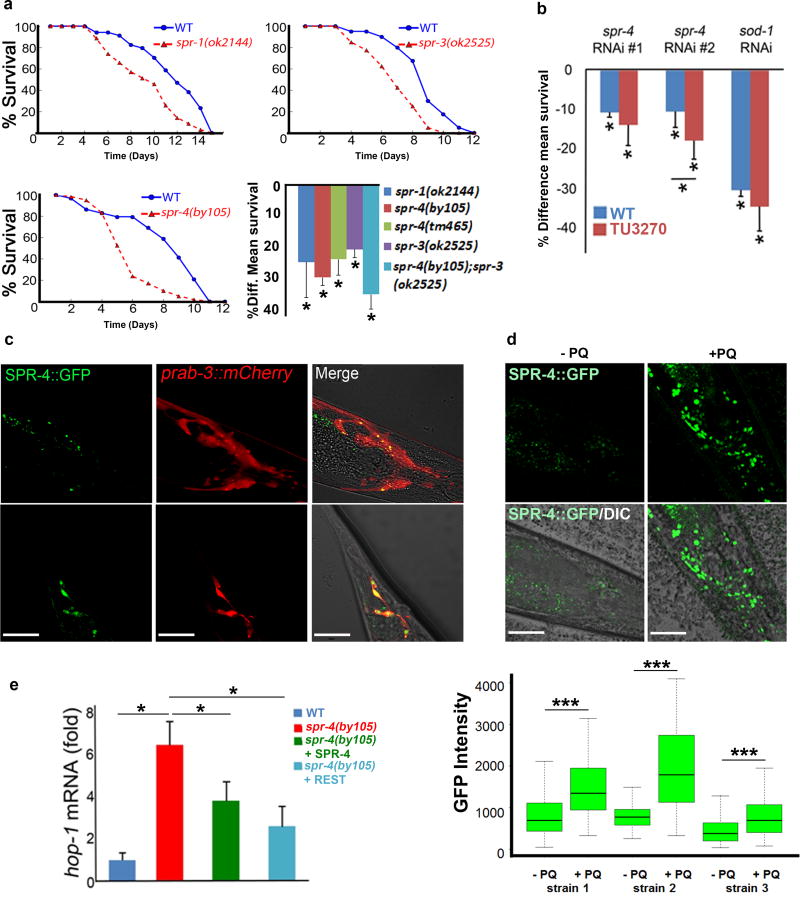
Human neurons are functional over an entire lifetime, yet the mechanisms that preserve function and protect against neurodegeneration during ageing are unknown. Here we show that induction of the repressor element 1-silencing transcription factor (REST; also known as neuron-restrictive silencer factor, NRSF) is a universal feature of normal ageing in human cortical and hippocampal neurons. REST is lost, however, in mild cognitive impairment and Alzheimer's disease. Chromatin immunoprecipitation with deep sequencing and expression analysis show that REST represses genes that promote cell death and Alzheimer's disease pathology, and induces the expression of stress response genes. Moreover, REST potently protects neurons from oxidative stress and amyloid β-protein toxicity, and conditional deletion of REST in the mouse brain leads to age-related neurodegeneration. A functional orthologue of REST, Caenorhabditis elegans SPR-4, also protects against oxidative stress and amyloid β-protein toxicity. During normal ageing, REST is induced in part by cell non-autonomous Wnt signalling. However, in Alzheimer's disease, frontotemporal dementia and dementia with Lewy bodies, REST is lost from the nucleus and appears in autophagosomes together with pathological misfolded proteins. Finally, REST levels during ageing are closely correlated with cognitive preservation and longevity. Thus, the activation state of REST may distinguish neuroprotection from neurodegeneration in the ageing brain.


Conflict of interest statement

The authors declare no competing financial interests.

Figures

Extended Data Figure 1
Extended Data Figure 1. Neuroanatomical distribution of REST induction in the aging human brain
a. Representative confocal photomicrographs of hippocampal CA1 pyramidal neurons (upper panel), dentate gyrus granule neurons (middle panel, DG) and cerebellar Purkinje and granule cell neurons (lower panel), from young, aged or AD cases that were labeled for REST (green). Note the increased expression of REST in hippocampal CA1 pyramidal and dentate granule cell neurons in aged cases relative to young adult cases. Also note that nuclear REST is markedly reduced in AD in hippocampal CA1 neurons, but not in dentate granule cell or cerebellar neurons. b. Specificity of REST immunohistochemistry. Shown are sections of normal aged PFC labeled with anti-REST (Bethyl) (upper panel), anti-REST preincubated with a REST blocking peptide (middle panel), and non-specific IgG (lower panel). REST labeling is green; nuclear labeling with DAPI is blue. c. REST knockdown (REST shRNA) and overexpession (REST-OE) in SH-SY5Y cells confirm antibody specificity. Also shown is labeling with antibody preincubated with REST blocking peptide (REST-OE+blocking). REST knockdown and overexpression were confirmed by Western blotting (Extended Data Fig. 3b). d. Quantification of nuclear REST levels in hippocampal CA1, CA3, CA4 regions, in dentate gyrus granule cells (DG), and in cerebellar Purkinje cell neurons. REST is induced with age in CA1, CA3, CA4 and DG neurons, but not in cerebellar neurons. REST expression is reduced in AD in CA1, CA3, and CA4 neurons, but not in DG or cerebellar neurons. CA1: young n=11, aged n=30, AD n=33. CA3, CA4, DG and cerebellum: young n=8–9, aged n=7–8, AD= 9–10. Values are the mean ±S.E.M., * p<0.05, ** p<0.01 and *** p<0.001 by Student’s unpaired t-test. Scale bar: 25 μm.
Extended Data Figure 2
Extended Data Figure 2. ChIP-seq analysis of REST target genes shows enrichment for genes related to cell death and the pathology of AD
a. Genes identified by REST ChIP-seq in SH-SY5Y cells are downregulated in the aging human PFC. Expression of age-regulated REST target genes identified by ChIP-seq shows a highly significant inverse correlation with age at death. For each case, a weighted expression index was derived for age-regulated target genes based on microarray analysis. These values were normalized to the youngest adult value (24 yrs; 100%). N=43, age range 24–106 yrs. b. Canonical pathways by Ingenuity IPA analysis of REST ChiP-seq targets. c. REST ChIP-seq binding peaks in genes related to cell death pathways and AD pathology. d. Confirmation of ChIP-seq targets by quantitative ChIP-PCR following REST overexpression (OE-REST) or REST knockdown (sh-RESTa and sh-RESTb) in SH-SY5Y cells. Shown is ChIP followed by real time PCR using primers that amplify REST binding sites identified by ChIP-seq. PCR amplification of a region of the actin promoter not proximal to a known RE1 site was used as a negative control. Values are normalized to the input control and represent the mean±S.E.M., n=3. *P<0.05 relative to control by Student’s unpaired t-test.
Extended Data Figure 3
Extended Data Figure 3. REST regulates expression of genes related to cell death and the neuropathology of AD
a. REST knockdown with either of two distinct shRNAs (sh-RESTa and sh-RESTb) significantly increase mRNA expression of ChIP-seq targets related to cell death and AD pathology, whereas REST overexpression (REST) represses gene expression. Values are the mean ± S.D., n=3. *P<0.05 by Student’s unpaired t-test. b. Shown are Western blots of lysates from SH-SY5Y cells transduced with a control lentiviral vector (CTRL), or 3 separate REST shRNAs (sh-REST; each lane represents a different shRNA) or REST cDNA (REST) to knockdown or overexpress REST, respectively. c. REST knockdown (sh-REST) markedly induces phosho-tau epitopes (PHF-1 and AT8). Induction of these epitopes is blocked by lithium chloride (LiCl), an inhibitor of the tau kinase GSK3β.
Extended Data Fig. 4
Extended Data Fig. 4. REST protects against oxidative stress
a. Cortical neuronal cultures from REST-deficient (REST cKO) mice show extensive neuritic degeneration relative to control cultures after incubation with 5 μM oligomeric Aβ42 for 24 hrs, which is prevented by lentiviral transduction of REST (REST cKO + REST). Neuritic processes are labeled with antibody TUJ1. Scale bar: 30 μm. b. Pro-apoptotic genes show increased mRNA expression in REST-deficient cortical neuronal cultures after treatment with hydrogen peroxide (50 μM H2O2, 3 hrs) or oligomeric Aβ42 (5 μM, 8 hrs). Increased expression was reversed by lentiviral transduction of REST (REST cKO+REST). Values are the mean ±S.E.M., n=4. *P<0.05 by Student’s unpaired t-test. c. REST knockdown potentiates hydrogen peroxide-induced apoptosis in SH-SY5Y cells. Increased cell death was prevented by transducing a REST construct (mouse REST) resistant to the shRNA. Cells were incubated with 800 μM H2O2 for 2 hrs, and apoptotic cells were quantified by FACS analysis of Annexin V-APC. Values represent fold change relative to the untreated control. d. REST knockdown (Sh-REST) increases vulnerability to oxidative stress in cultured primary human cortical neurons treated with 100 μM H2O2 for 2 hrs relative to control cultures (Sh-CTRL). e. REST knockdown increases generation of reactive oxygen species (ROS). Shown are FACS profiles of a fluorescent ROS indicator (CellRox). Note right-ward shift (increased ROS) in H2O2-treated (600 μM, 2 hrs) SH-SY5Y cells (red) vs untreated controls (blue) following lentiviral transduction of REST shRNA (Sh-REST). f. Increased ROS levels in SH-SY5Y cells expressing either of two different REST shRNAs (sh-RESTa and sh-RESTb) is reversed by the antioxidant N-acetyl cysteine (NAC, 5 mM). g. REST protects against oxidative DNA damage. Shown is a measure of DNA fragmentation in the Comet Assay following treatment of SH-SY5Y cells with H2O2. Note increase in DNA damage induced by either of two REST shRNAs (Sh-RESTa and Sh-RESTb) relative to cells transduced with a control shRNA (Sh-CTRL). Conversely, overexpression of REST reduces oxidative DNA damage relative to overexpression of GFP (CTRL). Horizontal bars indicate the mean value. **P<0.0001 by the Mann-Whitney test; n=114–134. Values in b, c, d and f represent the mean ± S.E.M, n=6–10, *P<0.05, **P<0.01 by Student’s unpaired t-test. h. Inverse correlation between oxidative DNA damage and nuclear REST levels in normal aging and early AD (AD1). Shown is double-labeling for REST and 8-oxoguanine (8oxoG) in hippocampal CA1 neurons. Scale bar, 20μm.
Extended Data Figure 5
Extended Data Figure 5. Caenorhabditis elegans spr genes and oxidative stress resistance
a. Mutations of spr-1, spr-3 and spr-4 reduce survival in the presence of oxidative stress. Worms were continuously incubated with the superoxide-generating agent paraquat (5 mM). Shown are representative time courses of survival, and quantification of reduced mean lifespan relative to wild-type in worms incubated with paraquat. Shown are mutants in spr-1 and spr-3, two different mutants in spr-4, and a double spr-3/spr-4 mutant [spr-4(by105);spr-3(ok2525)]. The spr-4(by105);spr-3(ok2525) mutant showed similar survival to wild-type in the absence of paraquat. Values represent the decrease in mean lifespan as % relative to wild-type and represent the mean ± S.D., n=3. *P<0.05 by log-rank test. b. Depletion of spr-4 by RNAi increases sensitivity to oxidative stress and phenocopies the spr-4(by105) mutation. Worms were fed RNAi against the indicated genes or an empty vector control and then transferred to plates seeded with standard OP50 bacteria and containing 5 mM paraquat. Shown is the percent decrease in mean survival relative to the empty vector control from 3 independent experiments. Two spr-4 RNAi-expressing bacterial strains were used (Methods). In addition to N2, we also utilized a C. elegans strain (TU3270) with enhanced dsRNA uptake in neurons (Methods). One of the spr-4 RNAi strains generated a significantly greater reduction in survival in the TU3270 background compared with N2. The paraquat sensitivity of worms fed RNAi against the antioxidant gene sod-1 was used as a positive control. Values are the mean ± S.D., n=3. *P<0.05 by log-rank test. c. A stably integrated SPR4::GFP construct under the control of the endogenous spr-4 promoter is expressed predominantly in neurons in adult worms, as indicated by co-localization with the neuronal marker prab-3::mCherry. Upper panels: pharyngeal ring neurons; lower panels: tail neurons. Scale bar: 20 μm. d. Treatment of adult worms with paraquat (+PQ) from day 1 to day 4 induces expression of SPR4::GFP. Untreated worms (−PQ). Upper panels show confocal imaging of a representative strain; the lower panel graph shows quantitative analysis of SPR4::GFP expression in 3 separate strains. Horizontal bars indicate the median; boxed areas represent the second and third quartiles. n=3 (15 worms each); ***P<0.001 by unpaired t-test. e. REST represses expression of the presenilin hop-1 in C. elegans. Expression of hop-1 mRNA was measured by qRT-PCR in 24-hour post L4 worms of the indicated genotypes. For each replicate, transcript values were normalized to cdc-42. Note that hop-1 mRNA expression is increased in the spr-4(by105) mutant, and that repression is partially restored by wild-type spr-4 or human REST (REST). Values represent fold change relative to the wild-type control (1) and represent the mean ± S.D., n=3. *P<0.05 by Student’s t-test. Scale bars, 20μm.
Extended Data Figure 6
Extended Data Figure 6. Induction of REST by stress and cell non-autonomous signaling
a–d. Redox-active Fe+2 (15 μM), Aβ42 (15 μM), H2O2 (indicated concentrations), and the glutathione synthesis inhibitor BSO (50 μM) increase REST protein levels in primary human cortical neuronal cultures. Shown are Western blots for REST and actin. e. REST mRNA levels determined by qRT-PCR. f. Treatment of human neurons with Fe+2 or Aβ42 increase REST-RE1 site binding in the SNAP25 and calbindin 1 genes as determined by ChIP-qPCR. g. REST mRNA levels measured by qRT-PCR after addition of conditioned medium from H2O2-treated (30 μM- H30, 100 μM-H100, 300 μM-H300, 600 μM- H600, 800 μM- H800) or control neuronal cultures (CTRL CM) to naïve neurons. h. Extracts from aged human PFC (O) induce REST when added to SH-SY5Y cells. Much lower levels of induction are induced by extracts derived from young adult (Y) or AD cortex. Shown are Western blots for REST, β-catenin and β-actin. Values in e-g represent the mean±S.D., n=3. *P<0.05, **P<0.01 by Student’s unpaired t-test.
Extended Data Figure 7
Extended Data Figure 7. Induction of REST by Wnt signaling
a. Cell non-autonomous induction of REST by aged brain extracts is partially inhibited by the Wnt antagonist Dickkopf (DKK). Extracts were derived from young adult (Y), aged (O) or AD PFC of the indicated ages and then incubated with SH-SY5Y cells in the absence (−) or presence (+) of DKK (250 ng/ml). b. Conditioned medium transferred from SH-SY5Y cells, treated with either wortmannin (2 μM), tunicamycin (2 μM), H2O2 (100 μM) or LiCl (10 mM), induce REST when added to naïve cells, which is inhibited by DKK. c. REST levels are increased by treatment of SH-SY5Y cells with Wnt 3a or 7a (250 ng/ml, 16 hrs; upper Western blot), and by LiCl (5 or 10 mM, 6 hrs) or Chiron 99021 (20 nM, 6 hrs) (lower Western blot). d. REST ChIP-seq shows that the Wnt activator LiCl (5 mM) broadly increases REST binding to target genes. Shown are REST targets P<10−5 with REST-RE1 site binding within 10 kb of the transcription start site. They include genes related to AD pathology, such as the gamma secretase presenilin-2 (PSEN2), and pro-apoptotic genes (PUMA, BAX, DAXX, TRADD and BCL2L11). e, f. SH-SY5Y cells incubated with LiCl (10 mM, 24 hrs) or Chiron 99021 (100 nM, 24 hrs) exhibit increased nuclear REST. Nuclei are stained dark blue with DAPI, which become light blue when there is overlap with the green REST staining (e). Quantitative analysis of % REST-positive nuclei (f). g. Increased nuclear β-catenin in the PFC in normal aging, and reduced levels in AD. Shown is FACS analysis of neuronal nuclei isolated from PFC. Values are the mean±S.E.M. *P<0.05, **P<0.01 by Student’s unpaired t-test. Young, n=13; Aged, n=18; AD, n=10. h. Co-localization of REST and β-catenin in the nucleus of aging neurons in the PFC. Aged and AD cases were double-labeled for REST (green) and β-catenin (red). Scale bars, 20μm.
Extended Data Figure 8
Extended Data Figure 8. Autophagy and REST
a. REST is distributed in a vesicular punctate distribution in the cytoplasm of cortical neurons in AD. Confocal immunofluorescence microscopy shows co-localization of REST with the autophagosome markers LC3, Atg 7 and Atg 12, but not with the lysosomal markers LAMP-1 or LAMP-2. b. Nuclear REST levels are reduced by activation of autophagy. SH-SY5Y cells were subject to serum withdrawal (-FBS, 40 hrs) to induce autophagy and maintained in Opti-MEM to preserve cell viability. Note that serum withdrawal results in depletion of nuclear REST (loss of green labeling that overlaps with the blue DAPI nuclear stain), which is restored by bafilomycin (-FBS/Baf). c. The autophagy inhibitors 3-methyladenine (3-MA, 5 mM) and bafilomycin (Baf, 150 nM) increase nuclear REST. Values represent % of cells positive for nuclear REST, and represent the mean ± S.E.M., n=3; **P<0.01 by Student’s t-test. Scale bars: 15 μm.
Extended Data Figure 9
Extended Data Figure 9. Neuronal REST levels are positively correlated with cognitive function and inversely correlated with AD neuropathology
a. Linear regression analysis shows that nuclear REST levels in PFC neurons are positively correlated with measures of cognition function. REST levels were determined by FACS analysis of isolated PFC neuronal nuclei. Each point represents an individual case, and is normalized as fold change relative to the mean value of the young adult group. N=37, age range 67–90 yrs. b. Nuclear REST levels in prefrontal cortical neurons decrease with increasing AD pathology. Shown are CERAD (1-frequent plaques, 2–3 sparse/moderate plaques, 4-no plaques) and NIA-Reagan scores (composite index of neuritic plaques and neurofibrillary tangles; 1-high likelihood of AD, 2-intermediate likelihood, 3-low likelihood). Values are the mean±S.E.M. CERAD 1, n=20; 2–3, n=11; 4, n=9; NIA-Reagan 1, n=12; 2, n=14; 3, n=14. * p<0.05, *** p<0.001.
Extended Data Figure 10
Extended Data Figure 10. REST, longevity and stress resistance
a. Prefrontal cortical (upper panel), hippocampal CA1 (middle panel) and cerebellar (lower panel) sections of individuals ranging in age from 57–102 years were double-labeled for REST (green) and the neuronal marker MAP2 (red). Cases with extreme longevity (98, 102 years) are associated with marked induction of REST in prefrontal cortical and hippocampal CA1 neurons, but not in cerebellar Purkinje cell (ovals) or granule cell neurons (to the right of the dashed line). Scale bar: 20 μm. b. REST increases the expression of genes associated with stress resistance and longevity. Shown are fold changes in mRNA levels for catalase (CAT), superoxide dismutase (SOD1) and FOXO1a (FOXO1) following REST knockdown (sh-RESTa or sh-RESTb) or overexpression (REST). Values represent the mean±S.D., *P<0.05 by Student’s unpaired t-test. n=3. c. FOXO1a expression is dependent on REST. Western blotting of SH-SY5Y cells shows that shRNA-mediated REST knockdown (sh-REST +) almost completely abolishes FOXO1a protein, which is prevented by shRNA-resistant mouse REST.
Figure 1
Figure 1. Induction of REST in the aging human prefrontal cortex
a. Hierarchical cluster analysis of predicted REST targets, based on the presence of the canonical RE1 motif, shows relatively high expression in young adults (red) and lower expression (blue) in the aging population. Each lane represents an individual prefrontal cortical brain sample. b. qRT-PCR shows age-dependent induction of REST mRNA in the PFC. Values represent the mean±S.D., n=3. Shown are p-values indicating significance for the mean of aged (71–95 yrs) versus young (24–29 yrs) cases for each primer. c. Age-dependent increase in total REST protein level in the PFC of controls but not AD patients. REST levels were also measured in isolated nuclear (Nuc REST; lower right panel, upper blot) and cytoplasmic (Cyt REST; lower right panel, lower blot) fractions. Each lane represents an individual case. Young, n=12; Aged, n=15; AD, n=10. d. Confocal immunofluorescence labeling for REST (green), the neuronal marker MAP2 (red) and DNA (DAPI, blue) in the PFC of young adult, aged and AD cases. Scale bar: 25 μm. e. Quantitative analysis of nuclear REST levels by in situ imaging (left panel: Young, n=11; Aged, n=77; AD, n=72; MCI=11) or FACS analysis of isolated PFC neuronal nuclei (right panel: Young, n=11; Aged, n=22; AD, n=11; MCI n=12). For c and e, values are expressed as fold change relative to the young adult group, and represent the mean±S.E.M. *P<0.05, **P<0.01, ***P<0.001 by Student’s unpaired t-test. f. ChIP analysis shows induction of REST-RE1 site binding in normal aging PFC neurons but not in AD.
Figure 2
Figure 2. Regulation of REST target genes in aging and AD
a. ChIP-qPCR analysis of REST binding to target genes in isolated PFC neuronal nuclei. Shown are young adult (Young), normal aged (Aged) and AD cases, which were stratified as AD1 (MMSE score >18) and AD2 (MMSE score <8). Also shown are control ChIP assays with non-specific IgG, and a REST ChIP with PCR primers directed 10 kb 3′ to the SNAP25 RE1 site (SNAP25–10K down). Values represent fold change relative to the mean young adult value, and represent the mean±S.E.M., n=7. *P<0.05 by the Mann-Whitney test. b. mRNA expression of REST target genes determined by qRT-PCR of PFC. Shown are REST target genes related to cell death pathways and AD pathology (left panel), and neurotransmission (right panel). Values are normalized to the mean young adult expression level (100%) and represent the mean±S.E.M. Young, n=9; Aged, n=10; AD1, n=10; AD2, n=10. Asterisks above the “Aged” bars indicate significance relative to young adults; brackets indicate significance of Aged vs AD1 or AD2. *P<0.05 by the Mann-Whitney test. c. Linear regression analysis of nuclear REST versus levels of protein targets or histone H3K9ac in double-labeled PFC neurons. d. Representative images showing inverse relationships between nuclear REST and H3K9ac, PS2, DAXX and BAX in AD1 neurons. Scale bar: 20 μm. e. Global epigenetic regulation in aging and AD. Histone modification H3K9ac was determined in isolated PFC neuronal nuclei. Values are normalized to the mean of the young adult group (100%), and represent the mean±S.E.M., **P<0.005 by Student’s unpaired t-test. Young, n= 8; Aged, n=11; AD1, n=4; AD2, n=4.
Figure 3
Figure 3. REST is neuroprotective
a. REST-deficient cortical neurons cultured from REST cKO mouse embryos show increased vulnerability to H2O2 and oligomeric Aβ42 toxicity. Cell viability is expressed as percent of the value in untreated cultures. Values represent the mean ± S.E.M., n=6–8. *P<0.05, **P<0.01 by Student’s unpaired t-test. b. Reduced nuclear translocation of the ΔREST mutant. c. REST cKO mice exhibit age-related neurodegeneration. Shown are sections of the hippocampal CA1 subfield from 8 month old REST cKO mice labeled for TUNEL, cleaved caspase 3 (cl-CASP3) and GFAP, or stained with hematoxylin and eosin (H&E). d. Neurodegeneration in 8 months but not 1 month old REST cKO mice in the cortex, and in hippocampal CA1 and dentate gyrus (DG) regions. Values represent the mean ± S.E.M., n=6 mice; **P<0.001 relative to control by Student’s unpaired t-test. Scale bars: 20 μm.
Figure 4
Figure 4. C. elegans SPR-4 protects against oxidative stress and Aβ toxicity
a. Spr-4(by105) worms incubated continuously with paraquat (5 mM) exhibit increased mortality rescued by wild-type SPR-4 or human REST. Shown is a representative experiment replicated three times. b. Quantitative analysis of survival in wild-type worms expressing mCherry or SPR-4 (WT+mCherry and WT+SPR-4), spr-4(by105) mutants, and spr-4(by105) mutants expressing SPR-4 or human REST [spr4(by105)+SPR4 and spr4(by105)+REST]. Shown is the percent change in mean survival relative to wild-type. Values represent the mean ± S.D., n=3 independent replicates of at least 30 animals per genotype; **P<0.01 relative to wild-type by the log-rank test. c. REST and SPR-4 reduce levels of reactive oxygen species (ROS). Shown are representative confocal images of paraquat-treated worms labeled with the ROS-sensitive dye DCFDA. WT, wildtype. Scale bar: 30 μm. d. Quantitation of ROS levels by DCFDA labeling. Horizontal bars indicate the median; boxed areas represent the second and third quartiles. *P<0.05 relative to wild-type by analysis of variance with post-hoc Tukey test; n=30 worms. AFU, arbitrary fluorescence units. e. SPR-4 protects against Aβ neurotoxicity. Shown are Aβ worms (expressing a stably integrated Aβ1-42 transgene) and Aβ;spr4(by105) worms. Neuronal degeneration does not occur in WT worms or spr4(by105) mutants in the absence of the Aβ transgene. Values represent the % of worms that retain 5 glutamatergic tail neurons at the indicated age (day), and are the mean±S.D., n=3. *P<0.05 by unpaired t-test.
Figure 5
Figure 5. REST, autophagy and proteostasis in AD, DLB and FTD
a. Loss of nuclear REST in DLB and FTD. Left Panel: Immunofluorescence microscopy with labeling for REST (green), the neuronal marker MAP2 (red) and DNA (DAPI, blue). Right Panel: Quantitative analysis of immunfluorescence. Values (AFU) represent the mean±S.E.M., Young, n=11; Aged, n=21; DLB, n=18; FTD, n=16. **P<0.001 by Student’s unpaired t-test. b. Co-localization of REST with disease-associated misfolded proteins in autophagosomes. Cortical sections were triple-labeled for REST, LC3, and either Aβ in AD, α-synuclein (α-syn) in DLB, or phosphorylated tau (PHF1 epitope) or TDP-43 in FTD. Two different representative cases are shown for each disease. Scale bars: 20 μm.
Figure 6
Figure 6. Nuclear REST is positively correlated with cognitive function and longevity
a. Linear regression analysis of nuclear REST levels in PFC neurons and cognitive test scores. Nuclear REST was imaged by anti-REST immunofluorescence and quantified by Metamorph. Each point represents an individual case. n=111 cases (59 females, 52 males), age range 71–90 yrs. b. Nuclear REST levels are inversely correlated with Braak stage (extent of neurofibrillary tangle formation). c. Nuclear REST levels in PFC from cases with neuropathologic AD (moderate/frequent plaques by CERAD score and intermediate/high likelihood AD by NIA-Reagan criteria) that had mild or no cognitive impairment (NCI/MCI), or AD dementia. Values are the mean±S.E.M. *P<0.01 by Student’s unpaired t-test; NCI/MCI n=30, AD dementia n=21. d. Nuclear REST levels in aging neurons correlate positively with longevity. REST levels were quantified by FACS analysis of isolated PFC neuronal nuclei in 61 individuals without AD (age range 67–104 years).

Comment in

References

    1. Gomez-Isla T, et al. Profound loss of layer II entorhinal cortex neurons occurs in very mild Alzheimer’s disease. J Neurosci. 1996;16:4491–4500. - PMC - PubMed
    1. Peters A, Sethares C, Moss MB. The effects of aging on layer 1 in area 46 of prefrontal cortex in the rhesus monkey. Cereb Cortex. 1998;8:671–684. - PubMed
    1. Yankner BA, Lu T, Loerch P. The aging brain. Annu Rev Pathol. 2008;3:41–66. doi: 10.1146/annurev.pathmechdis.2.010506.092044. - DOI - PubMed
    1. Kenyon CJ. The genetics of ageing. Nature. 2010;464:504–512. doi: 10.1038/nature08980. - DOI - PubMed
    1. Spalding KL, Bhardwaj RD, Buchholz BA, Druid H, Frisen J. Retrospective birth dating of cells in humans. Cell. 2005;122:133–143. doi: 10.1016/j.cell.2005.04.028. - DOI - PubMed

Publication types

MeSH terms

Associated data