. 2014 Feb 14;343(6172):776-9.
doi: 10.1126/science.1247651.

Massively parallel single-cell RNA-seq for marker-free decomposition of tissues into cell types

Affiliations

Massively parallel single-cell RNA-seq for marker-free decomposition of tissues into cell types

Diego Adhemar Jaitin et al. Science. .

Abstract

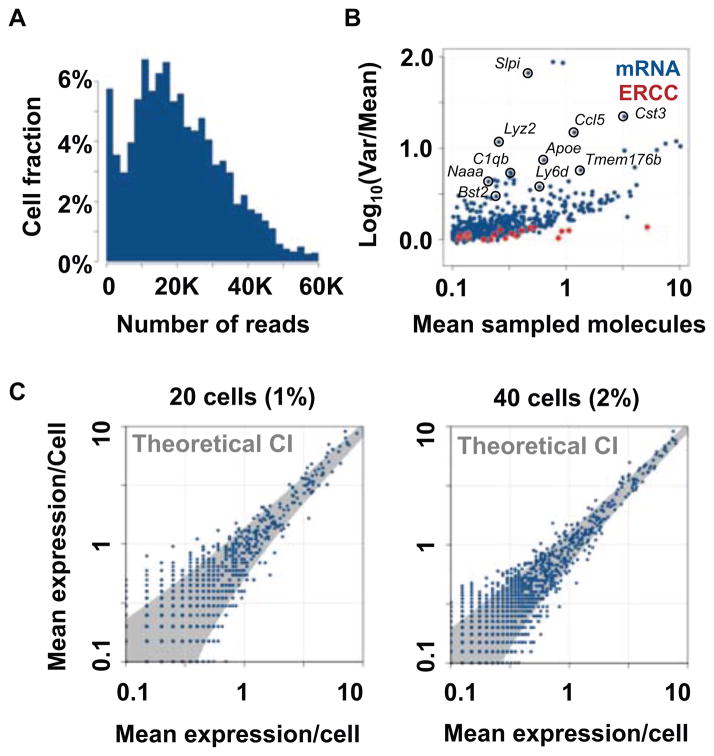
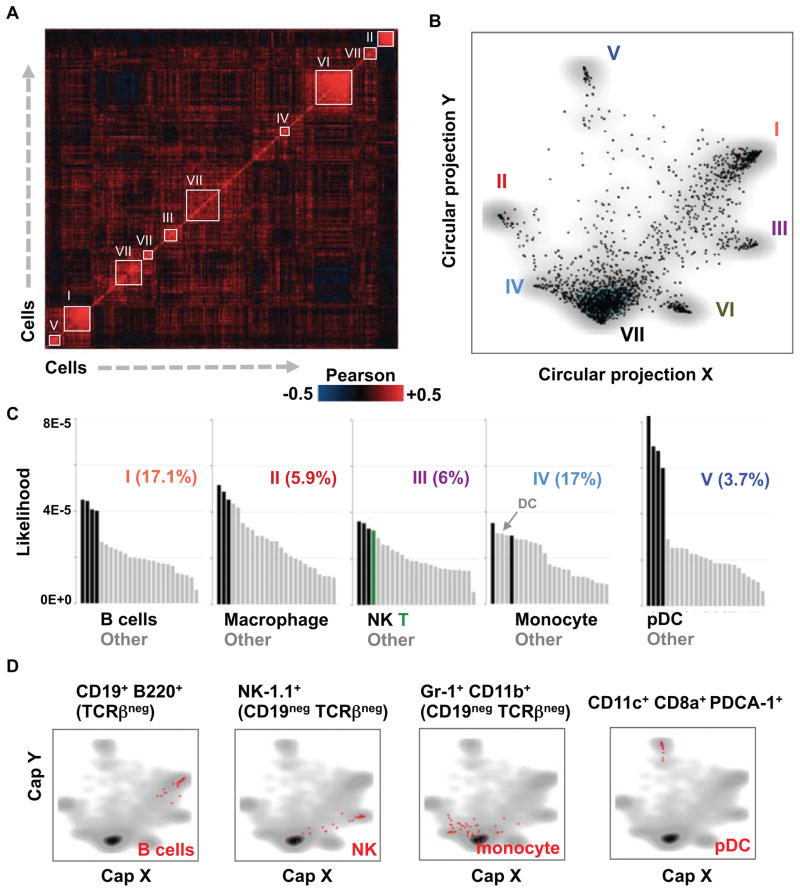
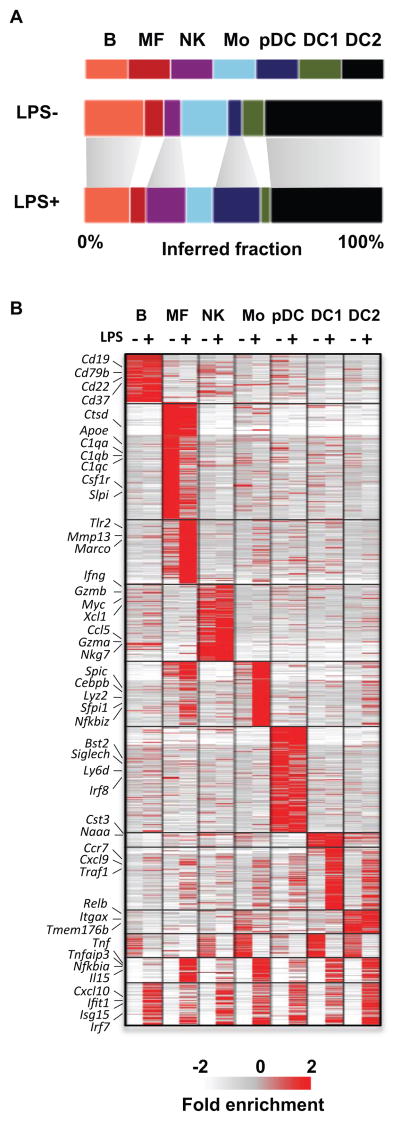
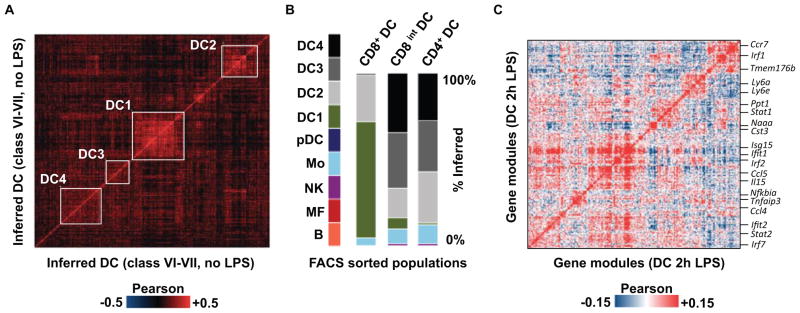
In multicellular organisms, biological function emerges when heterogeneous cell types form complex organs. Nevertheless, dissection of tissues into mixtures of cellular subpopulations is currently challenging. We introduce an automated massively parallel single-cell RNA sequencing (RNA-seq) approach for analyzing in vivo transcriptional states in thousands of single cells. Combined with unsupervised classification algorithms, this facilitates ab initio cell-type characterization of splenic tissues. Modeling single-cell transcriptional states in dendritic cells and additional hematopoietic cell types uncovers rich cell-type heterogeneity and gene-modules activity in steady state and after pathogen activation. Cellular diversity is thereby approached through inference of variable and dynamic pathway activity rather than a fixed preprogrammed cell-type hierarchy. These data demonstrate single-cell RNA-seq as an effective tool for comprehensive cellular decomposition of complex tissues.


Figures

Figure 1
Figure 1. Massively parallel single-cell RNA-seq
(A) Distribution of mapped reads per cell in a multiplexed 1536 cell experiment. (B) Mean and variance in mRNA (blue) and spike-in controls (red). (C) Mean mRNA counts in replicated pooled population of homogeneous (FACS sorted) pDC.
Figure 2
Figure 2. Single-cell dissection of immune cell types
(A) Color-coded correlation matrix of single-cell mRNA profiles. Groups of strongly correlated cells that are used to initialize a probabilistic mixture model are numbered and marked with white frames. (B) Circular a-posteriori projection (CAP) plot summarizing the predictions of the probabilistic mixture model for the CD11c+ cells. Each cell is projected onto the two dimensional sphere based on the posterior probability of its association with the model’s classes. The dimensions of the CAP plot should not be interpreted linearly or as principle components. (C) Bar plots depicting correlations of mean RNA counts in inferred types and Immgen expression profiles. The most correlated group of Immgen profiles is colored specifically as indicated for each type. (D) Shown are CAP-plots depicting single-cell RNA-Seq datasets acquired from marker-based FACS sorting for single pDC, B cells, NK cells and monocytes. Sorted cells are shown in red; density of the CD11c+ pool is shown in gray.
Figure 3
Figure 3. Response to LPS across multiple cell types
(A) Inferred cell type frequencies before and after LPS treatment. (B) Clustering of over 1300 genes give mean inferred transcriptional mean in each cell type before and after LPS infection (−/+). Full gene list is provided in Table S4.
Figure 4
Figure 4. Gene modules and the distribution and redistribution of DC cell states
(A) Single-cell correlation matrix for cells classified as DC, showing detected subclasses using white frames. (B) Type/class distributions of single-cell RNA-Seq data from three different FACS sorted DC (CD11c enriched) populations: CD8a+ CD86+; CD8a intermediate (int) CD86 negative; CD8a negative CD4+ ESAM+ (fig. S13A). (C) Gene correlation matrix is depicting potential LPS-dependent interactions between 225 genes. Key genes are indicated, with the complete list available in fig. S15.

References

    1. Acar M, Mettetal JT, van Oudenaarden A. Nat Genet. 2008;40:471–475. - PubMed
    1. Elowitz MB, Levine AJ, Siggia ED, Swain PS. Science. 2002;297:1183–1186. - PubMed
    1. Germain RN. Nat Immunol. 2012;13:902–906. - PMC - PubMed
    1. Bendall SC, et al. Science. 2011;332:687–696. - PMC - PubMed
    1. Bradford BM, Sester DP, Hume DA, Mabbott NA. Immunobiology. 2011;216:1228–1237. - PubMed

Publication types

Associated data