. 2014 May 23;344(6186):921-5.
doi: 10.1126/science.1252510. Epub 2014 May 8.

The cellular and molecular origin of tumor-associated macrophages

Affiliations

The cellular and molecular origin of tumor-associated macrophages

Ruth A Franklin et al. Science. .

Abstract

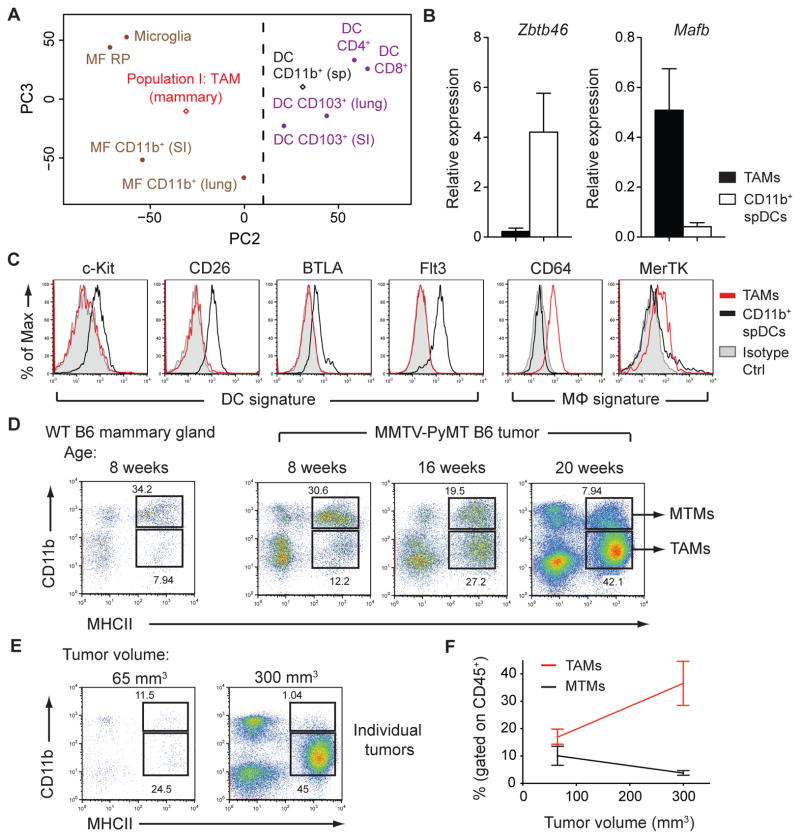
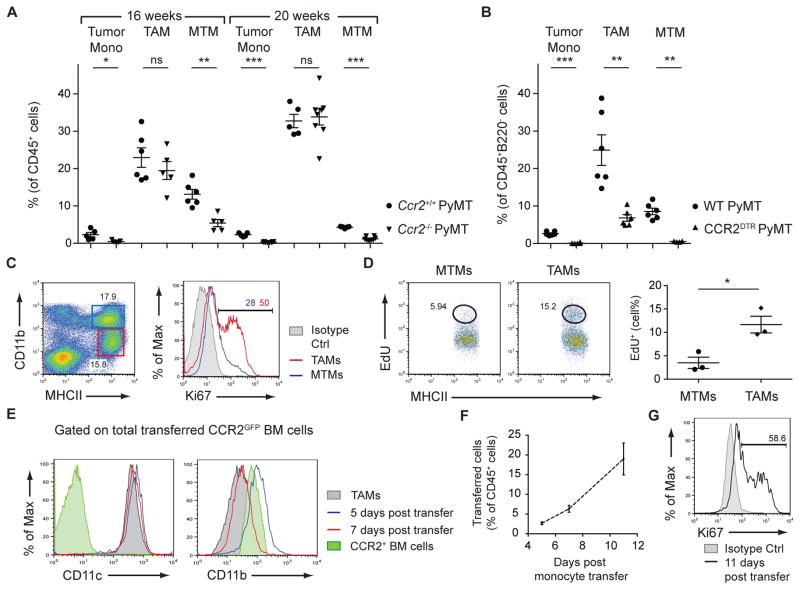
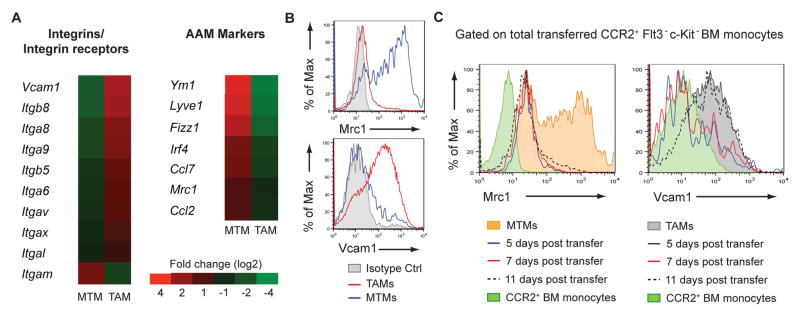
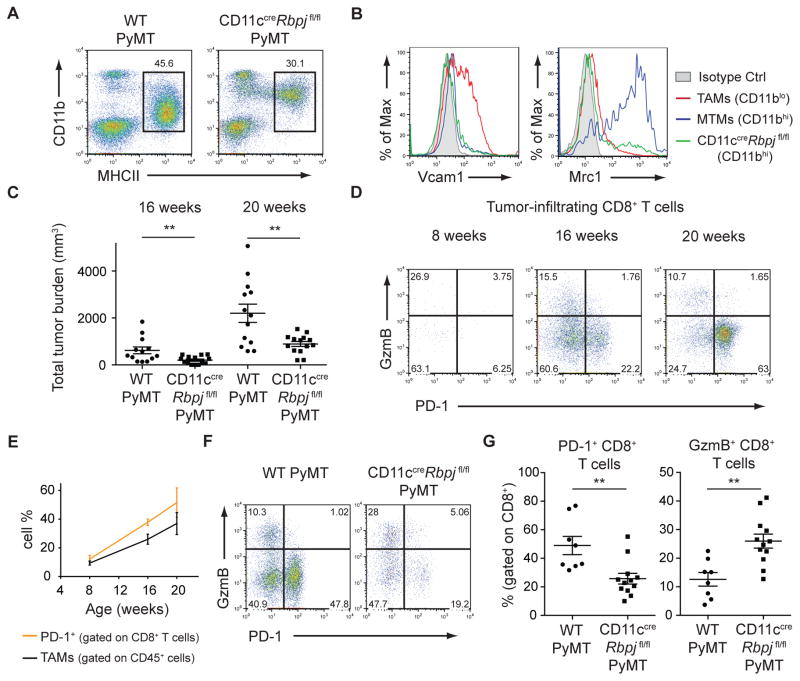
Long recognized as an evolutionarily ancient cell type involved in tissue homeostasis and immune defense against pathogens, macrophages are being rediscovered as regulators of several diseases, including cancer. Here we show that in mice, mammary tumor growth induces the accumulation of tumor-associated macrophages (TAMs) that are phenotypically and functionally distinct from mammary tissue macrophages (MTMs). TAMs express the adhesion molecule Vcam1 and proliferate upon their differentiation from inflammatory monocytes, but do not exhibit an "alternatively activated" phenotype. TAM terminal differentiation depends on the transcriptional regulator of Notch signaling, RBPJ; and TAM, but not MTM, depletion restores tumor-infiltrating cytotoxic T cell responses and suppresses tumor growth. These findings reveal the ontogeny of TAMs and a discrete tumor-elicited inflammatory response, which may provide new opportunities for cancer immunotherapy.


Figures

Figure 1
Figure 1. Macrophages Constitute the Dominant Myeloid Cell Population in Mammary Tumors
(A) Principal component analysis of Population I: TAM (mammary) and CD11b+ splenic DC (sp) gene expression compared to populations collected by the Immunological Genome Project (GSE15907). Expression data are pooled from 2 replicate microarray experiments. (B) Expression of Zbtb46 and Mafb mRNA in sorted TAMs and CD11b+ splenic DCs (spDCs) relative to Actb as determined by qPCR (n=3). (C) Flow cytometric analysis of DC and macrophage (mFϕ) signature surface markers expressed on TAMs and CD11b+ spDCs. Data are representative of 2 independent experiments (D) Flow cytometric analysis of myeloid cell populations found in wild-type (WT) mammary glands and pooled tumors from 8-, 16-, and 20-week-old PyMT mice. Data are representative of 3 independent experiments. (E) Flow cytometry of TAM and MTM populations in individual tumors from the same mouse. (F) Pooled data of individual tumors as in (G) from multiple mice (n=3). Data are shown as mean ±SEM. Dot plots are gated on CD45+ leukocytes.
Figure 2
Figure 2. TAMs Differentiate from CCR2+ Inflammatory Monocytes
(A) Flow cytometric analysis of tumor monocytes (mono), TAMs, and MTMs from 16- and 20-week-old Ccr2+/+ PyMT and Ccr2−/− PyMT mice (n=5–8). Data are pooled from 5 independent experiments. (B) Flow cytometric analysis of tumor monocytes, TAMs, and MTMs from WT PyMT and CCR2DTR PyMT mice after DT treatment (mice were treated i.p. every 3 days, 7 treatments total) (n=6). Data are pooled from 4 independent experiments. (C) Ki67 staining in TAMs and MTMs from 16-week-old PyMT mice. Data are representative of 4 independent experiments. (D) EdU incorporation in MTMs and TAMs from 16-week-old PyMT mice 20 hours after intraperitoneal EdU injection. MTM and TAM populations are first gated on CD45+ cells and then gated as shown in (C). Data are representative of 2 independent experiments. (E) Surface expression of CD11c and CD11b on transferred CCR2+ bone marrow cells from CCR2GFP mice 5 and 7 days post transfer, gated on total transferred cells. (F) Percentage of total CD45+ leukocytes that are of CCR2GFP donor origin as identified by congenic marker 5, 7, and 11 days post transfer (n=3 per time-point). (G) Cell proliferation of transferred cells 11 days post transfer. Data are pooled from 3 independent experiments. All comparisons were made using student’s t test and data are shown as mean ±SEM. Statistical significance is indicated by *p< 0.05, **p< 0.01, ***p< 0.001; ns=not statistically significant.
Figure 3
Figure 3. TAMs are not Phenotypically AAMs and can be Identified by Vcam1 Expression
(A) Gene expression of sorted TAMs and MTMs from 16-week-old PyMT mice. Data are pooled from 3 replicate microarray experiments (2 MTM samples and 3 TAM samples). Differentially expressed genes were determined with a p-value threshold of 0.05. Fold change is depicted using a log scale. (B) Flow cytometry of Vcam1 and Mrc1 expression on TAMs and MTMs. Data are representative of more than 5 independent experiments. (C) Mrc1 and Vcam1 expression on transferred CCR2+Flt3 c-Kit bone marrow monocytes and their progenies at 5, 7, and 11 days post-transfer into DT-treated CCR2DTR PyMT recipients (n=2 mice per time-point). Mrc1 and Vcam1 expression on MTMs or TAMs, respectively, are shown for comparison.
Figure 4
Figure 4. RBPJ-dependent TAMs Modulate the Adaptive Immune Response
(A) Flow cytometric data of myeloid populations in 20-week-old CD11ccre Rbpjfl/fl PyMT and WT PyMT mice. Plots are gated on CD45+B220 cells. Data are representative of more than 5 independent experiments. (B) Flow cytometry of Vcam1 and Mrc1 expression on TAMs and MTMs from WT PyMT mice and MHCII+ cells from CD11ccre Rbpjfl/fl PyMT mice. Data are representative of 3 independent experiments. (C) Total tumor burden of WT PyMT and CD11ccreRbpjfl/fl PyMT mice at 16 and 20 weeks of age (n=13–14). (D) Flow cytometric analysis of GzmB and PD-1 expression in CD8+ T cells infiltrating PyMT tumors at 8, 16, and 20 weeks. Data are representative of 3 independent experiments. (E) Quantification of TAMs (gated on CD45+ cells) and PD-1+CD8+ T cells (gated on CD45+TCRβ+CD8+ cells) from 8-, 16-, and 20-week-old PyMT mice (n=3 per time-point). (F) PD-1 and GzmB expression in CD8+ T cells from WT PyMT or CD11ccreRbpjfl/fl PyMT mice. Data are representative of more that 5 independent experiments. (G) Quantification of PD-1+ or GzmB+ CD8+ T cells as in (F) (n=8–12). Results represent pooled data and are shown as mean ±SEM. Student’s t test was performed and statistical significance is indicated by **p< 0.01.

Comment in

References

    1. Murray PJ, Wynn TA. Protective and pathogenic functions of macrophage subsets. Nature reviews Immunology. 2011 Nov;11:723. - PMC - PubMed
    1. Hashimoto D, et al. Tissue-Resident Macrophages Self-Maintain Locally throughout Adult Life with Minimal Contribution from Circulating Monocytes. Immunity. 2013 Apr 18;38:792. - PMC - PubMed
    1. Schulz C, et al. A lineage of myeloid cells independent of Myb and hematopoietic stem cells. Science. 2012 Apr 6;336:86. - PubMed
    1. Yona S, et al. Fate mapping reveals origins and dynamics of monocytes and tissue macrophages under homeostasis. Immunity. 2013 Jan 24;38:79. - PMC - PubMed
    1. Jenkins SJ, et al. Local macrophage proliferation, rather than recruitment from the blood, is a signature of TH2 inflammation. Science. 2011 Jun 10;332:1284. - PMC - PubMed

Publication types

Substances

Associated data