. 2014 May 29:5:3923.
doi: 10.1038/ncomms4923.

Two nested developmental waves demarcate a compartment boundary in the mouse lung

Affiliations

Two nested developmental waves demarcate a compartment boundary in the mouse lung

Denise Martinez Alanis et al. Nat Commun. .

Abstract

The lung is a branched tubular network with two distinct compartments--the proximal conducting airways and the peripheral gas exchange region--separated by a discrete boundary termed the bronchoalveolar duct junction (BADJ). Here we image the developing mouse lung in three-dimensions (3D) and show that two nested developmental waves demarcate the BADJ under the control of a global hormonal signal. A first wave of branching morphogenesis progresses throughout embryonic development, generating branches for both compartments. A second wave of conducting airway differentiation follows the first wave but terminates earlier, specifying the proximal compartment and setting the BADJ. The second wave is terminated by a glucocorticoid signalling: premature activation or loss of glucocorticoid signalling causes a proximal or distal shift, respectively, in BADJ location. The results demonstrate a new mechanism of boundary formation in complex, 3D organs and provide new insights into glucocorticoid therapies for lung defects in premature birth.


Conflict of interest statement

Competing financial interests

The authors declare no conflict of interest.

Figures

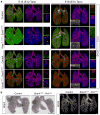
Figure 1
Figure 1. Three dimensional definition of the BADJ in the mature mouse lung
(a) Stereomicroscope images of a whole mount immunostained cranial lung lobe from a 4-week old mouse. SMA, Smooth muscle actin; CCSP, Clara cell secretary protein. The boxed areas are enlarged in subsequent images. The conducting airways marked by SOX2 expression are traced with white dashed lines, and the BADJs, marked by the distal boundaries of SOX2 and CCSP expression domains, on the front and back sides of the tube are traced with solid and dashed red lines, respectively. The airway smooth muscles are traced with green dashed lines and the vascular smooth muscles are traced with solid green lines. The diagram illustrates significant irregularity in the shape of the BADJ around the perimeter of a terminal bronchiole. Conducting airway cells in the front (black) and back (grey) sides of the tube and the associated BADJs (solid and dashed red lines) are drawn. Scale: 250 um. (b) Confocal images of immunostained sections of a 4-week old mouse lung. ECAD, E-Cadherin; SFTPC, Surfactant protein C; RAGE, Receptor for advanced glycosylation of end products. Insets, SOX2 staining only. The boxed areas are enlarged in subsequent images. Some BADJs harbor 1~2 cells (arrowheads) with low level of SOX2 expression that also express SFTPC and may represent the BASCs. The diagram illustrates the difference in morphology and arrangement between cells in the conducting airways (filled red nuclei) and gas exchange region (black nuclei). Cells with open red nuclei represent the BASCs at the BADJ. Scale: 20 um. (c) Confocal images of an immunostained section of a 4-week old mouse lung showing that, depending on the local shape of the BADJ and the section plane (left diagram, the conducting airway in red), a conducting airway that is continuous in 3D can appear interrupted by alveolar type I and type II cells (brackets) on section (right diagram, see (b) for symbol definition). One side of the tube is diagramed and traced with long dashed lines, and the boxed area is enlarged in subsequent images. DIC, differential interference contrast. Scale: 20 um.
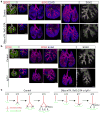
Figure 2
Figure 2. A first wave generates both epithelial compartments
(a) Optical projection tomography (OPT) images of whole mount immunostained lungs. All whole embryonic lungs and the P18 left lobe are shown to the same scale (Scale: 500 um) with the exception of the E10 foregut and E11 lung, which are shown at a higher magnification (Scale: 100 um). In a side view of the E10 foregut, the nascent left lung bud (left) is outlined with a dashed line. The L.L2 branch lineages are traced with dashed lines, and shown as inset for the P18 lung and separately for the embryonic lungs (right panels, Scale: 500 um). Double-sided arrows indicate that the gap between the distal boundaries of the SOX2 and SOX9 expression domains widens after E17. Due to variation in the branch lineage , BADJ formation (closed arrowheads) are inferred by counting branches (b) and from lineage tracing experiments. Asterisks indicate background staining from blood vessels only present in older postnatal lungs. Lower left panels (Scale: 100 um): projection of confocal images of immunostained E17 and E19 lung lobe edges for a high resolution view of SOX9 positive branch tips (dashed line). (b) Quantification of the number of SOX9 positive branch tips (green circle) and SOX2 positive branch termini (red cross) of the planar bifurcation of L.L1 through L.L6 branch lineages . The number of SOX2 positive termini plateaus at E17 (closed arrowhead). The number of SOX9 positive tips reaches the maximal number of SOX2 positive termini at E15 (open arrowhead). (c, e) Whole mount in situ hybridization of lungs at E14 (early branches) and E17 (late branches) for markers of simple epithelium (Krt8, Krt18, (c)) and branching related genes identified in an in silico screen of Eurexpress (e). Branch tips are outlined with dashed lines. Scale: 20 um. (d) Confocal images of whole mount immunostained lungs at E14 (early branches) and E17 (late branches). pERK, phosphorylated Extracellular signal-Related Kinase. pERK-positive branch tips are outlined with dashed lines. Cells in the vasculature are also pERK positive (arrowheads). Scale: 20 um.
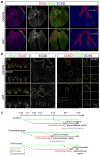
Figure 3
Figure 3. A second wave establishes the BADJ
(a) Stereomicroscope images of whole mount immunostained cranial lobes. Lineage labeling is induced with tamoxifen (Tam) at indicated embryonic days. The distal boundaries of GFP expressing cells (lineage markers) and those of SOX2 expressing cells (BADJs) are marked by red dashed lines and white arrowheads, respectively. The conducting airways along the RCr.L1 lineage are divided into three regions of equal length (I, II and III) and representative high magnification images of GFP expressing cells in each region are shown (right column). No alveolar cells are lineage-labeled. Asterisks indicate non-specific staining due to antibody trapping. Scale: 1000 um (left and middle columns) and 20 um (right column). (b) Two-wave model superimposed by the Sox2CreER lineage tracing schematics. Branches are generated by the first wave of branching morphogenesis (green dashed curves connected with green arrows) with SOX9-positive tips (green). Branches generated early (before E15), but not late (after E17), activate SOX2 expression (red) and constitute the second wave of conducting airway differentiation (red dashed curves connected with red arrows). The BADJ forms (arrowhead) when the second wave terminates at E17. The most proximal portions of the respiratory tree are SOX2-positive branched structures at E13 and are shown as red vertical lines for simplicity (square bracket I). The predicted distributions of Sox2CreER-lineage cells labeled at E13 (square), E15 (triangle) and E17 (circle) are shown along the respiratory trees. The three portions (I, II and III) in the mature (P21) airways (a) are illustrated on the schematics of the E19 lung. (c) Percentage of labeled cells at indicated positions (I, II and III) relative to those in the extra-pulmonary bronchus of the same lung that have been lineage labeled at E13 (square), E15 (triangle) and E17 (circle). H: high (67–100%), M: medium (33–67%), L: low (0–33%). (d) Stereomicroscope images of a whole mount immunostained P21 lung lineage-labeled at E17. The conducting airways are traced with white dashed lines, and the BADJs at the front and back of the branch are marked with solid and dashed red lines, respectively. The lineage labeled cells at the BADJ are marked with horizontal carets. Scale: 20 um.
Figure 4
Figure 4. Role of candidate morphogens in the progression of the two waves
(a) OPT images of whole mount immunostained E15 (left panels) and E18 (right panels) lungs from littermate embryos that have been injected with tamoxifen (Tam) at E12 and E15, respectively. The boxed regions are shown as a section view for E15 and as a projection view for E18. Stereomicroscope images are shown as insets for ECAD staining at E18 for higher resolution. The accessory lobes of E18 KrasLSL-G12D/+; Sox9CreER/+ lungs are removed for clarity. The first (SOX9) wave is affected similarly at both time points, including formation of overgrown branches (asterisk) with expanded SOX9 expression in the Kras mutant and loss of SOX9 expression (open green arrowhead) in the Ctnnb1 mutant. The second (SOX2) wave is affected at E15 when its progression has been coupled with the first wave, including a restricted (open arrow) or expanded (open arrowhead, also limited SOX2-negative ECAD region in the E15 whole lung image) SOX2 expression domain in the Kras or Ctnnb1 mutants, respectively. At least two independent experiments for each time point are performed with similar results. Scale: 200 um. (b) In situ hybridization (left panels) and OPT images (right panels) of whole mount lungs from littermate embryos. Scale: 400 um.
Figure 5
Figure 5. BADJ formation is independent of branch size and generation
(a, b) OPT images of whole mount immunostained lungs from Sftpc-rtTA; TetO-DTA (treated with doxycycline from E13 to E14) or Igf1r−/− mutant and their respective littermate control embryos. The L.L6 branch lineages in the boxed areas are enlarged and traced with dashed lines in subsequent images. At least two experiments for each time point are performed with similar results. As illustrated in the diagram (c), in the Sftpc-rtTA; TetO-DTA and Igf1r−/− mutant lungs, the first wave is still marked by SOX9 expression but progresses much slower than that in the control lungs; and the second wave follows the first wave early in development and terminates on schedule at E17.
Figure 6
Figure 6. Premature activation of glucocorticoid signaling causes a proximal shift in BADJ location in culture and in vivo
(a) Stereomicroscope images of lung slices from an E14 Sox2EGFP/+; RosatdT/+; ShhCre/+ embryo at the beginning of the culture (E14+0div) or cultured for 1 (1div) or 2 (2div) days in the absence (Control) or presence (Dexamethasone) of dexamethasone. Arrowheads indicate the distal boundary of the Sox2EGFP expression domain. To keep a consistent color scheme, the green fluorescence from Sox2EGFP/+ and the red fluorescence from RosatdT/+; ShhCre/+ are pseudo-colored red and blue, respectively. div, days in vitro. Scale: 200 um. (b, c) OPT images of E15 whole mount immunostained lungs (b, scale: 500 um) and confocal images of E15 immunostained lung sections (c, scale: 20 um) from control embryos or embryos treated with dexamethasone in drinking water from E12 in vivo. Arrowheads indicate the distal boundary of the SOX2 expression domain. The numbers of SOX2-positive termini (red number, p=0.002, Student’s t-test) or SOX9-positive (green number, p=0.56, Student’s t-test) tips from three lungs (the first number corresponding to the lung shown) are quantified. The epithelia are traced with dashed lines and the boxed areas are enlarged in subsequent images. There is a very low level of RAGE expression and no AQP1 expression in the control epithelium. Asterisks indicate normal expression of AQP1 in the vasculature. The teratogenic effects of dexamethasone limit the extent of signaling activation in vivo and restrict the sizes of the embryo and the lung.
Figure 7
Figure 7. Loss of glucocorticoid activity causes a distal shift in BADJ location
(a) OPT images of whole mount immunostained lungs. Arrowhead, distal boundary of the SOX2 expression domain. The numbers of SOX2-positive termini (red number, p=0.0008, Student’s t-test) or SOX9-positive (green number, p=0.8, Student’s t-test) tips from three lungs (the first number corresponding to the lung shown) are quantified. The L.L1.A4 branch lineages in the boxed areas are enlarged and traced with dashed lines in subsequent images. The accessory lobes are removed for clarity. The asterisk indicates blood auto-fluorescence. Scale: 500 um. (b) Confocal images of immunostained lungs. CCND1, Cyclin D1. Left panels: white lines, conducting airways; filled arrowheads, BADJs; open arrowheads, branch tips. The GR mutant has larger SOX9-positive branch tips shown in a stack projection view on the left and as a result has more recognizable branch tips on a section view on the right. Right panels: The boxed areas are enlarged in subsequent images. Note that non-epithelial cells also express CCND1. Scale: 20 um. (c) Diagrams illustrating that BADJ formation is specified by a temporal mechanism. The first wave of branching morphogenesis (the SOX9 wave) persists throughout embryonic development (green arrow). The second wave of conducting airway differentiation (the SOX2 wave) follows the first wave, prospectively marks the conducting airways, and terminates at E17 (red arrow), after which the differentiation of gas exchange region begins (black arrow). Cells near the BADJ are generated at E15 by the SOX9 wave (open arrowhead) and the BADJ forms at E17 after the SOX2 wave terminates (closed arrowhead). Long dashed lines connecting the two waves show the temporal delay between branch generation and SOX2 expression. A low level of SOX2 expression is present in part of the main bronchi at E11. An increase in glucocorticoid signaling (light blue arrow) coincides temporally with BADJ formation and premature activation of glucocorticoid signaling (Dexamethasone) terminates the second wave early and causes a proximal shift in BADJ location. Loss of GR prolongs the second wave and causes a distal shift in BADJ location associated with defects in alveolar differentiation (dashed black arrow) and SOX9-positive progenitor cell maintenance (green dashed arrow).

References

    1. Morrisey EE, Hogan BL. Preparing for the first breath: genetic and cellular mechanisms in lung development. Dev Cell. 2010;18:8–23. - PMC - PubMed
    1. Weibel ER. What makes a good lung? Swiss Med Wkly. 2009;139:375–86. - PubMed
    1. Bal HS, Ghoshal NG. Morphology of the terminal bronchiolar region of common laboratory mammals. Lab Anim. 1988;22:76–82. - PubMed
    1. Haefeli-Bleuer B, Weibel ER. Morphometry of the human pulmonary acinus. Anat Rec. 1988;220:401–14. - PubMed
    1. Ten Have-Opbroek AA. The development of the lung in mammals: an analysis of concepts and findings. Am J Anat. 1981;162:201–19. - PubMed

Publication types

MeSH terms

Associated data