. 2014 Jul 14;30(1):11-22.
doi: 10.1016/j.devcel.2014.05.024. Epub 2014 Jul 3.

High-resolution mapping of chromatin packaging in mouse embryonic stem cells and sperm

Affiliations

High-resolution mapping of chromatin packaging in mouse embryonic stem cells and sperm

Benjamin R Carone et al. Dev Cell. .

Abstract

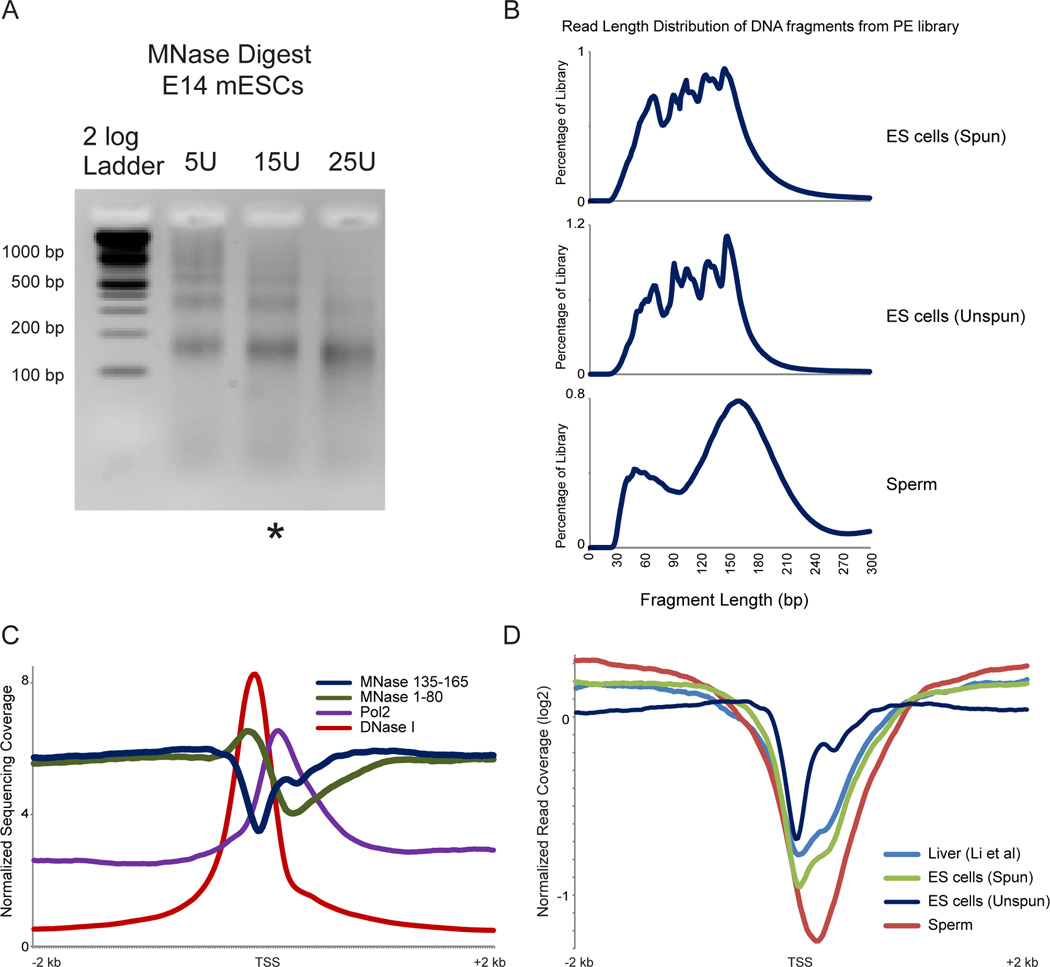
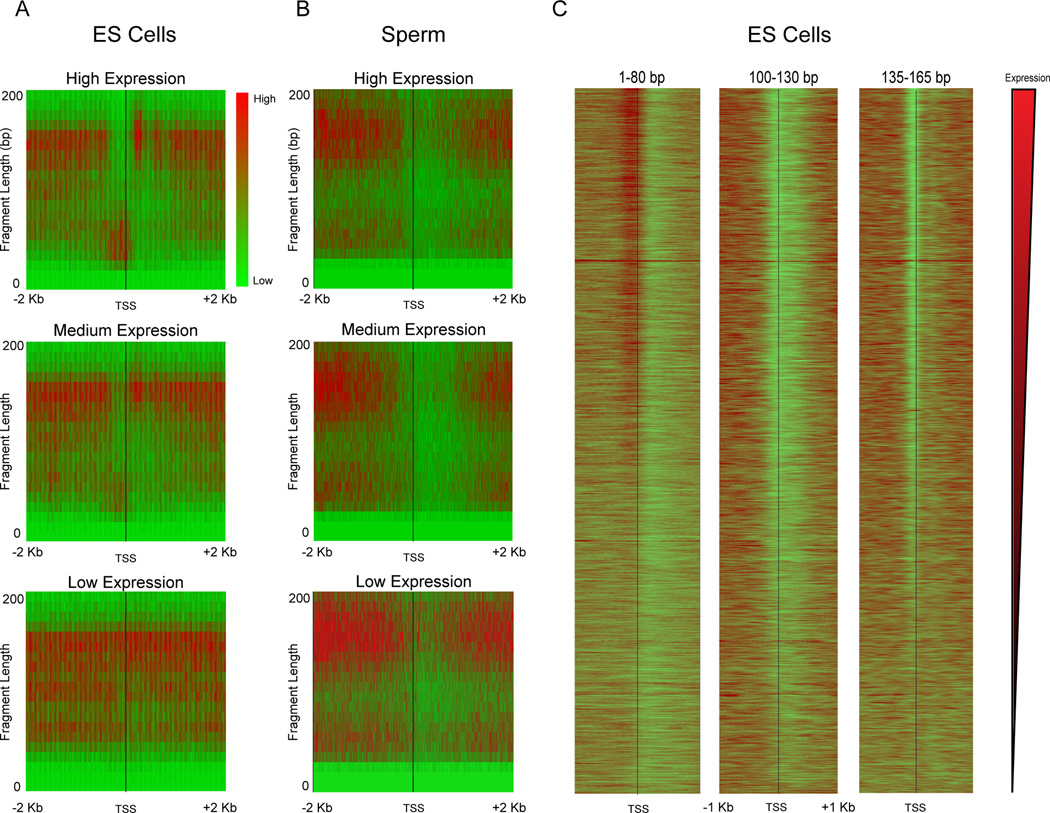
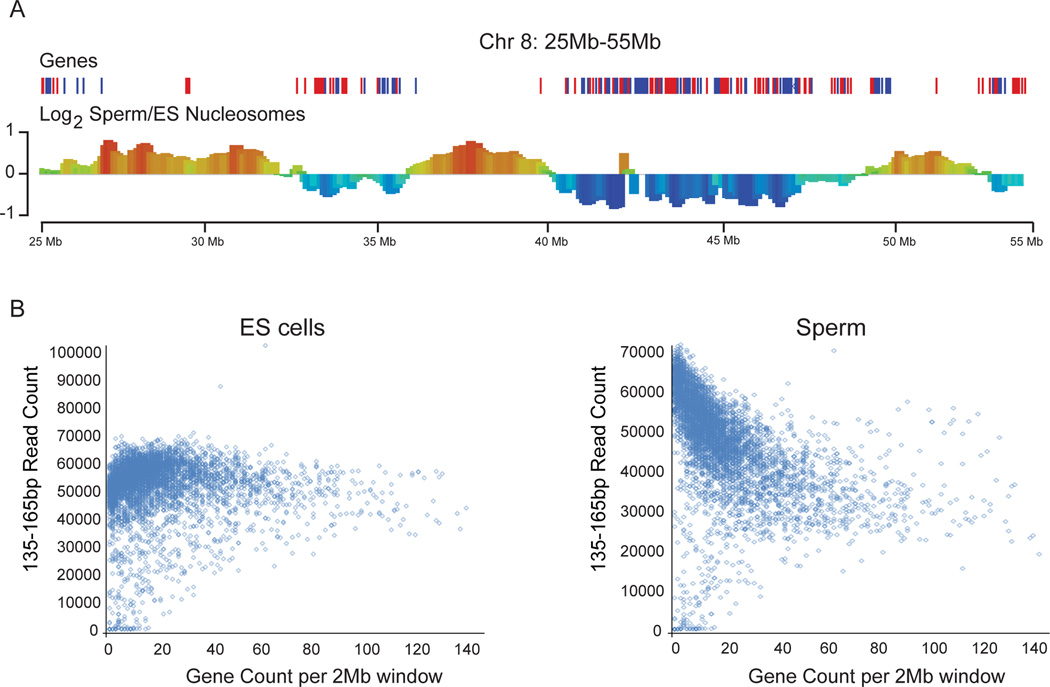
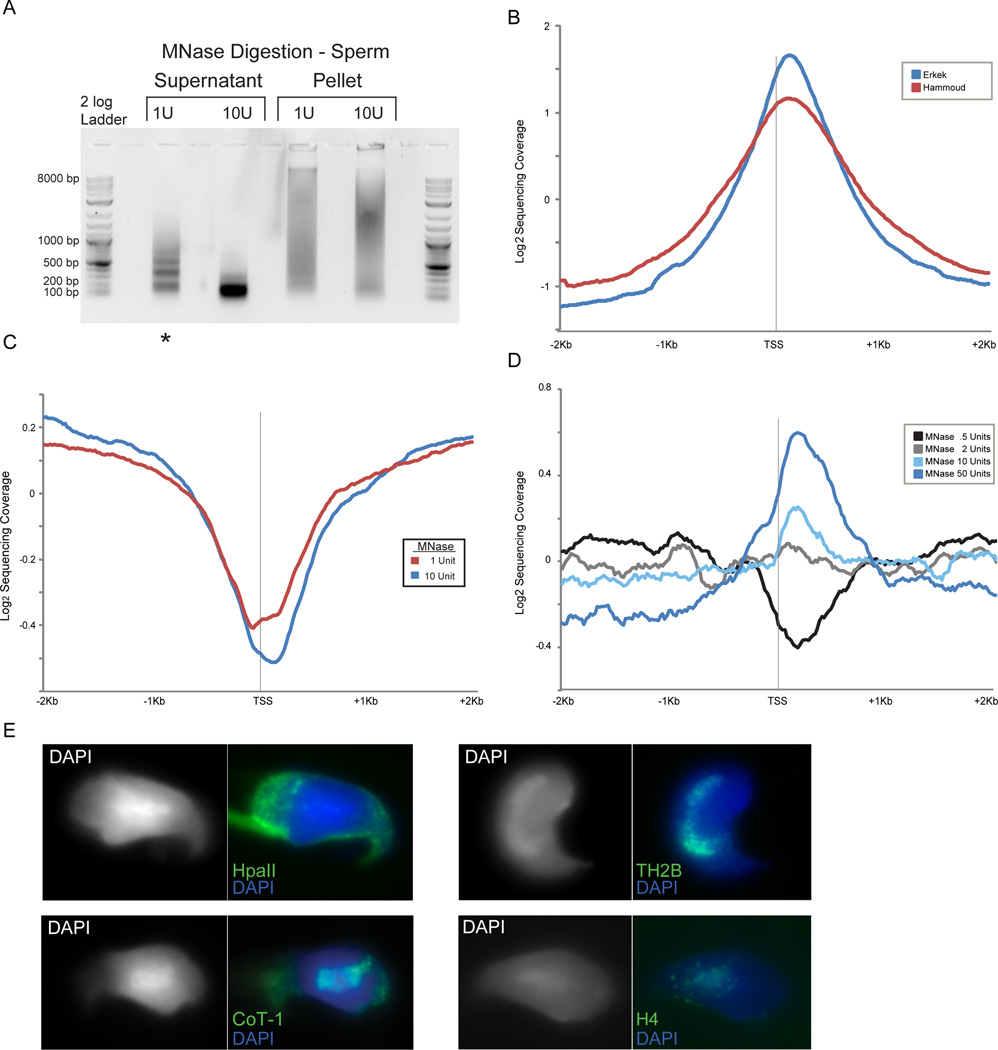
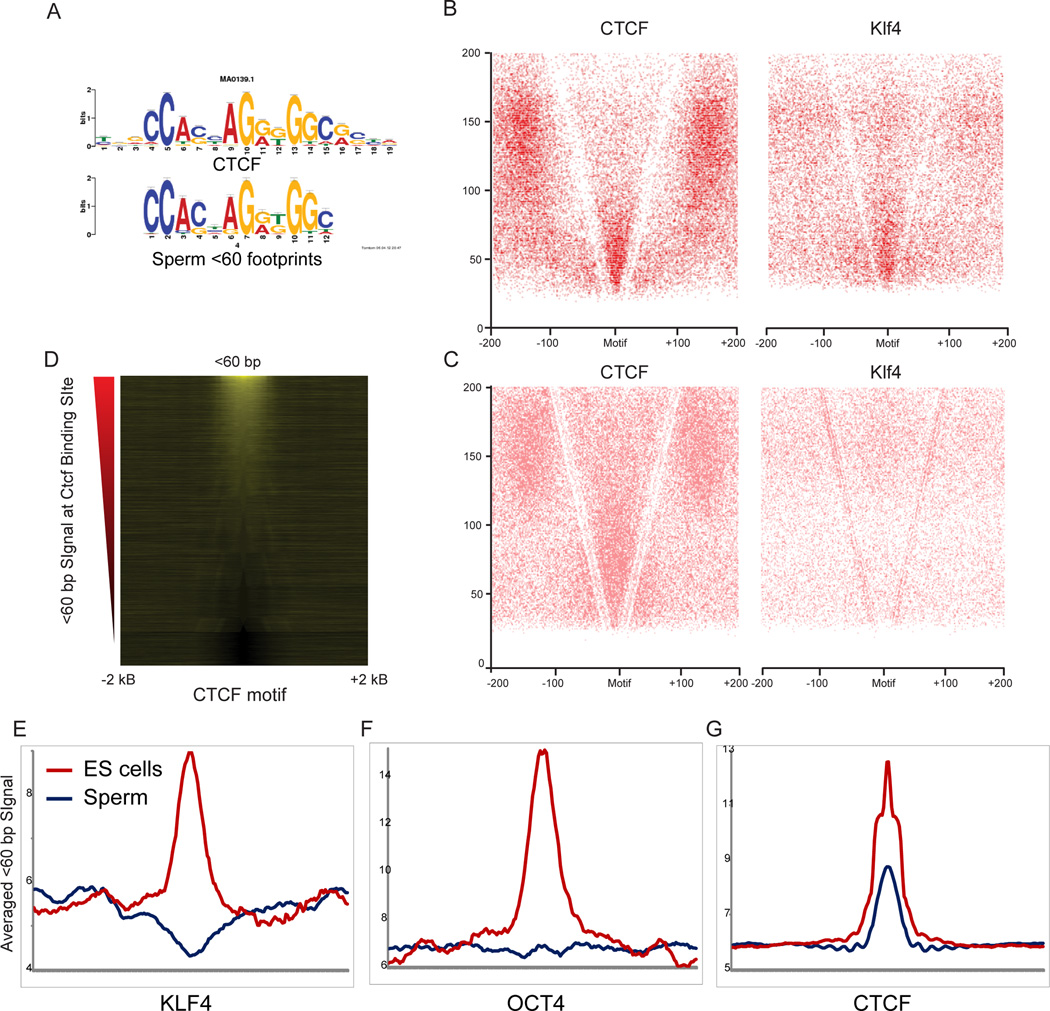
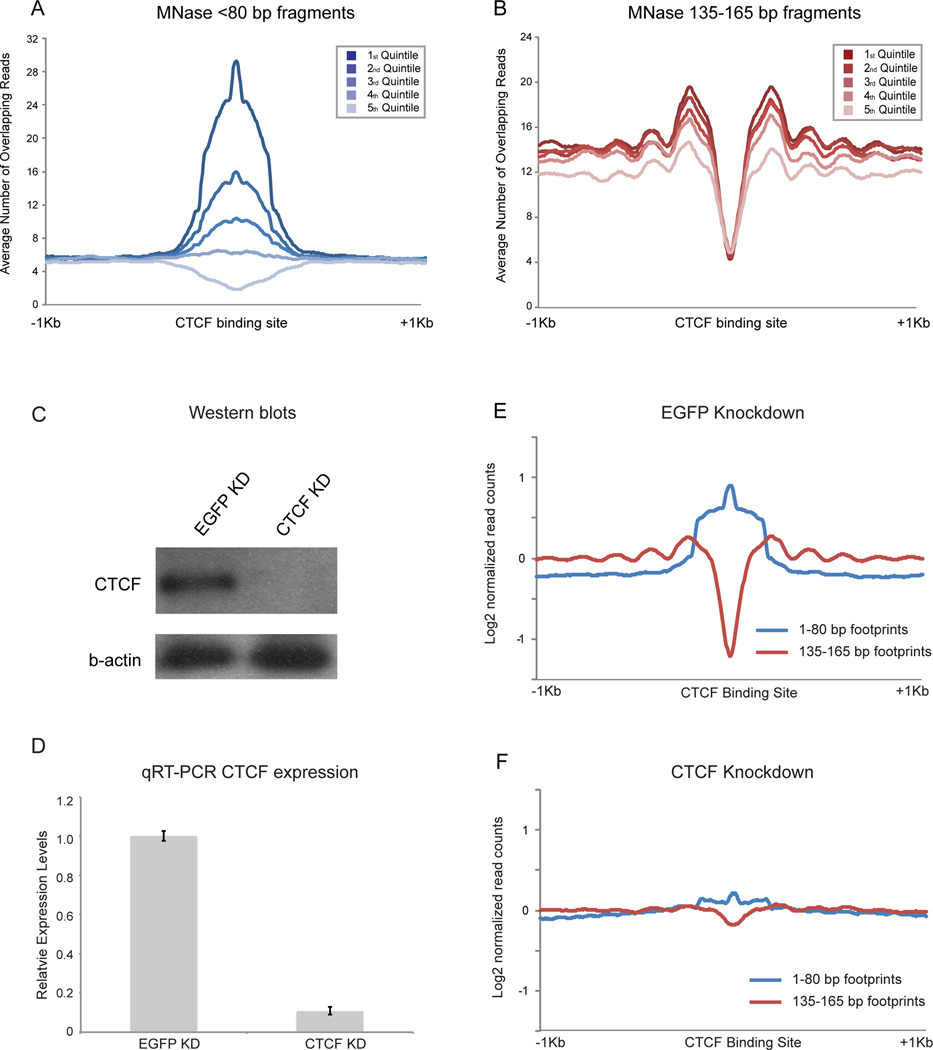
Mammalian embryonic stem cells (ESCs) and sperm exhibit unusual chromatin packaging that plays important roles in cellular function. Here, we extend a recently developed technique, based on deep paired-end sequencing of lightly digested chromatin, to assess footprints of nucleosomes and other DNA-binding proteins genome-wide in murine ESCs and sperm. In ESCs, we recover well-characterized features of chromatin such as promoter nucleosome depletion and further identify widespread footprints of sequence-specific DNA-binding proteins such as CTCF, which we validate in knockdown studies. We document global differences in nuclease accessibility between ESCs and sperm, finding that the majority of histone retention in sperm preferentially occurs in large gene-poor genomic regions, with only a small subset of nucleosomes being retained over promoters of developmental regulators. Finally, we describe evidence that CTCF remains associated with the genome in mature sperm, where it could play a role in organizing the sperm genome.


Figures

Figure 1
Figure 1. Average promoter architecture in embryonic stem cells
A. Gel electrophoresis of MNase digestion ladders for murine ES cells subject to EGFP knockdown. Characteristic nucleosomal laddering is evident in underdigested ES lanes. ES cell digestion patterns are shown here for unfractionated (unspun) samples – identical results are obtained for the supernatant of low-speed centrifugation (“spun” – not shown). * indicates the titration step used for paired-end deep sequencing library construction. B. Fragment size distribution for sequenced MNase digestion products. After deep sequencing of the indicated libraries, paired sequences were mapped back to the mouse genome and insert size was calculated from genomic distance between reads. ES “spun” indicates that MNase digestion was fractionated by centrifugation and library was constructed from supernatant material, whereas “unspun” library was constructed from the entire MNase digestion. C. Normalized deep sequencing data plotted relative to transcriptional start sites (TSS) of all mouse mm9 refGene transcripts for 1–80 bp MNase-protected fragments, 135–165bp fragments, DNaseI hypersensitivity (GSE40869), and RNAPII ChIP-Seq, as indicated. Y axis represents the average value, for all genes, in parts per million reads. D. Comparison between cell types, and comparison to previous ES cell data (Teif et al., 2012). 135–165 bp MNase footprints were selected for the indicated libraries, and occupancy was averaged for all TSS-aligned genes, shown as log2 of the enrichment relative to the genome-wide average read depth. Two key features are apparent here. First, sperm exhibit a strong nucleosome-depleted region on average. Second, the unspun ES cell library exhibits a relatively positioned +1 nucleosome on average, whereas the supernatant “spun” library exhibits the 3’-extended promoter NDR reported by Teif et al, indicating that 5’ nucleosomes are relatively insoluble under typical MNase digestion conditions.
Figure 2
Figure 2. Relationship between transcript abundance and MNase footprinting
A–B. Enrichment of reads around TSSs is shown in red-green (enriched-depleted) heatmap for genes grouped according to mRNA abundance in E14 mES cells: High (top 5%), Mid (middle 5%), Low (bottom 5%). For each panel, x axis shows distance from the TSS, y axis shows size of the MNase footprint. Data for ES cell MNase digestion is shown in (A), data for mature sperm in (B). Note that sperm “expression levels” derive from mRNA abundance from round spermatids (Namekawa et al., 2006) as mature sperm are transcriptionally inactive. C. Gene-resolution heatmap of deep sequencing reads from ES cell MNase digestion, aligned by TSS for three prominent size classes: <80 bp, 100–130 bp, and 135–165 bp. Each row is a single gene, and rows are sorted from high to low mRNA abundance.
Figure 3
Figure 3. Preferential histone retention occurs at gene deserts in sperm
A. Sperm nucleosomes are retained in gene-poor regions compared to ES cell nucleosomes. Normalized mononucleosomal (135–165 bp) MNase footprints were averaged for 2 Mb bins, and the log2 of the relative enrichment for ES cells vs. sperm (y axis) is shown for a typical stretch of chromosome 8 (genomic coordinate on x axis). See also Figure S1. B. Scatterplot of gene density (x-axis) vs. number of mononucleosome-sized MNase sequencing reads (y-axis) for ES cells and sperm. The small number of points in the lower left corner depleted of sequencing reads correspond to 2 Mb bins comprised of largely unmappable or unannotated sequence. Low-depth ChIP-Seq using anti-H3 in sperm also reveals this anticorrelation between gene density and H3 signal (Figure S1D), strongly supporting the claim that mononucleosome-sized fragments released by MNase digestion of sperm indeed correspond to nucleosomes.
Figure 4
Figure 4. A small subset of nucleosomes are retained at promoters in sperm
A. Gel electrophoresis of soluble vs. insoluble MNase digestion products from mature M. musculus sperm. Lane with asterisk designates level of digestion used for most analyses. Pellet fraction contains the majority of protamine protein, while supernatant carries the majority of histone proteins. B. Aggregation plot of data from Hammoud et al (H. sapiens) and Erkek et al datasets (M. musculus) aligned by TSS. C. Aggregation plot of MNase seq reads for 1 U and 10 U MNase digestion levels (digestions shown in (A)). These libraries were generated from the supernatant of the MNase digestion material. D. Aggregation plots of MNase-seq data for unspun, not size-selected, digestion series of formaldehyde-crosslinked M. musculus sperm. A peak of promoter nucleosome occupancy is revealed only after extensive MNase digestion (note that MNase levels are not directly comparable to those in (C) as fewer sperm were used in this digestion), and is more prominent when MNase digestions are not subject to centrifugation (Figures S2B–C). E. Representative images for fluorescent in situ hybridizations (FISH) with HpaII probe (poorly methylated CpG islands – see Methods) and Cot-1 probe (gene-poor heterochromatic regions), as well as immunofluorescence using antibodies to TH2B (testis specific H2B) and bulk H4, demonstrating that the majority of anti-histone staining overlaps the DAPI-rich chromocenter that also stains with Cot-1 probe.
Figure 5
Figure 5. Enrichment of short MNase fragments over binding sites for sequence-specific TFs
A. Short MNase footprints in sperm occur over CTCF binding sites. <60 bp MNase digestion products from sperm were searched for overrepresented sequence motifs, and the top motif hit is shown alongside the published sequence motif for CTCF. B–C. V-plots (as in Figure 2A, but showing all digestion products as points rather than enrichment/depletion) for ES cell (B) or sperm (C) MNase digestion products, anchored by CTCF and Klf4 binding sites. D. Short footprints in sperm are associated with a subset of the CTCF binding sites identified in ES cells. Heatmap shows enrichment of <60bp DNA fragments from sperm dataset, centered on CTCF motifs that are empirically CTCF-bound in ES cells (Chen et al., 2008). Sites are sorted from high to low signal intensity over 100 bp surrounding the binding site. E. Examples of short (<80 bp) footprints averaged over various TF motifs, reproduced from Figure S3.
Figure 6
Figure 6. Nuclease-resistant footprints over CTCF motifs represent bona fide CTCF binding in ES cells
A. Abundance of short MNase footprints over CTCF binding sites in ES cells correlates with CTCF ChIP-Seq enrichment. CTCF motifs are split into quintiles according to ChIP-seq signal (Chen et al., 2008). B. As in (A), but for mononucleosome-length footprints. Flanking nucleosomes are more strongly positioned when CTCF ChIP-seq signal is highest. C. Western blots of CTCF and EGFP esiRNA knockdown in mESCs, probed with anti-CTCF and β-actin antibodies. D. qRT-PCR of CTCF mRNA abundance. E. Aggregation plot for <80 bp and 135–165 bp digestion products in EGFP KD ES cells, aligned using CTCF motifs. F. Knockdown of CTCF in ES cells results in loss of <80bp footprint enrichment over CTCF motifs, with an associated increase in nucleosome occupancy over the CTCF motif and loss of surrounding nucleosome positioning. See also Figures S4–5.

Comment in

References

    1. Arpanahi A, Brinkworth M, Iles D, Krawetz SA, Paradowska A, Platts AE, Saida M, Steger K, Tedder P, Miller D. Endonuclease-sensitive regions of human spermatozoal chromatin are highly enriched in promoter and CTCF binding sequences. Genome Res. 2009 - PMC - PubMed
    1. Brykczynska U, Hisano M, Erkek S, Ramos L, Oakeley EJ, Roloff TC, Beisel C, Schubeler D, Stadler MB, Peters AH. Repressive and active histone methylation mark distinct promoters in human and mouse spermatozoa. Nature structural & molecular biology. 2010;17:679–687. - PubMed
    1. Chen X, Xu H, Yuan P, Fang F, Huss M, Vega VB, Wong E, Orlov YL, Zhang W, Jiang J, et al. Integration of external signaling pathways with the core transcriptional network in embryonic stem cells. Cell. 2008;133:1106–1117. - PubMed
    1. Crick FH, Klug A. Kinky helix. Nature. 1975;255:530–533. - PubMed
    1. Erkek S, Hisano M, Liang CY, Gill M, Murr R, Dieker J, Schubeler D, van der Vlag J, Stadler MB, Peters AH. Molecular determinants of nucleosome retention at CpG-rich sequences in mouse spermatozoa. Nature structural & molecular biology. 2013;20:868–875. - PubMed

Publication types

MeSH terms

Associated data