. 2015 Sep 10;525(7568):206-11.
doi: 10.1038/nature15251. Epub 2015 Sep 2.

Gain-of-function p53 mutants co-opt chromatin pathways to drive cancer growth

Affiliations

Gain-of-function p53 mutants co-opt chromatin pathways to drive cancer growth

Jiajun Zhu et al. Nature. .

Abstract

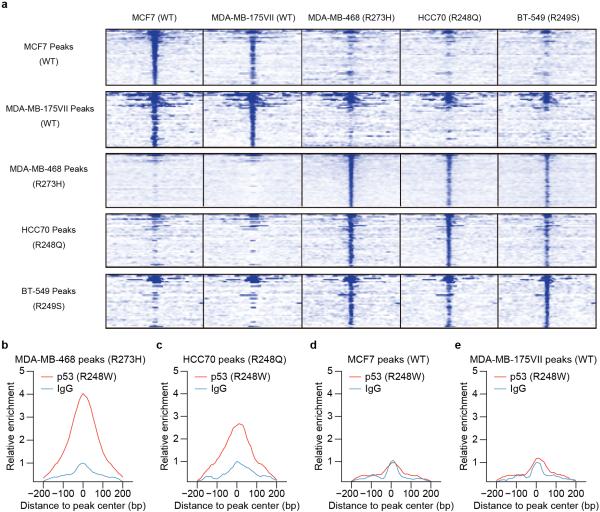
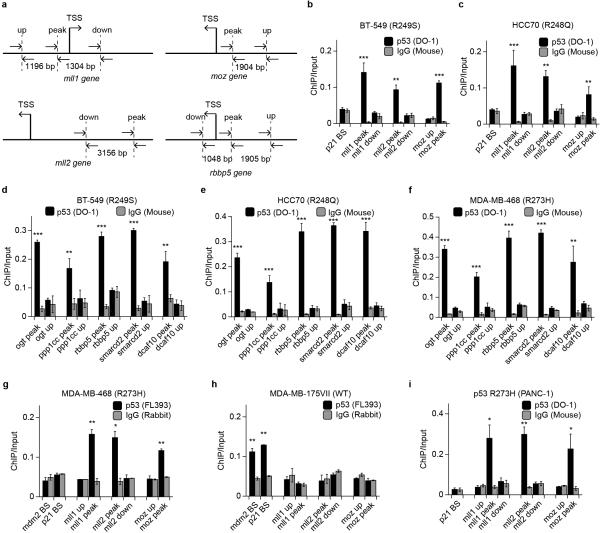
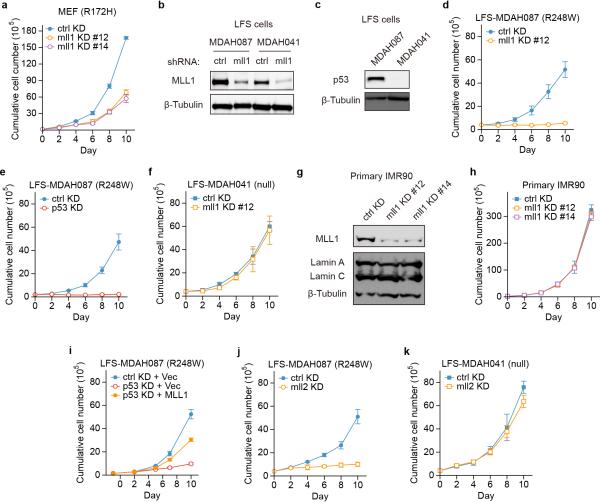
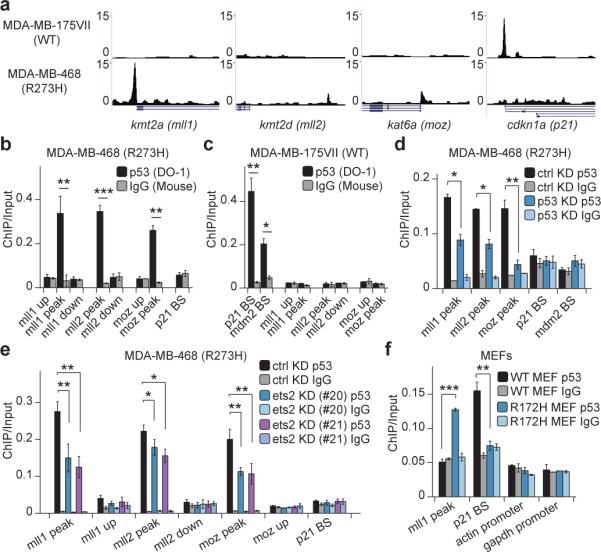
TP53 (which encodes p53 protein) is the most frequently mutated gene among all human cancers. Prevalent p53 missense mutations abrogate its tumour suppressive function and lead to a 'gain-of-function' (GOF) that promotes cancer. Here we show that p53 GOF mutants bind to and upregulate chromatin regulatory genes, including the methyltransferases MLL1 (also known as KMT2A), MLL2 (also known as KMT2D), and acetyltransferase MOZ (also known as KAT6A or MYST3), resulting in genome-wide increases of histone methylation and acetylation. Analysis of The Cancer Genome Atlas shows specific upregulation of MLL1, MLL2, and MOZ in p53 GOF patient-derived tumours, but not in wild-type p53 or p53 null tumours. Cancer cell proliferation is markedly lowered by genetic knockdown of MLL1 or by pharmacological inhibition of the MLL1 methyltransferase complex. Our study reveals a novel chromatin mechanism underlying the progression of tumours with GOF p53, and suggests new possibilities for designing combinatorial chromatin-based therapies for treating individual cancers driven by prevalent GOF p53 mutations.


Figures

Extended Data Figure 1
Extended Data Figure 1. Distinct GOF p53 mutants have similar genome-wide binding patterns, but are different from that of WT p53
a. Heatmaps showing the enrichment of p53 peaks (+/− 2500 bp around peak center) identified from each cell line (rows) in all five cell lines (columns) examined by ChIP-seq. b, c, d, e. Area under the curve, meta-peak analysis showing GOF p53 R248W or IgG ChIP-seq signal enrichment from MDAH087 cells over TSS-proximal peaks identified in (b) MDA-MB-468, (c) HCC70, (d) MCF7 and (e) MDA-MB-175VII cells.
Extended Data Figure 2
Extended Data Figure 2. GOF p53 genome-wide binding is in association with ETS family proteins
a. Canonical ETS binding motif (up), and discovered motif from all TSS-proximal peaks in MDA-MB-468 predicted by MEME/TomTom (middle), or SeqPos (down). b. MEME/TomTom discovered WT p53 motif from MDA-MB-175VII TSS-proximal peaks. c. GST pulldown of bacterially expressed GST or GST-ETS2 with in vitro translated p53 WT or p53 R175H. d, e. Co-immunoprecipitation at endogenous protein levels of ETS2 and (d) GOF p53 R273H or (e) WT p53 in (d) MDA-MB-468 or (e) MCF7 cells. f, g. Boxplots showing overlap of (f) GOF p53 TSS-proximal peaks from MDA-MB-468 cells or (g) WT p53 TSS-proximal peaks from MCF7 cells, with ETS family proteins (blue), all other transcription factors (grey), or PolII (white) peaks from ENCODE ChIP-seq datasets. Mann-Whitney tests were performed to compute significance. h. GO analysis of WT p53 TSS-proximal peaks (statistics are shown in Supplementary Table S1).
Extended Data Figure 3
Extended Data Figure 3. Genome browser track views showing distinct WT p53 and GOF p53 binding patterns over representative canonical WT p53 targets and novel GOF p53 targets
a, b, c, d. Track views of p53 occupancy over promoter regions of (a) mll1, (b) mll2, (c) p21 and (d) moz, in MCF7, HCC70 and BT-549 cells. e, f, g. Re-aligned GOF p53 R248W and IgG ChIP-seq data from LFS MDAH087 cells, showing enrichment of GOF p53 at promoter regions of (e) mll1, (f) mll2, and (g) moz. h, i, j. Track views of p53 occupancy over promoter regions of (h) rbbp5, (i) mdm2 and (j) puma, in MCF7, MDA-MB-175VII, HCC70, BT-549 and MDA-MB-468 cells.
Extended Data Figure 4
Extended Data Figure 4. ChIP-qPCR validation of GOF p53 binding at newly identified chromatin regulator genes
a. Schematic of amplicon locations for ChIP-qPCR validations performed in this study. b, c. ChIP-qPCR showing p53 (DO-1 antibody) or IgG (Mouse) enrichment (ChIP/Input) over mll1, mll2 and moz peak regions, in (b) BT-549 and (c) HCC70 cells. d, e, f. ChIP-qPCR showing p53 (DO-1 antibody) or IgG (Mouse) enrichment over ogt, ppp1cc, rbbp5, smarcd2 and dcaf10 peak regions, in (d) BT-549, (e) HCC70 and (f) MDA-MB-468 cells. g, h. ChIP-qPCR showing p53 (FL393 antibody) or IgG (Rabbit) enrichment over mdm2, p21, mll1, mll2 and moz regions, in (g) MDA-MB-468 and (h) MDA-MB-175VII cells. i. ChIP-qPCR showing p53 (DO-1 antibody) or IgG (Mouse) enrichment over mll1, mll2 and moz peak regions in PANC-1 cells. (Error bars represent mean ± s.e.m., n=3. Two-tailed Student's t-test: *p<0.05; **p<0.01; ***p<0.001)
Extended Data Figure 5
Extended Data Figure 5. GOF p53 regulates expression of MLL1, MLL2 and MOZ, and corresponding histone PTMs, in cancer cells
a, b. RT-qPCR analysis measuring mRNA level changes upon (a) siRNA-mediated GOF p53 knockdown in MDA-MB-468 cells, and (b) shRNA-mediated WT p53 knockdown in MDA-MB-175VII cells. c, d. (c) RT-qPCR analysis of mRNA levels, and (d) western blot analysis of protein levels upon DMSO or Nutlin treatment in MCF7 cells. e. Western blot analysis of MLL1 protein level upon shRNA-mediated WT p53 knockdown in MDA-MB-175VII cells. f. Western blot analysis of MOZ protein level change upon shRNA-mediated GOF p53 knockdown in MDA-MB-468 cells. g. RT-qPCR measuring mRNA levels changes upon shRNA-mediated ets2 knockdown in MDA-MB-468 cells. h, i. (h) RT-qPCR measuring mRNA levels and (i) western blot measuring protein levels upon shRNA-mediated ets2 knockdown in BT-549 cells. j, k. RT-qPCR measuring mRNA levels changes upon shRNA-mediated ets1 knockdown in (j) BT-549 and (k) MDA-MB-468 cells. #89 and #91 denote two short hairpins targeting ets1, sequences of which are shown in Table S3. l, m. ChIP-qPCR showing (l) p53 occupancy and (m) PolII occupancy upon shRNA-mediated ets1 knockdown in MDA-MB-468 cells. n, o. Western blot analysis of histone methylation and acetylation level changes upon (n) siRNA-mediated or (o) shRNA-mediated knockdown of GOF p53 in MDA-MB-468 cells. p. Western blot analysis of histone methylation and acetylation level changes upon GOF p53 knockdown in PANC-1 cells. q. Western blot of H3K9ac change upon moz knockdown in MDA-MB-468 cells. (Uncropped blots shown in Supplementary Fig. 1. Error bars represent mean ± s.e.m., n=3. Two-tailed Student's t-test: *p<0.05; **p<0.01; ***p<0.001)
Extended Data Figure 6
Extended Data Figure 6. GOF p53 regulates expression of MLL1, MLL2 and MOZ, and corresponding histone PTMs, in primary MEFs
a. RT-qPCR analysis comparing mll1 expression levels between MEFs bearing WT p53, GOF p53 R172H, and p53 null. b. Western blot comparing MLL1 protein level between MEFs with WT p53 and GOF p53. c. RT-qPCR analysis comparing mll2 and moz expression levels between MEFs bearing WT p53, GOF p53 R172H, and p53 null. d. RT-qPCR measuring mRNA changes upon shRNA-mediated p53 knockdown in GOF p53 R172H knock-in MEFs. e, f. (e) RT-qPCR analysis of mRNA levels and (f) western blot of protein levels upon retroviral expression of GOF p53 R172H in MEFs with p53 knockout. g. Western blot comparing H3K4me3 and H3K9ac levels between MEFs with WT p53 and GOF p53 R172H. h. Western blot showing H3K4me3 and H3K9ac levels upon p53 knockdown in WT p53 MEFs. i. Growth curve analysis of WT p53 MEF proliferation upon shRNA-mediated p53 knockdown. j, k. Boxplot analysis of RNA levels (left) and H3 normalized H3K4me3 levels (right) at (j) previously discovered MLL1 target genes, or (k) hoxa cluster genes compared with all genes, from RNA-seq and H3K4me3 ChIP-seq in MEFs with WT p53 or GOF p53 R172H. Plots are presented as ratios of GOF p53 R172H values over WT p53 values. l. Track views of H3K4me3 enrichment (up) and RNA levels (down) of p21, from H3K4me3 ChIP-seq and RNA-seq of MEFs with WT p53 or GOF p53 R172H. Tracks are presented as overlay of WT p53 and GOF p53 signals. Blue denotes more enriched in WT p53, red denotes more enriched in GOF p53 R172H, black denotes overlap. m. Boxplot of H3 normalized H3K4me3 levels over all gene TSSs, from H3K4me3 ChIP-seq in MEFs with WT p53 or GOF p53 R172H. n. RT-qPCR analysis comparing hox gene expression levels between MEFs bearing WT p53, GOF p53 R172H and p53 null. (Uncropped blots shown in Supplementary Fig. 1. For all bar graphs, two-tailed Student's t-test: *p<0.05; **p<0.01; ***p<0.001. Error bars represent mean ± s.e.m., n=3. For all boxplots, Mann-Whitney test: *p<0.05; **p<0.01; ***p<0.001.)
Extended Data Figure 7
Extended Data Figure 7. MLL knockdown reduces proliferation and cancer phenotype specifically of GOF p53 cancer cells
a, b. Growth curve analysis of (a) MDA-MB-468 and (b) MDA-MB-175VII cells with either non-targeting control shRNA or p53 shRNA knockdown. c, d. Growth curve analysis of (c) MDA-MB-468 and (d) MDA-MB-175VII cells with non-targeting control shRNA, mll1 shRNA, or mll2 shRNA knockdown. e. Growth curve analysis of MCF7 cells with non-targeting control shRNA or mll1 shRNA knockdown. f, g. Colony-formation assay of (f) MDA-MB-468 cells and (g) MCF7 cells with either non-targeting control shRNA or mll1 shRNA knockdown. Corresponding to Fig. 4a, b. h, i. Colony-formation assay of (h) BT-549 cells and (i) PANC-1 cells with either non-targeting control shRNA, or two different mll1 shRNA knockdown, and quantification by crystal violet staining over three biological replicates. Reduction of MLL1 protein is also shown by western blot. j, k. Anchorage-independent soft agar assay of (j) MDA-MB-468 cells and (k) MCF7 cells with either non-targeting control shRNA or mll1 shRNA knockdown. Dashed boxes denote enlarged images of the selected areas. White arrows indicate visible colonies in (j). Quantifications are shown as number of visible colonies. (Error bars represent mean ± s.e.m., n=3. Two-tailed Student's t-test: **p<0.01; ***p<0.001.)
Extended Data Figure 8
Extended Data Figure 8. MLL knockdown reduces proliferation specifically of GOF p53 MEFs and LFS cells
a. Growth curve analysis of GOF p53 R172H MEFs with either non-targeting control shRNA or two different mll1 shRNA knockdown. b. Western blot analysis of MLL1 levels upon shRNA-mediated knockdown in LFS MDAH087 and MDAH041 cells. c. Western blot analysis of p53 protein levels in LFS MDAH087 and MDAH041 cells. d, e. Growth curve analysis of LFS MDAH087 cells upon (d) mll1 knockdown or (e) p53 knockdown. f. Growth curve analysis of LFS MDAH041 cells upon mll1 knockdown. g, h. (g) Western blot analysis of MLL1 level and (h) growth curve analysis of proliferation upon shRNA-mediated mll1 knockdown in IMR90 cells. i. Growth curve analysis of LFS MDAH087 cells with non-targeting control shRNA plus empty vector, p53 shRNA plus vector, and p53 shRNA plus MLL1 expressing vector. j, k. Growth curve analysis of (j) LFS MDAH087 and (k) LFS MDAH041 cells with either non-targeting control shRNA or mll2 shRNA knockdown.
Extended Data Figure 9
Extended Data Figure 9. TCGA RNA expression profile analysis
a-f. TCGA RNA expression profile of GOF p53 target genes (top), housekeeping genes (middle), and WT p53 target genes (bottom) in (a) brain lower grade glioma, (b) head and neck squamous cell carcinoma, (c) bladder urothelial carcinoma, (d) colon adenocarcinoma, (e) esophageal carcinoma, or (f) pancreatic adenocarcinoma tumors with WT p53 (blue), GOF p53 (orange), or p53 null (white). Expression values are normalized read counts ((a), (b), (c), (d) and (f)), or RPKM values (e) from TCGA RNA-seq datasets. Mann-Whitney tests were performed to compute significance.
Figure 1
Figure 1. Genome-wide binding of GOF p53 mutants
a. Area under the curve analysis showing p53 enrichment (ChIP/Input) in five cell lines over TSS-proximal peak regions identified in each cell line. Mann-Whitney tests were performed to compute significance for combined WT and combined GOF p53 peaks: MCF7 (p=2.78×10⁻⁶), MDA-MB-175VII (p=2.15×10⁻⁴), MDA-MB-468 (p<2.2×10⁻¹⁶), HCC70 (p=1.09×10⁻³), BT-549 (p=3.7×10⁻⁵). b. Co-immunoprecipitation of HEK293T cell expressed Flag-ETS2 with in vitro expressed GFP or HA tagged p53, followed by western blot. c. GO analysis of p53 R273H TSS-proximal peaks (statistics are shown in Table S1). (Uncropped blots shown in Supplementary Fig. 1)
Figure 2
Figure 2. GOF p53 mutants directly target chromatin regulators
a. Track views of p53 occupancy over promoter regions of mll1, mll2, moz and p21. b, c. ChIP-qPCR showing p53 or IgG enrichment (ChIP/Input) in (b) MDA-MB-468 and (c) MDA-MB-175VII cells. BS: p53 binding site. Primer locations shown in Extended Data Fig. 4a. d, e. ChIP-qPCR showing p53 enrichment changes upon (d) p53 or (e) ets2 knockdown. #20 and #21 denote two short hairpins, sequences of which are shown in Table S3. f. ChIP-qPCR showing p53 or IgG enrichment in MEFs bearing p53 WT or R172H. (Error bars represent mean ± s.e.m., n=3. Two-tailed Student's t-test: *p<0.05; **p<0.01; ***p<0.001)
Figure 3
Figure 3. GOF p53 mutants regulate MLL and MOZ, and thereby histone PTMs
a. RT-qPCR measuring mRNA level changes upon shRNA-mediated p53 knockdown. b, c. Western blot of MLL1 protein level changes upon (b) p53 or (c) ets2 knockdown. d. ChIP-qPCR showing PolII enrichment changes upon shRNA-mediated ets2 knockdown. e. Western blot showing histone modification changes upon p53 knockdown over time. f. Western blot (left) and quantification (right) of endogenous MLL1 protein levels in MEFs with p53 WT, R172H or null. g. Western blot measuring MLL1 level changes upon p53 knockdown in MEFs bearing p53 R172H. #54549 and #12359 denote two short hairpins, sequences of which are shown in Table S3. h. Western blot measuring endogenous histone modification levels in MEFs bearing p53 WT, R172H or null. i. Overlaid track views of H3K4me3 and RNA levels in MEFs with p53 WT or R172H, over hoxa gene cluster. j. ChIP-qPCR showing H3K4me3 enrichment (H3K4me3 ChIP/H3 ChIP) in MEFs with p53 WT, R172H or null. (Uncropped blots shown in Supplementary Fig. 1. Error bars represent mean ± s.e.m., n=3. Two-tailed Student's t-test: *p<0.05; **p<0.01; ***p<0.001)
Figure 4
Figure 4. MLL1 knockdown reduces proliferation and cancer phenotype of GOF p53 cells
a, b. Colony formation (left) and quantification (right) in (a) MDA-MB-468 or (b) MCF7 cells with non-targeting control (ctrl) or mll1 knockdown (KD). Two-tailed Student's t-test: **p<0.01; n.s.: p>0.05. n=3, the other two biological replicates shown in Extended Data Fig. 7f, g. c, d. Excised xenograft tumors twenty weeks after NSG immune-deficient mice were subcutaneously injected with (c) MDA-MB-468 or (d) MCF7 cells carrying control or mll1 knockdown. Two representative images out of four total in each group are shown. e. Xenograft tumor volumes measured ten weeks after initial injection described in c, d. Palpable tumors smaller than 4mm3 were recorded as 4mm3 due to difficulties in measurement. Zeros indicate that the mouse did not have palpable tumor. Red horizontal lines shown as average tumor volume of all four mice in each group. Mann-Whitney test: ***p<0.001; n.s.: p>0.05. f. Growth curve analysis and corresponding western blot in p53 R172H MEFs with control or p53 knockdown, and vector control (Vec) or MLL1 overexpression. g, h. Growth curve analysis in LFS (g) MDAH087 or (h) MDAH041 cells with control or mll1 knockdown. (Uncropped blots shown in Supplementary Fig. 1. Error bars represent mean ± s.e.m., n=3.)
Figure 5
Figure 5. COMPASS inhibitors specifically reduce GOF p53 cell growth
a, b. Growth curve analysis of LFS (a) MDAH087 and (b) MDAH041 cells treated with DMSO, and 10 μM or 20 μM MI-2-2. c, d. Growth curve analysis of LFS (c) MDAH087 and (d) MDAH041 cells treated with DMSO, and 2 μM or 4 μM OICR-9429. e. Growth analysis of p53 R172H MEFs carrying control or p53 knockdown, treated with DMSO or 4 μM OICR-9429. f. Growth analysis of p53 R172H or p53 null MEFs treated with DMSO or 4μM OICR-9429. g. Boxplots of TCGA RNA expression profiles in tumors with p53 WT, p53 GOF or p53 null. Mann-Whitney tests were performed to compute significance, n.s.: p>0.05.

Comment in

References

    1. Lawrence MS, et al. Discovery and saturation analysis of cancer genes across 21 tumour types. Nature. 2014;505:495–501. doi:10.1038/nature12912. - PMC - PubMed
    1. Lang GA, et al. Gain of function of a p53 hot spot mutation in a mouse model of Li-Fraumeni syndrome. Cell. 2004;119:861–872. doi:10.1016/j.cell.2004.11.006. - PubMed
    1. Olive KP, et al. Mutant p53 gain of function in two mouse models of Li-Fraumeni syndrome. Cell. 2004;119:847–860. doi:10.1016/j.cell.2004.11.004. - PubMed
    1. Freed-Pastor WA, et al. Mutant p53 disrupts mammary tissue architecture via the mevalonate pathway. Cell. 2012;148:244–258. doi:10.1016/j.cell.2011.12.017. - PMC - PubMed
    1. Zhang C, et al. Tumour-associated mutant p53 drives the Warburg effect. Nat Commun. 2013;4:2935. doi:10.1038/ncomms3935. - PMC - PubMed

Publication types

MeSH terms

Associated data