. 2015 Jun;47(6):569-76.
doi: 10.1038/ng.3259. Epub 2015 Apr 27.

Understanding multicellular function and disease with human tissue-specific networks

Affiliations

Understanding multicellular function and disease with human tissue-specific networks

Casey S Greene et al. Nat Genet. 2015 Jun.

Abstract

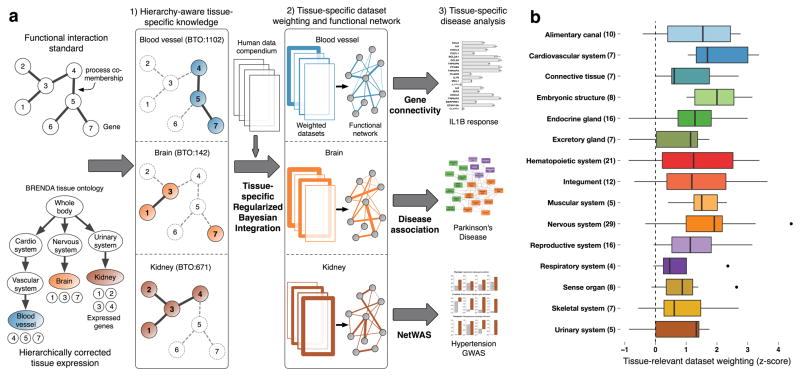
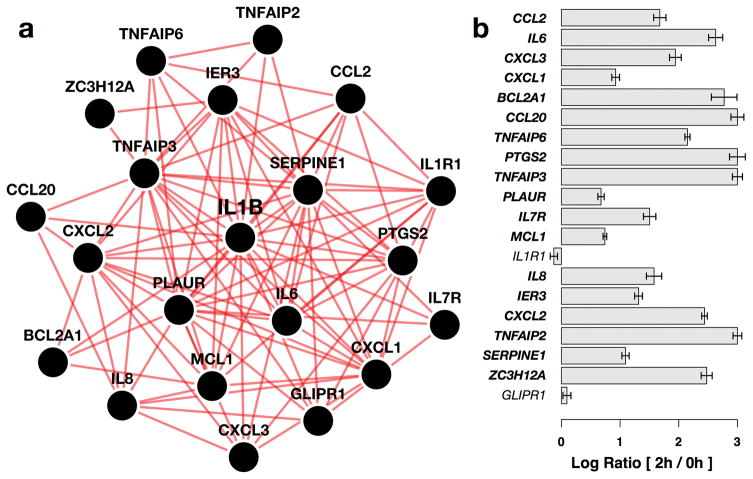
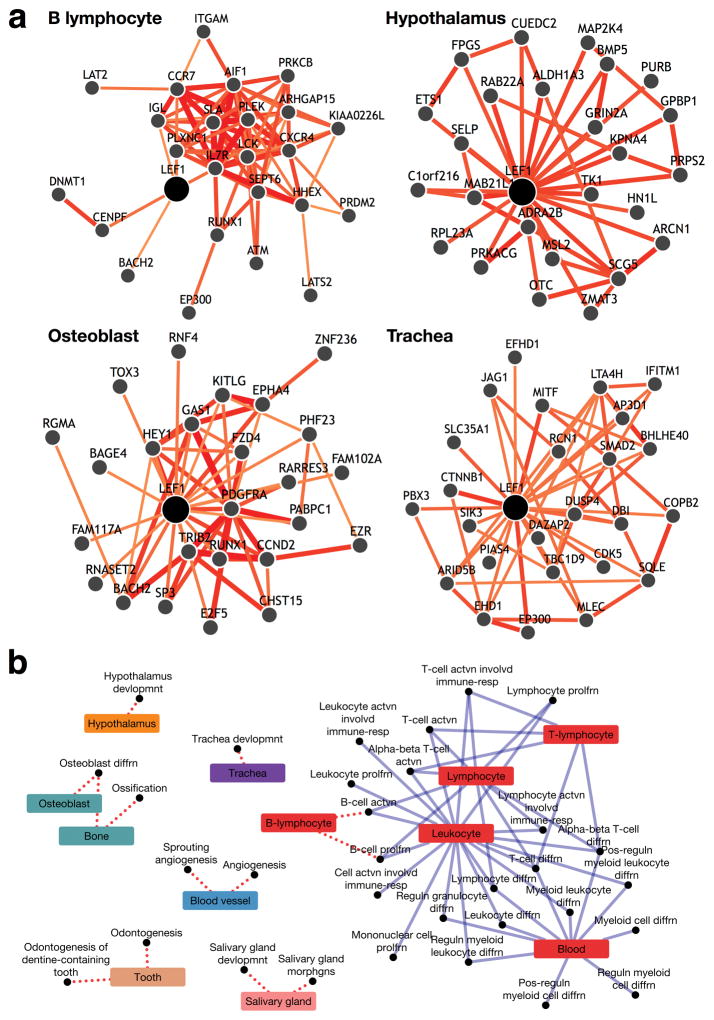
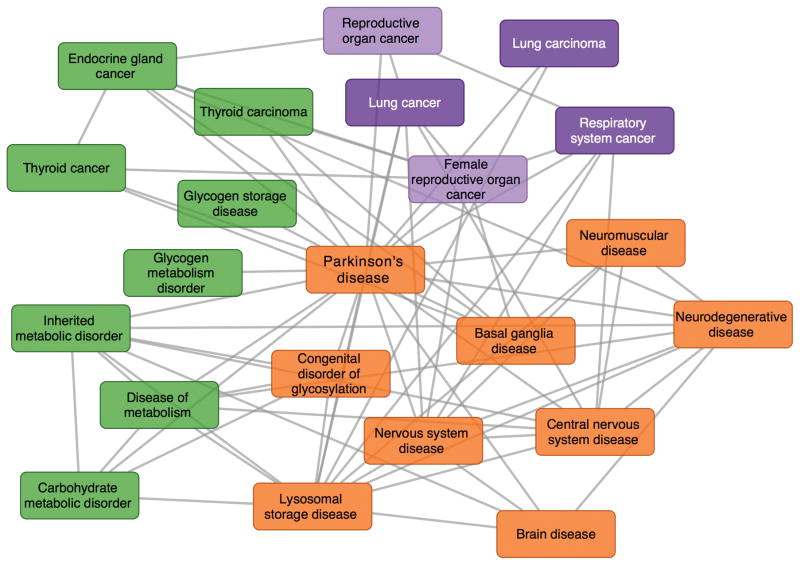
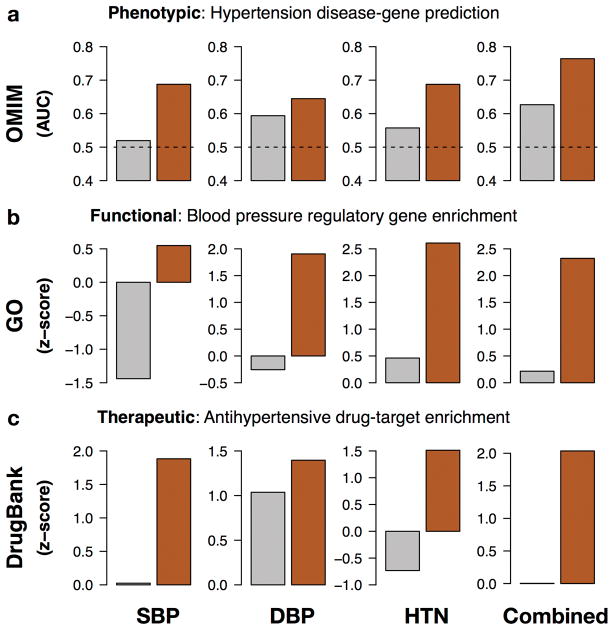
Tissue and cell-type identity lie at the core of human physiology and disease. Understanding the genetic underpinnings of complex tissues and individual cell lineages is crucial for developing improved diagnostics and therapeutics. We present genome-wide functional interaction networks for 144 human tissues and cell types developed using a data-driven Bayesian methodology that integrates thousands of diverse experiments spanning tissue and disease states. Tissue-specific networks predict lineage-specific responses to perturbation, identify the changing functional roles of genes across tissues and illuminate relationships among diseases. We introduce NetWAS, which combines genes with nominally significant genome-wide association study (GWAS) P values and tissue-specific networks to identify disease-gene associations more accurately than GWAS alone. Our webserver, GIANT, provides an interface to human tissue networks through multi-gene queries, network visualization, analysis tools including NetWAS and downloadable networks. GIANT enables systematic exploration of the landscape of interacting genes that shape specialized cellular functions across more than a hundred human tissues and cell types.


Conflict of interest statement

Competing financial interests

The authors declare no competing financial interests.

Figures

Figure 1
Figure 1. Tissue-ontology-aware regularized Bayesian integration
(a) Our integration pipeline constructs tissue-specific functional interaction networks by (1) using tissue-specific knowledge to (2) identify and weight datasets by their tissue-relevant signal. We demonstrate the capabilities of the networks by (3, top panel) experimentally validating the gene connectivity scores, by (3, middle panel) demonstrating that they identify disease associations, and by (3, bottom panel) reprioritizing GWAS results. (b) Bayesian integration using tissue-specific knowledge automatically identifies and weighs tissue-relevant datasets. We validate our approach by evaluating the weights in a set of datasets with clear tissue-specificity. We calculate a z-score per tissue that measures how much the ‘relevant’ datasets are up-weighted relative to all datasets in the compendium for that tissue. Plotted here per organ system (y-axis) is the distribution of z-scores of tissues within that system in the form of a box-plot (x-axis). The thick line within each box indicates the median tissue z-score for that system; the lower and upper ends of the box indicate the first and third quartiles of the distribution; the extended lines on either side denote the limits of the distribution, with the outliers (dots) further away. Beyond automatically identifying relevant datasets, our method of automatic weighting constructed higher quality networks than an identical approach limited to only curation-identified tissue-relevant datasets (Supplementary Fig. 1).
Figure 2
Figure 2. Predicted IL1B functional interaction partners from the blood vessel network are significantly up-regulated after stimulation of blood vessel cells by IL1B
(a) The 20 genes most tightly connected to IL1B in the blood vessel network are shown. These genes are predicted to respond to IL1B stimulation in blood vessel. (b) The barplot shows the differential expression levels of the 20 IL1B neighbors measured in a microarray experiment at 0h and 2h post IL1B stimulation in aortic smooth muscle cells which constitute most of the blood vessel. Each bar represents the gene’s log ratio of mean expression at 2h to that at 0h. Error bars represent regularized pooled standard errors estimated by LIMMA (n=4). 18 out of 20 IL1B network neighbors (labelled in bold) were found to be among the most significantly differentially expressed genes at 2h relative to 0h (p = 1.95e–23).
Figure 3
Figure 3. Tissue-networks capture tissue-specific functional rewiring
(a) Multi-tissue view of LEF1 retrieved from GIANT, a web interface to our tissue-specific networks that facilitates user-directed analysis of human tissue-networks. Using the advanced functionality for comparing functional interactions across tissues, we queried GIANT with the multifunctional gene lymphoid enhancer-binding factor 1 (LEF1) in four tissues: B-lymphocyte, hypothalamus, osteoblast and trachea. The retrieved functional neighbors of LEF1 were indeed notably different across the four networks, leading us to the hypothesis that the tissue networks could recapitulate specific gene wiring. (b) The diverse tissue-specific functional rewiring of LEF1. This bipartite graph of tissues (colored rectangles) and processes (black circles) shows how LEF1 participates in different processes in distinct tissues. For example, in the blood vessel, LEF1 is most closely associated with angiogenesis, but in hypothalamus it is closely associated with hypothalamus development. In addition to prior knowledge about tissue-specific associations of LEF1 (solid blue edges), tissue networks also aid in the discovery of several novel tissue associations that have experimental support in model organisms (dotted red edges).
Figure 4
Figure 4. A disease map centered on Parkinson’s disease (PD) summarizing its molecular associations with other diseases in substantia nigra
The disease map effectively identifies PD’s connection to both documented nervous system diseases as well as several cancers through the PARK gene. Parkinson’s disease is characterized by the death of dopaminergic neurons in substantia nigra. Associations between the genes associated with Parkinson’s disease and other diseases were tested by calculating the connectivity across the disease gene sets relative to their background connectivity in the substantia nigra network. All significant connections (edges) between diseases (nodes) are shown in this disease map.
Figure 5
Figure 5. Network reprioritization of hypertension GWAS identifies hypertension-associated genes
Genes ranked using GWAS (grey) and genes reprioritized using NetWAS (dark red) are assessed for correspondence to genes known to be associated with hypertension phenotypes, regulatory processes, and therapeutics. We compared individual (systolic blood pressure, SBP; diastolic blood pressure, DBP; hypertension, HTN) as well as combined hypertension end-points. (a) Gene rankings were compared to OMIM-annotated hypertension genes using area under the ROC curve (AUC). The AUC for the tissue-specific NetWAS is consistently higher than that for the original GWAS for all hypertension end-points. Merging the network-based predictions for the three hypertension-related endpoints into a combined phenotype results in the best performance (AUC = 0.77; original GWAS AUC = 0.62; dotted line at 0.5 denotes the AUC of a baseline random predictor). Gene rankings were also assessed for enrichment of genes involved in regulation of blood pressure (from GO) and targets of antihypertensive drugs (from DrugBank). The top NetWAS results were significantly enriched with genes involved in (b) blood pressure regulation as well as genes that are (c) targets of antihypertensive drugs. Enrichment was calculated as a z-score (see Methods), with higher scores indicating greater shift from expected ranking towards the top of the list. In nearly all cases, the NetWAS ranking was both significantly enriched with the respective gene sets and more enriched than in the original GWAS ranking.

Comment in

  • Molecular networks in context.
    Gross AM, Ideker T. Gross AM, et al. Nat Biotechnol. 2015 Jul;33(7):720-1. doi: 10.1038/nbt.3283. Nat Biotechnol. 2015. PMID: 26154012 No abstract available.

References

    1. D’Agati VD. The spectrum of focal segmental glomerulosclerosis: new insights. Curr Opin Nephrol Hypertens. 2008;17:271–81. - PubMed
    1. Cai JJ, Petrov DA. Relaxed purifying selection and possibly high rate of adaptation in primate lineage-specific genes. Genome Biol Evol. 2010;2:393–409. - PMC - PubMed
    1. Winter EE, Goodstadt L, Ponting CP. Elevated rates of protein secretion, evolution, and disease among tissue-specific genes. Genome Res. 2004;14:54–61. - PMC - PubMed
    1. Lage K, et al. A large-scale analysis of tissue-specific pathology and gene expression of human disease genes and complexes. Proc Natl Acad Sci U S A. 2008;105:20870–5. - PMC - PubMed
    1. Bernstein BE, et al. An integrated encyclopedia of DNA elements in the human genome. Nature. 2012;489:57–74. - PMC - PubMed

Publication types

Associated data