. 2015 Jun 4;522(7554):89-93.
doi: 10.1038/nature14319. Epub 2015 Mar 11.

Disruption of DNA-methylation-dependent long gene repression in Rett syndrome

Affiliations

Disruption of DNA-methylation-dependent long gene repression in Rett syndrome

Harrison W Gabel et al. Nature. .

Abstract

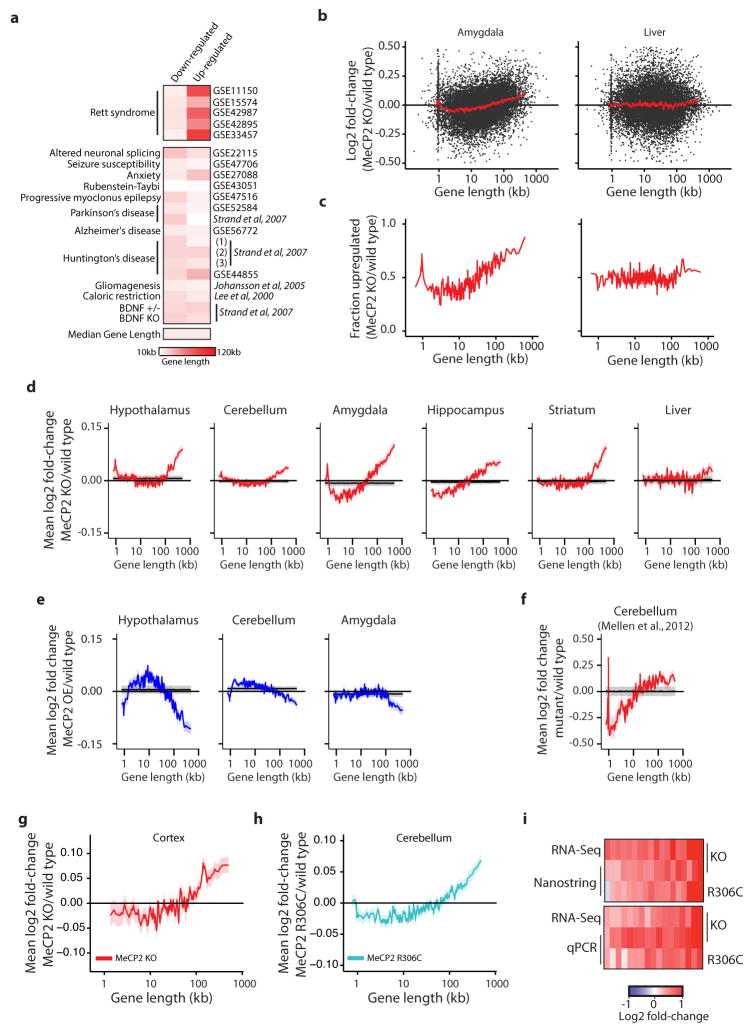
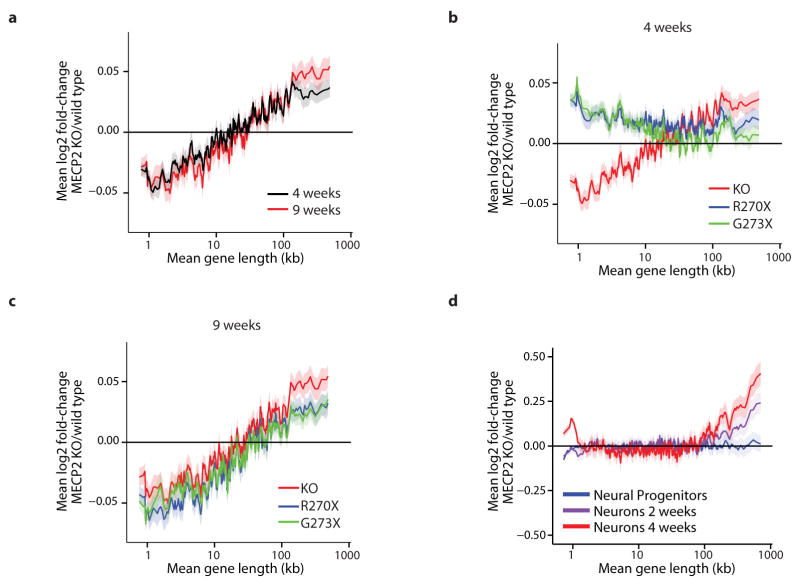
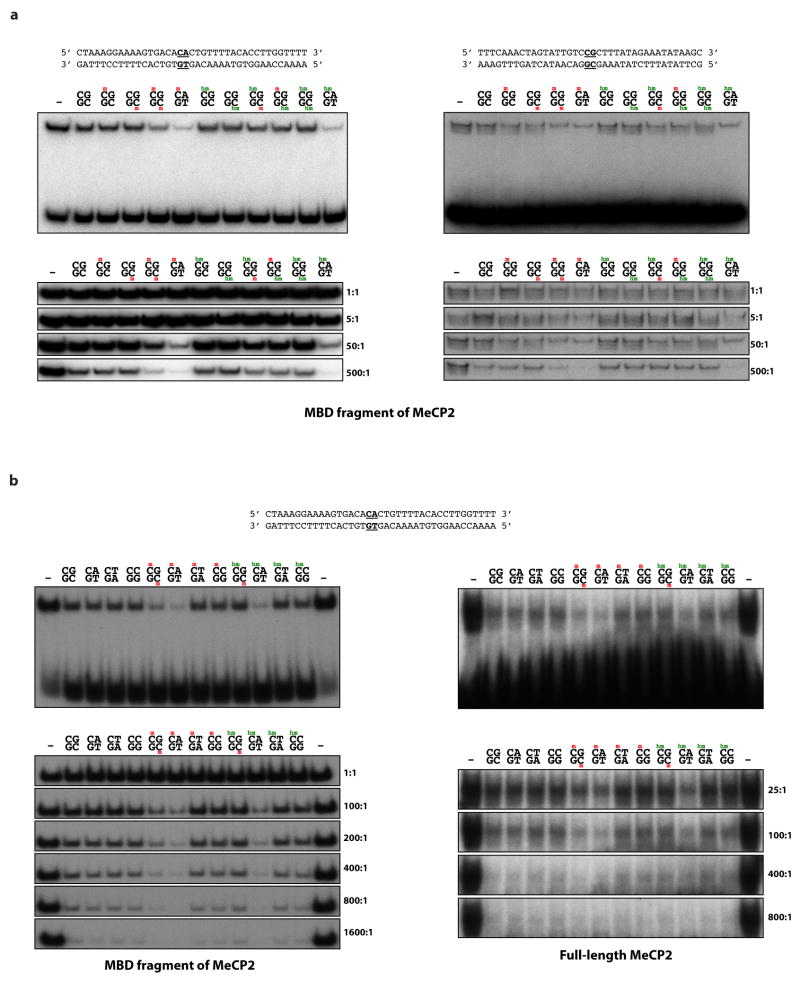
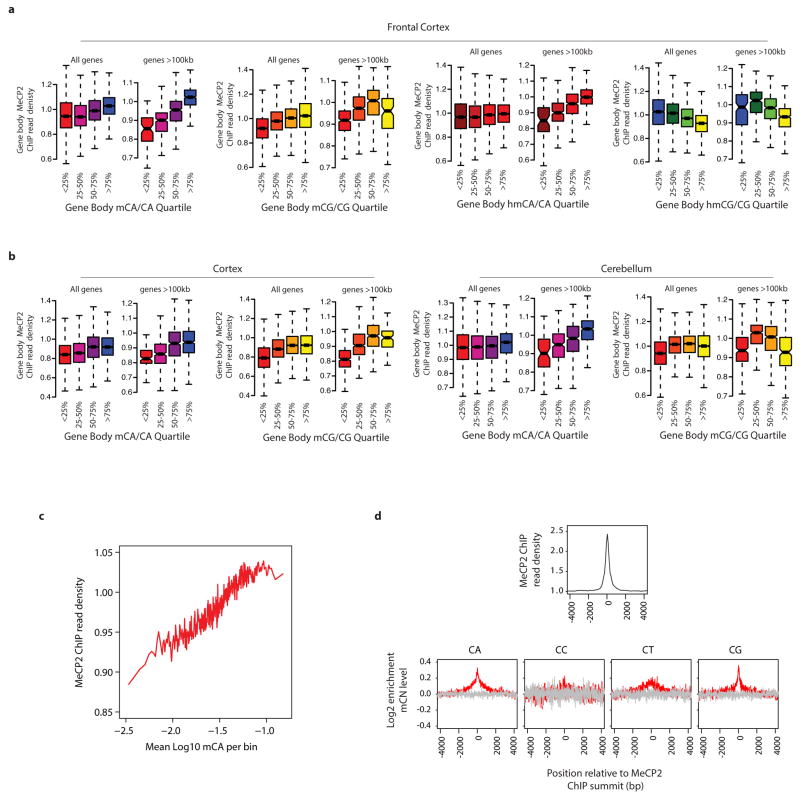
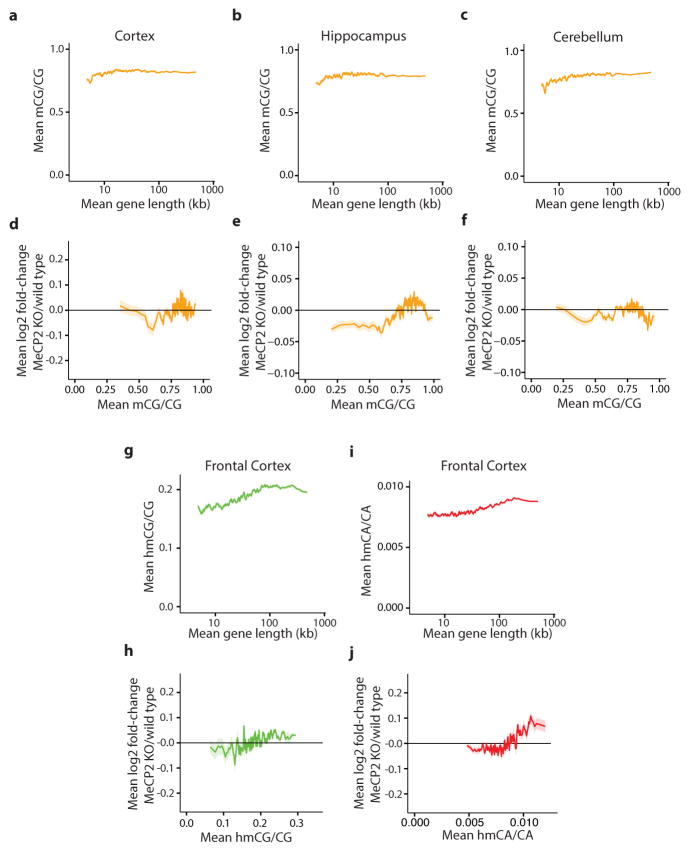
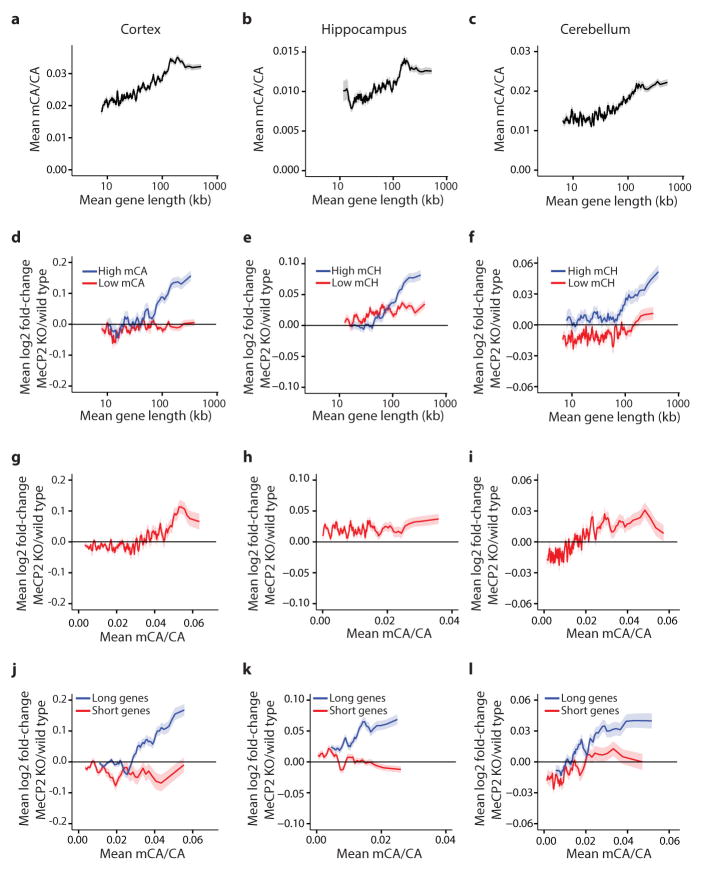
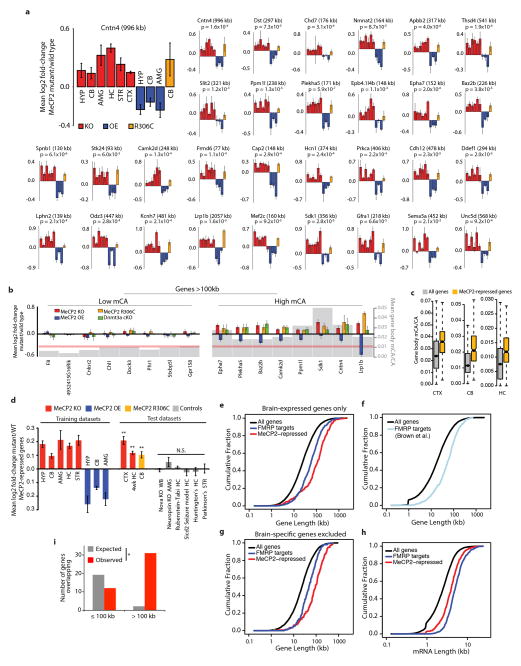
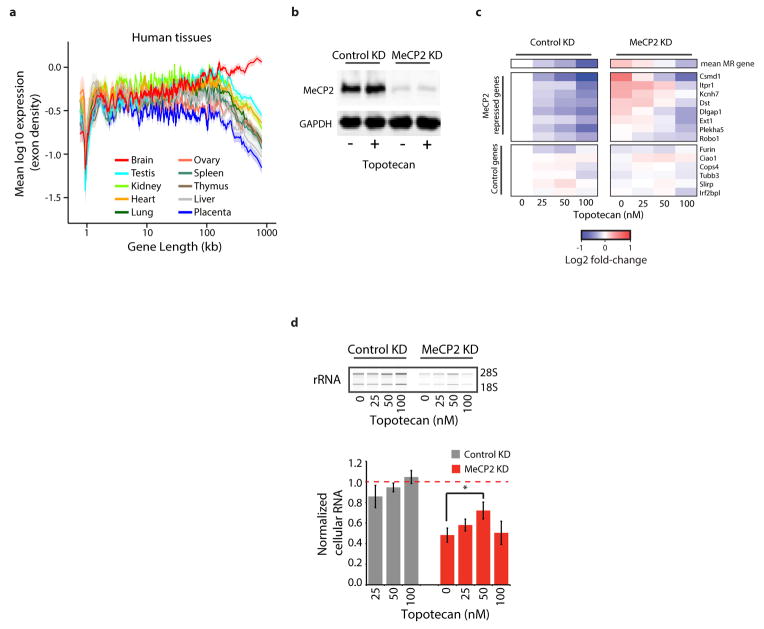
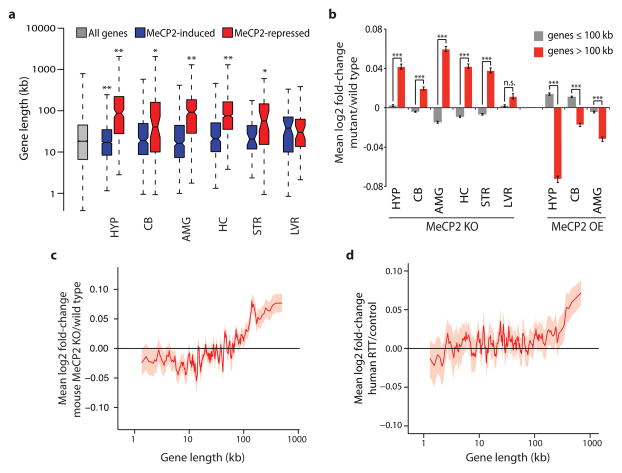
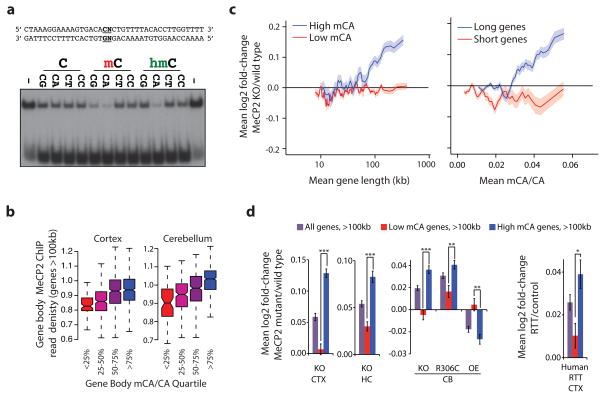
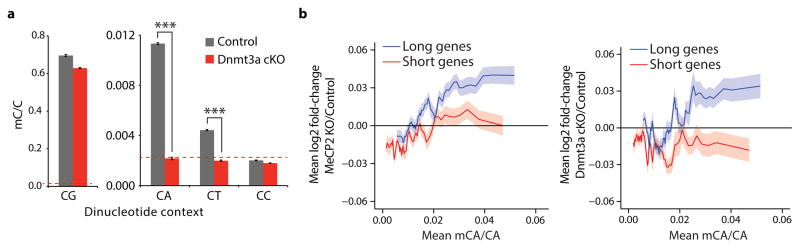
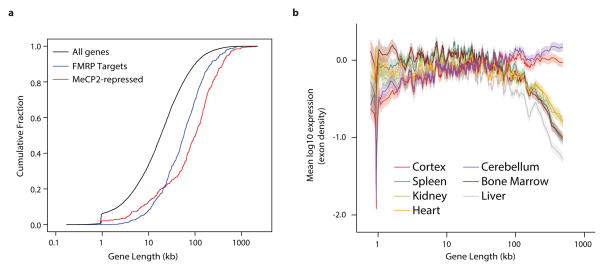
Disruption of the MECP2 gene leads to Rett syndrome (RTT), a severe neurological disorder with features of autism. MECP2 encodes a methyl-DNA-binding protein that has been proposed to function as a transcriptional repressor, but despite numerous mouse studies examining neuronal gene expression in Mecp2 mutants, no clear model has emerged for how MeCP2 protein regulates transcription. Here we identify a genome-wide length-dependent increase in gene expression in MeCP2 mutant mouse models and human RTT brains. We present evidence that MeCP2 represses gene expression by binding to methylated CA sites within long genes, and that in neurons lacking MeCP2, decreasing the expression of long genes attenuates RTT-associated cellular deficits. In addition, we find that long genes as a population are enriched for neuronal functions and selectively expressed in the brain. These findings suggest that mutations in MeCP2 may cause neurological dysfunction by specifically disrupting long gene expression in the brain.


Conflict of interest statement

The authors declare no competing financial interests.

Figures

Extended Data Figure 1
Extended Data Figure 1. Analysis of gene expression changes in Mecp2 mutant mice
a, Heatmap of median gene lengths for genes identified as misregulated in Mecp2 mutant studies or sixteen different studies of neurological dysfunction and disease in mice. Mouse model and GEO accession number, or reference, are listed (for Strand et al. (1), 3NP treatment; (2), Human HD brain; (3), R2/6 Htt transgenic). b, Scatter plots of fold-change in gene expression in the MeCP2 KO for the amygdala (left), which shows robust length-dependent misregulation, and the liver (right), which does not. Fold-change values for genes (black points) and mean fold-change for 200 genes per bin with a 40 gene step are shown (mean, red line; ribbon, S.E.M.). c, The fraction of genes showing fold-change > 0 for datasets in b; genes binned by length (100 gene bins, 50 gene step). d–f, Analysis of published microarray (d, e) or RNA sequencing (RNA-seq) (f) datasets from MeCP2 KO (d, f) or OE (e) mice. Mean fold-change in expression (200 gene bins, 40 gene step), red line; ribbon, S.E.M. For d–f, mean (black line) and two standard deviations (gray ribbon) are shown for 10,000 resamplings in which gene lengths were randomized with respect to fold-change. The spike in mean fold-change at ~1 kb in several plots corresponds to the olfactory receptor genes (Supplementary Discussion). g, Mean changes in expression of genes binned by length from RNA-seq analysis of MeCP2 KO cortex (n = 3 per genotype). h, Mean changes in expression from microarray analysis of genes binned by length in MeCP2 R306C cerebellum (n = 4 per genotype) i, Heatmap summary of fold-changes in gene expression from RNA-seq analysis of Mecp2 mutant mean in g compared to Nanostring nCounter (18 genes, top) or RT-qPCR (17 genes, bottom) analysis from cortex (n=4 per genotype). Selected long genes (>100 kb) consistently up-regulated in the MeCP2 KO or down-regulated in MeCP2 OE mutant mice across brain tissues were tested (Supplementary Table 2). A statistically significant up-regulation of these genes is observed in the cortex for both MeCP2 KO (nCounter, p = 0.00073; qPCR, p < 1×10⁻¹⁵) and MeCP2 R306C (nCounter, p = 0.0482; qPCR, p = 1.69×10⁻⁶; Hotelling T2 test for small sample size). Note that for completeness, data from other figures have been re-presented here.
Extended Data Figure 2
Extended Data Figure 2. Timing and severity of gene expression changes in models of RTT
a, Mean fold-change in gene expression versus gene length in the hippocampus of MeCP2 KO mice compared to wild type at four and nine weeks of age reveals increasing magnitude of length-dependent gene misregulation that parallels the onset of RTT-like symptoms in these animals. b, Mean fold-change in gene expression versus gene length in hippocampus of mice expressing truncated forms of MeCP2 mimicking human disease-causing alleles at four weeks of age. Re-expression of a longer truncated form of MeCP2 (G273X) in the MeCP2 KO normalizes expression of long genes more effectively than expression of a shorter truncation of MeCP2 (R270X), and parallels the higher degree of phenotypic rescue observed in MeCP2 G273X-expressing mice compared to MeCP2 R270X-expressing mice. c, Mean fold-change in gene expression versus gene length in hippocampus of mice expressing truncated MeCP2 at nine weeks of age. Consistent with the eventual onset of symptoms of these mouse strains, length-dependent gene misregulation is evident in both strains. d, Changes in gene expression for genes binned by length in human MECP2 null ES cells differentiated into neural progenitor cells, neurons cultured for 2 weeks, or neurons cultured for 4 weeks. In all plots, lines represent mean fold-change in expression for each bin (200 gene bins, 40 gene step), and the ribbon is S.E.M. of genes within each bin.
Extended Data Figure 3
Extended Data Figure 3. High affinity of MeCP2 for mCG, mCA and hmCA in electrophoretic mobility shift assays
a, Binding of the recombinant methyl-binding domain (MBD) of MeCP2 (amino acids 81–170) to 32P-end-labeled oligonucleotides containing a methylated cytosine in a CA (left) or a CG (right) context competed with unlabeled competitor substituted with unmethylated, methylated, or hydroxymethylated cytosine in a CG or CA context (indicated in bold). Representative full gels showing shifted and unshifted probe in the presence of 50-fold excess of unlabeled competitor (top); close-up of shifted bands over a range of unlabeled competitor (bottom). A mCA-containing oligonucleotide competes for MeCP2 binding with equal or higher efficacy to that of a symmetrically methylated CG oligonucleotide. While hmCG-containing probes compete with similar efficacy to an unmethylated probe, a hmCA-containing probe competes with high efficacy. This difference in affinity of MeCP2 for hmCA- and hmCG-containing probes may explain conflicting results reported for the affinity of MeCP2 for hydroxymethylated DNA,– (Supplementary Discussion). b, Binding and competition of recombinant MeCP2 MBD (amino acids 78–162, left) or full-length MeCP2 (amino acids 1–486, right) incubated with 32P-end-labeled oligonucleotides containing a methylated cytosine in a CA context and competed with oligonucleotides containing unmethylated, methylated, or hydroxymethylated cytosine in a CG, CA, CT, or CC context. Representative full gels showing 100-fold excess of unlabeled competitor (top); close-up of shifted bands over a range of unlabeled competitor (bottom). The results obtained from competitors containing mCG, mCA, hmCG and hmCA are similar to those shown in a. In addition, both (h)mCT- and (h)mCC-containing oligonucleotides compete for MeCP2 binding with similar efficacy to that of an unmethylated probe.
Extended Data Figure 4
Extended Data Figure 4. ChIP-seq analysis of MeCP2 binding in vivo
a, Boxplots of input-normalized read density within gene bodies (TSS +3 kb to TTS) for MeCP2 ChIP from the mouse frontal cortex plotted for genes according to quartile of mCA/CA, mCG/CG, hmCA/CA and hmCG/CG in the frontal cortex for all genes and genes >100 kb. b, Similar analysis of MeCP2 ChIP from the mouse cortex (left) or cerebellum (right) plotted for genes according to quartile of mCA/CA or mCG/CG for all genes and genes >100 kb. MeCP2 ChIP-signal is correlated with mCA/CA levels from the frontal cortex, cortex, and cerebellum for all genes and this correlation is more prominent among genes >100 kb. mCG does not show as prominent a correlation with MeCP2 ChIP signal, and hmCG trends toward anti-correlation with MeCP2 ChIP. These results suggest that MeCP2 has a lower affinity for hmCG than mCG, suggesting that, in vivo, hmCG is associated with reduced MeCP2 occupancy (Supplementary Discussion). c, High resolution analysis of high-coverage bisulfite sequencing data from the frontal cortex showing a correlation between MeCP2 ChIP signal and mCA. Input-normalized ChIP signal plotted for mCA levels for 500 bp bins tiled across all genes. d, Aggregate plots of MeCP2 input-normalized ChIP signal (top) and relative methylation (log2 enrichment in mC as compared to the flanking regions) for mCA, mCC, mCT, and mCG (bottom) are plotted around the 31,479 summits of MeCP2 ChIP enrichment identified using the MACS peak-calling algorithm (red) or 31,479 randomly selected control sites (gray, see Methods).
Extended Data Figure 5
Extended Data Figure 5. Genomic analysis of mCG, hmCG, and hmCA in length-dependent gene regulation by MeCP2
a–c, Mean methylation of CG dinucleotides (mCG/CG) within gene bodies (transcription start site +3 kb, up to transcription termination site) in the cortex (a), hippocampus (b) and cerebellum (c) for genes binned according to length. d–f, Mean fold-change in gene expression in MeCP2 KO compared to wild type in the cortex (d), hippocampus (e), and cerebellum (f) for genes binned according to mCG levels (mCG/CG) within gene bodies. g, Mean hmCG levels (hmCG/CG) within gene bodies in the frontal cortex for genes binned according to length. h, Mean fold-change in gene expression in MeCP2 KO compared to wild type for genes binned according to hmCG levels (hmCG/CG) within gene bodies in the frontal cortex i, Mean hmCA levels (hmCA/CA) within gene bodies in the frontal cortex for genes binned according to length. j, Mean fold-change in gene expression in MeCP2 KO compared to wild type genes binned according to hmCA levels (hmCA/CA) within gene bodies in the frontal cortex. In all panels, mean values for each bin are indicated as a line (200 gene bins, 40 gene step); ribbon depicts S.E.M. for genes within each bin.
Extended Data Figure 6
Extended Data Figure 6. Genomic analysis supports a role for mCA in length-dependent gene regulation by MeCP2
a–c, Mean methylation at CA dinucleotides (mCA/CA) within gene bodies (TSS +3 kb to TTS) in cortex (a), hippocampus (b), and cerebellum (c) for genes binned by length. d–f, Mean changes in gene expression in cortex (d), hippocampus (e), and cerebellum (f) of MeCP2 KO for high mCA genes (top 25% mean gene body mCA/CA) and low mCA genes (bottom 66% mean gene body mCA/CA) binned by length. g–i, Mean changes in gene expression in cortex (g), hippocampus (h), and cerebellum (i) of MeCP2 KO for genes binned according to average gene body mCA/CA levels. j–l, Mean changes in gene expression in cortex (j), hippocampus (k), and cerebellum (l) of MeCP2 KO mice for long genes (top 25%) and short genes (bottom 25%) in each brain region binned by gene body mCA/CA level. A correlation between fold-change in the MeCP2 KO and mCA/CA for all genes is less prominent, or not observed, in the hippocampus and cerebellum for all genes together (h, i), but it is clear for the longest genes in the genome analyzed alone (k, l). Note that average levels of mCA appear lower in hippocampus and cerebellum compared to cortex (compare y-axis in a, b and c), and may explain why a correlation across all genes in not detected in these brain regions. In long genes analyzed alone the cumulative effect of higher mCA levels and integration across the gene may be larger, resulting in a detectable effect. In all panels, the line indicates the mean for 200 gene bins, with a 40 gene step; ribbon depicts S.E.M. for genes within each bin. Note that, for completeness, data from analysis of the cortex presented in Figure 2 are re-presented here.
Extended Data Figure 7
Extended Data Figure 7. Conditional knockout of Dnmt3a in vivo
a, Diagram of the Dnmt3a locus and Cre-dependent conditional knockout strategy for Dnmt3a. LoxP sites (green triangles) flank exon 17, which is removed following Cre-mediated recombination. Primers (purple arrows) were designed to flank exons 17 and 18. The wild-type (WT), floxed (FLX), and knockout (KO) allele are depicted. b, Representative PCR genotyping for tail DNA samples indicates presence or absence of the floxed (flx, ~800 bp), wild-type (WT, ~750 bp), and knockout (KO, ~500 bp) alleles. Separate genotyping reaction for the Nestin-cre transgene (~250 bp) is shown. c, Efficient excision of the floxed exon is detected in cerebellar DNA from conditional knockout (Dnmt3aflx/flx; Nestin-Cre+/−, Dnmt3a cKO) mice but not from and control animals (Dnmt3aflx/flx, Control). d, Western blot analysis of Dnmt3a, MeCP2, and Gapdh (loading control) protein from the cerebellum of control and Dnmt3a cKO adult mice.
Extended Data Figure 8
Extended Data Figure 8. Analysis of MeCP2-repressed genes and FMRP target genes
a, Mean fold-change in mRNA expression for examples of MeCP2-repressed genes across three different Mecp2 mutant genotypes (KO, OE, and R306C) and six brain regions. p-values for each gene are derived from the mean z-scores for fold-change across all datasets (see Methods). b, Gene expression and CA methylation data from the cerebellum for selected MeCP2-repressed genes from a (right), as well as examples of extremely long genes (>100kb) that are not enriched for mCA and are not misregulated (left). Fold-changes in mRNA expression in Mecp2 mutants and the Dnmt3a cKO are shown (left axis), as well as mean mCA levels (gray; right axis). Red line indicates genomic median for gene body mCA/CA c, Boxplots of mCA levels in MeCP2-repressed genes compared to all genes. d, Mean fold-change for MeCP2-repressed genes in eight “training datasets” used to define these genes (see Methods), and nine “test datasets”: three Mecp2 mutant datasets not used to define MeCP2-repressed genes (CTX MeCP2 KO and CB MeCP2 R306C, generated in this study; HC MeCP2 KO 4wk, analyzed from Baker et al.), and six datasets from brains of mouse models of neurological dysfunction generated using the same microarray platforms as the MeCP2 datasets (Geo accession # in order: GSE22115, GSE27088, GSE43051, GSE47706, GSE44855, GSE52584). Error bars are SEM of MeCP2–repressed gene expression across samples (n=4–8 microarrays per genotype per dataset); ** p <0.01, one-tailed t-test, Benjamini-Hochberg correction. Note that significance testing was not performed on training datasets. Brain regions indicated as in Figure 1, (WB, whole brain). e, Cumulative distribution function (CDF) of gene lengths plotted exclusively for genes that are among the top 60% of expression levels in the brain (Supplementary Discussion). The extreme length of MeCP2-repressed genes and genes encoding FMRP target mRNAs when controlling for expression level indicates that the long length of these genesets is not a secondary effect of the preferential expression of long genes in the brain (p < 1×10⁻¹⁵ for each geneset versus all expressed genes; 2-sample Kolmogorov-Smirnov (KS) test). f, The CDF of gene lengths for all genes compared to an independent set of FMRP targets identified by Brown and colleagues (p < 1 ×10⁻¹⁵, KS-test). g, CDF of gene lengths for genes expressed at similar levels in the brain and other somatic tissues (Supplementary Discussion). The extreme length of each geneset (p < 1×10⁻¹⁵, KS-test) when filtering for genes that are expressed in all tissues indicates that regulation of long genes by MeCP2 and FMRP is not dependent on brain-specific expression. h, CDF of mature mRNA lengths for MeCP2-repressed genes, and FMRP target genes (p < 1×10⁻¹¹ for each geneset versus all genes, KS-test). i, Overlap of MeCP2-repressed genes and putative FMRP target mRNAs (p < 5×10⁻⁵, hypergeometric test). Expected overlap was calculated by dividing the expected overlap genome-wide (hypergeometric distribution) according to the distribution of all gene lengths in the genome.
Extended Data Figure 9
Extended Data Figure 9. Consequences of long gene misregulation in neurons
a, Mean expression of genes binned according to length in human neural and non-neural tissues. Mean expression for genes within each bin (200 gene bins, 40 gene step) is indicated by the line; ribbon represents the S.E.M. of genes within each bin. b, Western blot analysis of MeCP2 from primary cortical neurons after control or MeCP2 shRNA knockdown (KD) and treatment with DMSO vehicle (−) or topotecan (+). c, Heatmap summary of nCounter analysis for the expression of selected MeCP2-repressed (MR) genes from primary neurons treated with control or MeCP2 shRNA and topotecan (n = 3–4). Normalized log2 fold-change relative to the DMSO-treated, control KD is shown. MeCP2 KD conditions are significantly different from control, (p = 1e-4, repeated measures ANOVA across 8 genes). Newman-Keuls corrected, post-hoc comparisons: p < 0.05 control KD, 0 nM drug versus MeCP2 KD, 0 nM drug; p > 0.05, control KD, 0 nM drug versus MeCP2 KD, 50 nM drug; p < 0.05 MeCP2 KD, 0 nM drug versus MeCP2 KD, 50 nM drug. d, Bioanalyzer profiles of 18S and 28S ribosomal RNA (top) and total RNA quantification (bottom) for treated neurons (n=3–5). Total RNA values normalized to DMSO-treated control KD, red dashed line. Two-way repeated measures ANOVA indicates a significant effect of KD (p < 0.01) and drug treatment (p < 0.05). Rescue assessed by one-tailed t-test, Bonferroni multiple testing correction, * p < 0.05.
Figure 1
Figure 1. Length-dependent gene misregulation in Mecp2 mutant mice and human RTT brain
a, Boxplots summarizing lengths of genes (Refseq transcription start site to termination site) detected as misregulated in independent studies of Mecp2 mutant mice. HYP, hypothalamus; CB, cerebellum; AMG, amygdala; HC, hippocampus; STR, striatum; LVR, liver. MeCP2-induced (blue), genes down-regulated in MeCP2 knockout (MeCP2 KO) and up-regulated in MeCP2 overexpression (MeCP2 OE) mice. MeCP2-repressed (red), genes up-regulated in MeCP2 KO and down-regulated in MeCP2 OE (see Methods). b, Mean expression changes across brain regions and liver of Mecp2 mutant mice for genes ≤100 kb (gray) and >100 kb (red). c–d, Genome-wide changes in gene expression assessed by RNA-seq analysis of mouse cortical tissue from MeCP2 KO compared to wild type (c) or microarray analysis of human RTT brain samples compared to age-matched controls (d). In c, d lines represent mean fold-change in expression for genes binned according to gene length (200 gene bins, 40 gene step; see Methods); the ribbon is S.E.M. of each bin. *, p < 0.05; **, p < 0.01; ***, p < 1×10⁻¹⁰, n.s. p ≥ 0.05; one-sample (a) or two sample (b) t-test, Bonferroni correction. Error bars represent S.E.M.
Figure 2
Figure 2. MeCP2 represses long genes containing high levels of mCA
a, EMSA analysis of the MeCP2 methyl-binding domain (amino acids 78–162) binding to 32P-end-labeled mCA-containing DNA probe incubated with 100-fold excess of unlabeled competitor oligonucleotides containing unmodified, methylated, or hydroxymethylated cytosines at the dinucleotides indicated in bold; no competitor indicated by “−” (see Methods, Extended Data Fig. 3). b, Boxplots of MeCP2 ChIP-seq read density within genes >100 kb plotted by quartile of mCA/CA in the cortex and cerebellum. c, Mean fold-change in gene expression binned according to gene length in MeCP2 KO cortical tissue for genes with high (mCA/CA > 0.034, top 25%) and low (mCA/CA < 0.031, bottom 66%) mCA levels (left), or binned according to gene-body mCA/CA levels for long (>62 kb, top 25%) and short (<16.8 kb, shortest 25%) genes (right). Lines represent mean fold-change in expression for each bin (200 gene bins, 40 gene step), and the ribbon is S.E.M. of each bin. d, Bar plots of the mean fold-change in expression for all genes >100 kb compared to subsets of genes >100 kb containing low mCA (bottom 50% mCA/CA) or high mCA (top 25% mCA/CA) within their gene body. Values shown for mice with the indicated Mecp2 genotypes (left) and human RTT brain (right). CTX, Cortex; HC, Hippocampus; CB, cerebellum; KO, MeCP2 Knockout; OE, MeCP2 overexpression; R306C, MeCP2 arginine 306 to cysteine missense mutation; ***, p < 1×10⁻¹⁰; **, p < 1×10⁻³; *, p < 0.01; two-tailed t-test, Bonferroni correction. Error bars represent S.E.M.
Figure 3
Figure 3. Disruption of Dnmt3a in the brain leads to length-dependent up-regulation of genes containing high levels of mCA
a, Summary of genome-wide bisulfite-sequencing analysis of mCN (where N = G, A, T, or C) in control and Dnmt3a cKO cerebella (n=2 per genotype). Dashed line represents mean background non-conversion rate of the bisulfite-seq assay (see Methods). b, Mean fold-change in gene expression versus gene-body mCA for MeCP2 KO (left) or Dnmt3a cKO (right) cerebella. Long (top 25%, >60kb) and short (bottom 25%, <14.9kb) genes were binned according to gene-body mCA/CA levels. Lines represent mean fold-change in expression for each bin (200 gene bins, 40 gene step), and the ribbon is S.E.M. of genes within each bin. ***, p < 0.005; two-tailed t-test, Bonferroni correction. Error bars represent S.E.M.
Figure 4
Figure 4. Analysis of long gene expression and regulation in the brain
a, Cumulative distribution function of gene lengths for all genes in the genome (black), MeCP2-repressed genes (red), and genes encoding putative FMRP target mRNAs (blue); p < 1×10⁻¹⁵ for each geneset vs all genes, 2-sample Kolmogorov-Smirnov (KS) test. b, Mean expression of genes binned according to length in mouse for neural and non-neural tissues. Line indicates mean expression for genes within each bin (200 gene bins, 40 gene step); the ribbon represents the S.E.M. of each bin.

Comment in

References

    1. Chahrour M, Zoghbi HY. The story of Rett syndrome: from clinic to neurobiology. Neuron. 2007;56:422–437. doi: 10.1016/j.neuron.2007.10.001. - DOI - PubMed
    1. Guy J, Cheval H, Selfridge J, Bird A. The role of MeCP2 in the brain. Annual review of cell and developmental biology. 2011;27:631–652. doi: 10.1146/annurev-cellbio-092910-154121. - DOI - PubMed
    1. Tudor M, Akbarian S, Chen RZ, Jaenisch R. Transcriptional profiling of a mouse model for Rett syndrome reveals subtle transcriptional changes in the brain. Proceedings of the National Academy of Sciences of the United States of America. 2002;99:15536–15541. doi: 10.1073/pnas.242566899. - DOI - PMC - PubMed
    1. Jordan C, Li HH, Kwan HC, Francke U. Cerebellar gene expression profiles of mouse models for Rett syndrome reveal novel MeCP2 targets. BMC medical genetics. 2007;8:36. doi: 10.1186/1471-2350-8-36. - DOI - PMC - PubMed
    1. Chahrour M, et al. MeCP2, a key contributor to neurological disease, activates and represses transcription. Science. 2008;320:1224–1229. doi: 10.1126/science.1153252. - DOI - PMC - PubMed

Publication types

Substances

Associated data