. 2014 Oct;17(10):1351-61.
doi: 10.1038/nn.3809. Epub 2014 Sep 7.

Metabolic regulator LKB1 is crucial for Schwann cell-mediated axon maintenance

Affiliations

Metabolic regulator LKB1 is crucial for Schwann cell-mediated axon maintenance

Bogdan Beirowski et al. Nat Neurosci. 2014 Oct.

Abstract

Schwann cells (SCs) promote axonal integrity independently of myelination by poorly understood mechanisms. Current models suggest that SC metabolism is critical for this support function and that SC metabolic deficits may lead to axonal demise. The LKB1-AMP-activated protein kinase (AMPK) kinase pathway targets several downstream effectors, including mammalian target of rapamycin (mTOR), and is a key metabolic regulator implicated in metabolic diseases. We found through molecular, structural and behavioral characterization of SC-specific mutant mice that LKB1 activity is central to axon stability, whereas AMPK and mTOR in SCs are largely dispensable. The degeneration of axons in LKB1 mutants was most dramatic in unmyelinated small sensory fibers, whereas motor axons were comparatively spared. LKB1 deletion in SCs led to abnormalities in nerve energy and lipid homeostasis and to increased lactate release. The latter acts in a compensatory manner to support distressed axons. LKB1 signaling is essential for SC-mediated axon support, a function that may be dysregulated in diabetic neuropathy.


Conflict of interest statement

Competing financial interest

R.W.G. has financial relationships with LipoSpectrum and Platomics Inc. The other authors declare no competing financial interests.

Figures
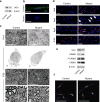
Figure 1
Figure 1
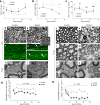
Conditional deletion of LKB1 in SCs. (a) Western blots of sciatic nerve lysates from P30 LKB1fl/fl control and LKB1-SCKO mouse probed with the indicated antibodies shows marked reduction of LKB1 protein expression in the mutant. (b) Fluorescence immunolabeling on teased fiber preparations from P30 tibial nerves demonstrating strong reduction of LKB1 protein in the LKB1-SCKO sample as compared to LKB1fl/fl control. Blue: DAPI, scale bars: 20 μm (c) Representative light and electron micrographs (bottom panel) of transverse sciatic nerve sections from LKB1fl/fl control and LKB1-SCKO mice at the indicated ages. Note substantial hypomyelination at P14 in mutant nerves that is no longer apparent at P30. Scale bars: 40 μm (light microscopy), 2 μm (electron microscopy). (d) Immunofluorescence of longitudinal frozen sciatic nerve (P21) sections using the indicated stage-specific markers shows marked increases in SCs expressing Oct6, Sox2 (arrows), and Egr2 in LKB1-SCKO nerves as compared to LKB1fl/fl control nerves, while there is no difference in the number of S100-positive SCs. Blue: DAPI, scale bars: 50 μm (e) Western blots of sciatic nerve lysates from P30 LKB1fl/fl control and LKB1-SCKO mouse probed with the indicated antibodies shows reduction of the active fragment of axonal Nrg1 expression in the mutant nerve, and concomitant increase of ERBB2, phospho-ERBB2, and ERBB3 signals. (f) Representative confocal fluorescence microscopy of primary SC cultures established from P30 sciatic nerves from control (LKB1fl/fl:PLP-EGFP) and mutant (LKB1fl/fl :P0Cre+:PLP-EGFP) mouse shows no obvious structural differences between individual SCs from each genotype. Scale bars: 100 μm For uncropped pictures of western blots see Supplementary Figure 19.
Figure 2
Figure 2
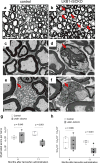
Metabolic alterations and progressive axonopathy in LKB1-SCKO nerves. (a–c) Increased AMP/ATP (a) and reduced NAD+/NADH ratios (b) in sciatic nerve preparations from LKB1-SCKO mutants as compared to LKB1fl/fl control mice. Note no significant differences in sciatic nerve NAD+ levels (c). a: #P=0.130 (N=7), *P=0.021 (N= 6–7), **P<0.001 (N=6), ***P=0.010 (N=6–7); b: *P=0.034 (N=4–5), **P=0.008 (N=6), ***P<0.001 (N=5); c: #P=0.431 (N=7), ##P=0.312 (N=6–7), ###P=0.399 (N=6), ####P=0.361 (N=7). N indicates mice per genotype (d–o) Light (d, e, j, k), electron (h, i, l–o), and confocal microscopy (f, g) of sciatic nerves from control (LKB1fl/fl[Thy1.2-YFP-16]) and mutant (LKB1fl/fl :P0Cre+[Thy1.2-YFP-16]) mice at the indicated ages. Collapsed or fragmented profiles of myelinated axons appeared initially in P90 LKB1-SCKO samples (arrow in e, inset shows example electron micrograph of degenerated axon), and became abundant in aged mutants (k, m). Note numerous fiber ovoids, and reduced axon density with increased inter-axonal spaces (k, m). Longitudinal axoplasm imaging revealed axonal continuity interruption and swelling (g). Degeneration of unmyelinated axons occurred in Remak bundles by initial disintegration/swelling (i) and later complete loss (o, arrow). Scale bars: 20 μm (d, e, j, k); 2 μm (inset in e); 50 μm (f, g); 2 μm (h, i, n, o); 10 μm (l, m) (p, q) Quantification of myelinated (p) and unmyelinated axons (q) in sciatic nerves from LKB1fl/fl control and LKB1-SCKO mice from 2–18 months of age. Note significant loss of both axon populations in mutants starting at 3 months of age. N=4–7 mice per genotype at each age
Figure 3
Figure 3
Axon degeneration in LKB1-iSCKO mutants. (a–f) Light (a, b), and electron microscopy (c–f) of transverse sciatic nerve sections from 12-month-old LKB1fl/fl control mice (a, c, e) and LKB1fl/fl: PLP-CreERT (LKB1-iSCKO) mutants that were treated with tamoxifen starting at P30 (b, d, f). Arrows indicate degenerated profiles of mutant myelinated axons (b, d) and unmyelinated Remak fibers (f). Scale bars: 20 μm (a, b), 4 μm (c, d), 2 μm (e, f) (g, h) Quantification of myelinated (g) and unmyelinated axons (h) in sciatic nerves from LKB1fl/fl control and LKB1-iSCKO mice at 4 and 11 months after tamoxifen administration shows significant reductions in axon numbers in LKB1-iSCKO mutants. N=5–6 mice per genotype at each time-point
Figure 4
Figure 4
Preservation of motor and loss of sensory axons in LKB1-SCKO mutants. (a) Confocal z-series projections of extensor hallucis longus (EHL) whole-mount muscle preparations from 16-month-old LKB1fl/fl(Thy1.2-YFP-16) control and LKB1-SCKO(Thy1.2-YFP-16) mice. Green: YFP; red: TRITC-α-bungarotoxin. Note co-localization of green axon terminals and red postsynaptic signals indicating preserved neuromuscular junctions in mutant mice. Scale bars: 20 μm (b) Confocal z-series projections of intraepidermal sensory axon terminals in footpads from 12-months-old LKB1fl/fl(Thy1.2-YFP-16) control and LKB1-SCKO(Thy1.2-YFP-16) mutant show almost complete axon degeneration in the mutant. The dotted lines depict the border between dermis and epidermis. Scale bars: 20 μm (c) Graph showing results of hot-plate tests for mouse cohorts at the indicated ages. Note significantly increased reaction latencies to thermal pain stimulus in mutants from 2–16 months of age. (d, e) Light microscopy (at 12 months of age) and quantification of motor and sensory myelinated axons in quadriceps (d) and saphenous nerves (e) at the indicated ages. Note reduced nerve size and axon numbers in mutant saphenous nerves, but no differences in quadriceps nerves from 12-month-old mice. Scale bars: 100 μm (f) Axon width distribution profile in sciatic nerves from 8-month-old mice. *P=0.003, #P=0.096, ##P=0.055, N=5 mice per genotype
Figure 5
Figure 5
Absence of demyelination in LKB1-SCKO mutants. (a, b) Sciatic nerve g-ratios as a function of axon diameter (a). Note improvement of g-ratio deficits as LKB1-SCKO mutants age (b) (N=3–5 mice per genotype and age). N=3–5 mice per genotype and age (c) Representative western blots (from at least 5 independent experiments) of sciatic nerve lysates probed with the indicated antibodies for detection of structural myelin proteins. For uncropped pictures of western blots see Supplementary Figure 19. (d) Traces of sciatic nerve CMAPs recorded from a foot muscle after proximal and distal stimulation in 12-month-old mice. Arrows indicate the onset of the CMAPs. Compared to controls, mutants display slightly prolonged latencies, but there is no temporal dispersion of the CMAPs. (e) Quantification of nerve conduction velocities. Each data point represents the mean of 2 measurements per mouse (left and right hind limb), and continuous lines indicate means for each genotype. N=5–10 mice per genotype and age (f) Electron microscopy of transverse vagus nerve sections from 13-month-old mice. Note prominent degeneration of mutant unmyelinated fibers (red arrows) with swollen and disintegrated axoplasm while myelinated large diameter fibers appear relatively intact in the mutant. Scale bars: 4 μm (overview), 1 μm (high magnification) (g) Teased fiber preparations from 14-month-old LKB1fl/fl:PLP-EGFP control and LKB1-SCKO:PLP-EGFP mutant mice showing internodal portions with SC nuclei (asterisks) and nodal segments. Note normal appearance of Schmidt-Lanterman incisures (red arrows), nodes of Ranvier (blue arrows), and longitudinal and transverse Cajal bands (cytoplasmic channels depicted by yellow brackets) in mutant. Scale bars: 20 μm (internode); 4 μm (node)
Figure 6
Figure 6
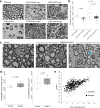
Direct perturbation of AMPK in SCs does not cause axon losses. (a) Light micrographs of sciatic nerves from untreated PTENfl/fl control and PTEN-SCKO (both 11 months) (left column), and rapamycin (rapa) or vehicle (veh) treated PTENfl/fl control, PTEN-SCKO, and LKB1-SCKO mice (all P90). Note substantially improved nerve integrity with higher axon density in PTEN-SCKO mutants treated with rapamycin for 60 days as compared to vehicle treated mutants (middle column). There is no improvement in nerve integrity or a reduction in axon losses in rapamycin-treated LKB1-SCKO mice (right column). Scale bar: 20 μm (b) Quantification of myelinated sciatic nerve axons from P90 LKB1fl/fl control and LKB1-SCKO mice following 60 days of vehicle or rapamycin treatment. (c) Electron microscopy of sciatic nerve transverse sections from 18-month-old control and AMPKβ1/2-SCKO mutants. Note hypomyelination, but normal axon structure and Remak bundle configuration (example depicted by blue arrow) in mutant. Scale bars: 10 µm (d) Quantification of axon populations in sciatic nerves from 12-month-old control and AMPKβ1/2-SCKO mice shows no difference in total axon numbers. N=6 mice per genotype (e) Sciatic nerve fiber g-ratios are shown as a function of axon diameter in 12-month-old control and AMPKβ1/2-SCKO mice. Note the increased g-ratio in these animals, indicative of hypomyelination. N=3–5 mice per genotype
Figure 7
Figure 7
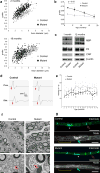
Characterization of downstream pathways and mitochondria in LKB1-SCKO nerves. (a) Western blot analysis of P30 sciatic nerve protein extracts using the indicated antibodies shows pathway alterations consistent with increased AMPK activity. (b) Decreased relative levels of cholesterol in lipid extracts from mutant sciatic nerves at the indicated ages. *P=0.002, **P=0.035, ***P<0.038; N=3–7 mice per genotype and age (c) Nerve lipidomic analysis shows decreased concentrations of total phosphatidylethanolamine lipids (PE) and total cerebrosides (CBS). N=3 mice per genotype (d) Western blots of P30 sciatic nerve lysates probed with the indicated antibodies show increased mitochondrial burden in LKB1-SCKO nerves. (e) Left: Electron micrograph showing increased numbers of mitochondria (red arrows) in SC cytoplasm of LKB1-SCKO nerve (12 months). Scale bars: 1 μm Right: Confocal microscopy of cultured SCs (paraformaldehyde fixed preparations) from 12-month-old control and mutant mouse treated with MitoTracker Red CMXRos shows increased mitochondrial staining intensity in the mutant SC. Scale bars: 25 μm (f) Cytochrome oxidase enzymatic staining of longitudinal sciatic nerve sections shows increased mitochondrial activity in nerves of LKB1-SCKO mice at 2 months, but not at 16 months. Scale bars: 100 μm (g) Confocal live-cell imaging analysis of primary SC cultures loaded with the mitochondrial superoxide indicator dye MitoSOX Red from P30 and 12-month-old mice. Graphs depict average cumulative fluorescence intensities (AU: arbitrary units) of MitoSOX Red signal in SCs. Note significantly increased mitochondrial ROS signals in SCs from 12-month-old mutant mice. N=3 mice per genotype. Scale bars: 100 μm Western blot data are representative for results obtained from at least 5 mice per genotype. For uncropped pictures see Supplementary Figure 19.
Figure 8
Figure 8
Augmented lactate release in LKB1-SCKO nerves supports axonal maintenance. (a) Increased lactate levels in LKB1-SCKO sciatic nerve preparations at 3 months of age and onwards. #P=0.087, *P=0.019, **P=0.045, ***P=0.027; N=3–6 mice per genotype and age (b) Increased lactate dehydrogenase (LDH) activity in sciatic nerve preparations from 3-month-old LKB1-SCKO mutants. #P=0.084, *P=0.039; N=3–5 mice per genotype and age. (c) Reduced sciatic nerve axon numbers in 2DG-treated versus vehicle-treated LKB1-SCKO mutants. Long-term 2DG administration had no effect in control nerves. N=6–11 mice per group (d) Light micrographs of sciatic nerves from vehicle- and 2DG-treated P90 mice. Scale bar: 20 μm

Comment in

References

    1. Nave KA. Myelination and the trophic support of long axons. Nat Rev Neurosci. 2010;11:275–283. - PubMed
    1. Beirowski B. Concepts for regulation of axon integrity by enwrapping glia. Frontiers in cellular neuroscience. 2013;7:256. - PMC - PubMed
    1. Nave KA. Myelination and support of axonal integrity by glia. Nature. 2010;468:244–252. - PubMed
    1. Funfschilling U, et al. Glycolytic oligodendrocytes maintain myelin and long-term axonal integrity. Nature. 2012;485:517–521. - PMC - PubMed
    1. Lee Y, et al. Oligodendroglia metabolically support axons and contribute to neurodegeneration. Nature. 2012;487:443–448. - PMC - PubMed

Publication types

MeSH terms

Associated data