. 2014 Oct 23;159(3):558-71.
doi: 10.1016/j.cell.2014.09.049.

AF9 YEATS domain links histone acetylation to DOT1L-mediated H3K79 methylation

Affiliations

AF9 YEATS domain links histone acetylation to DOT1L-mediated H3K79 methylation

Yuanyuan Li et al. Cell. .

Abstract

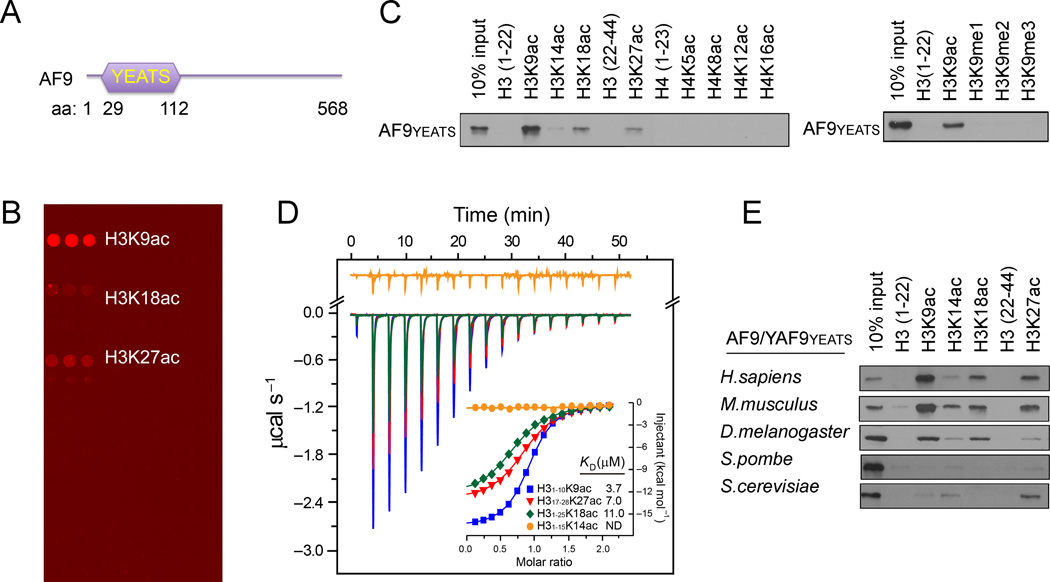
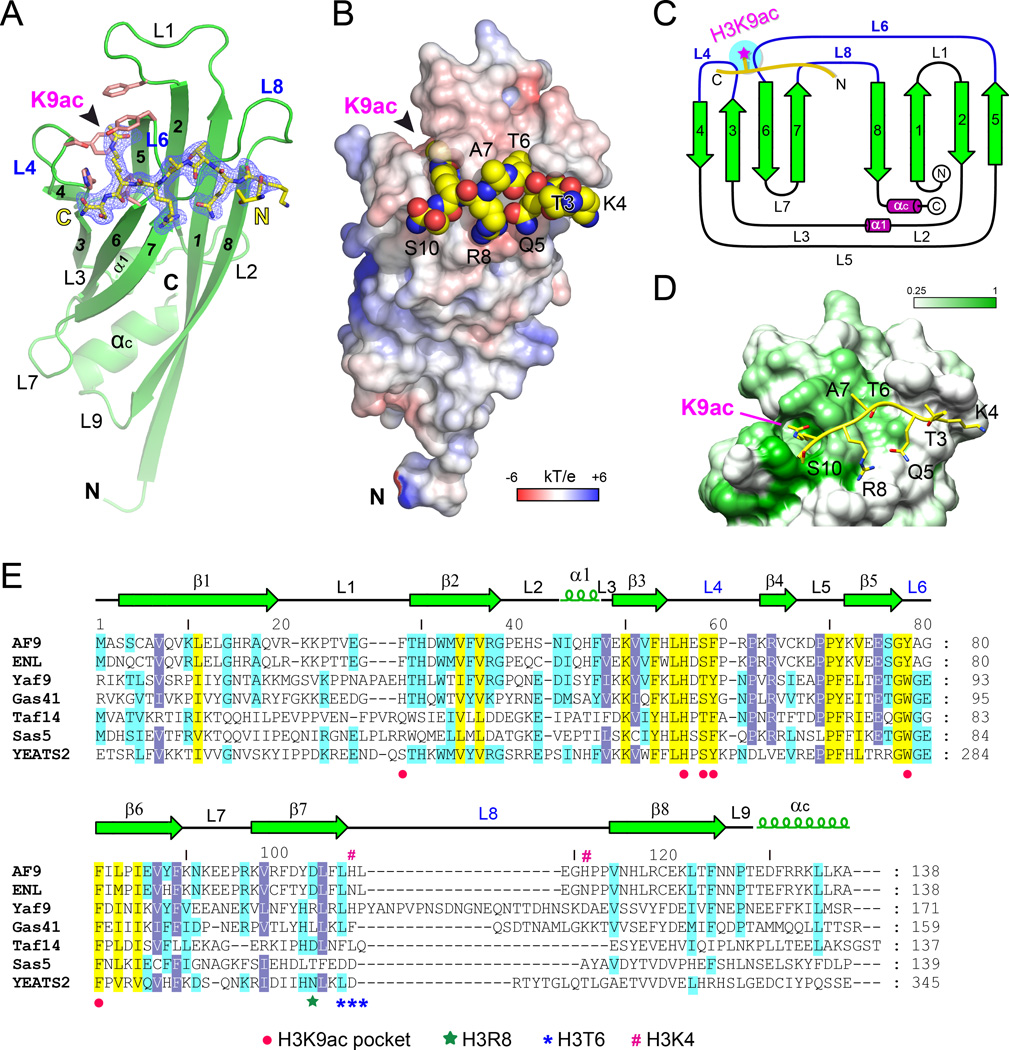
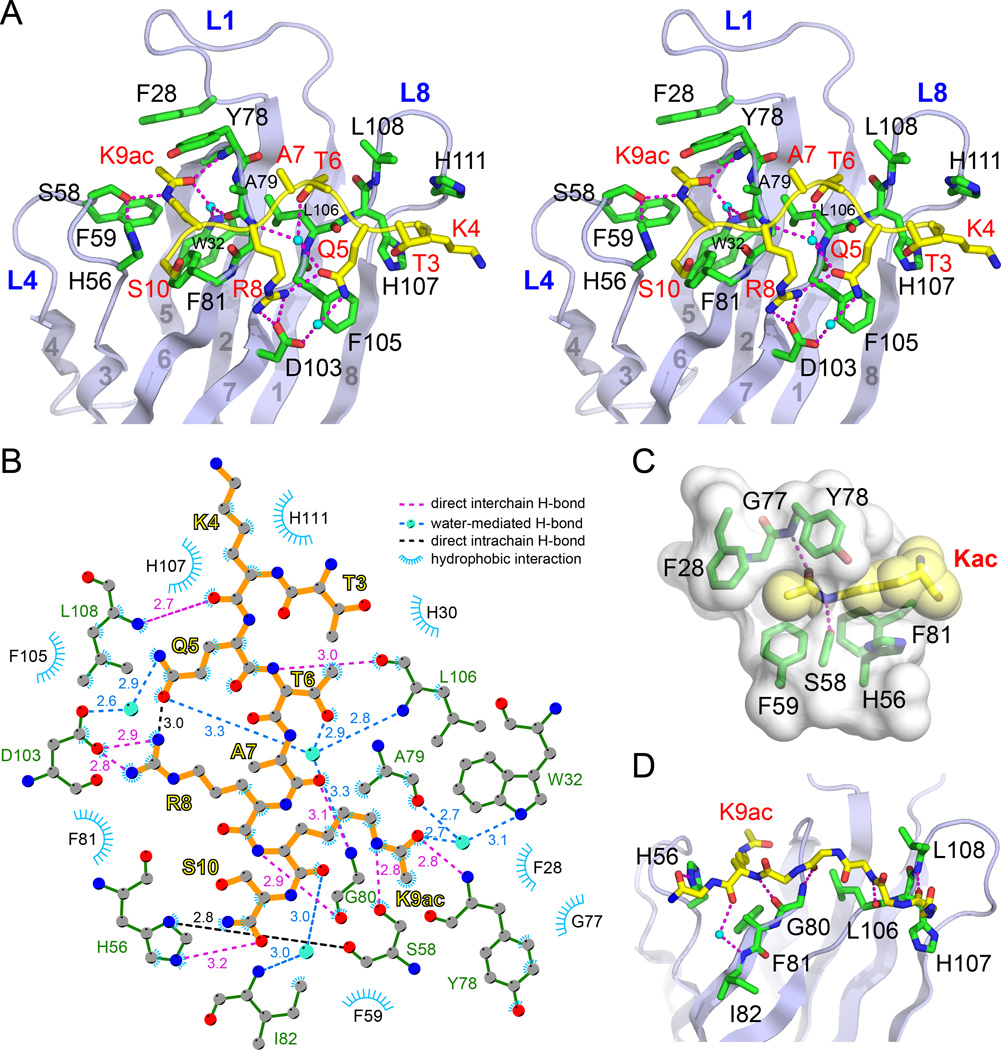
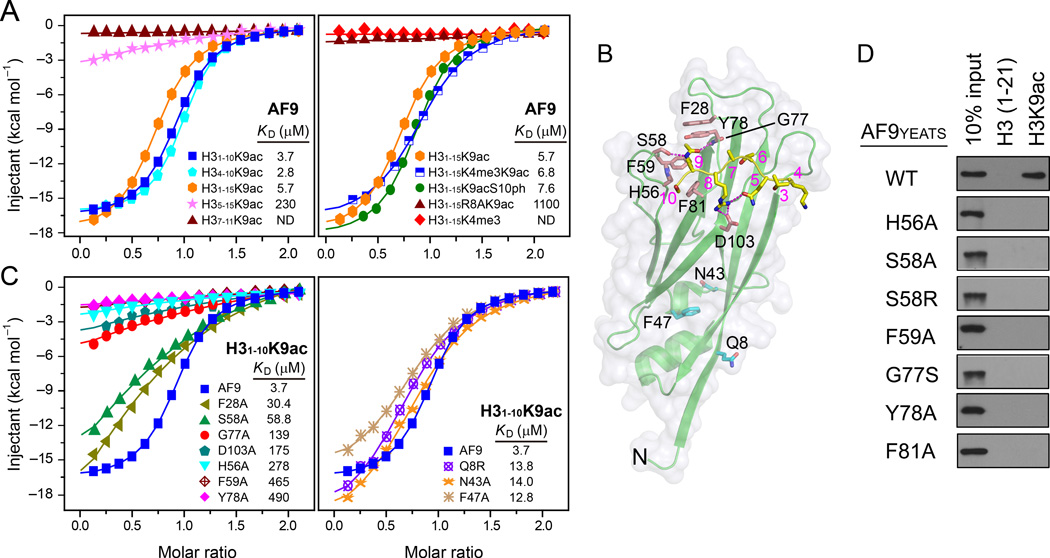
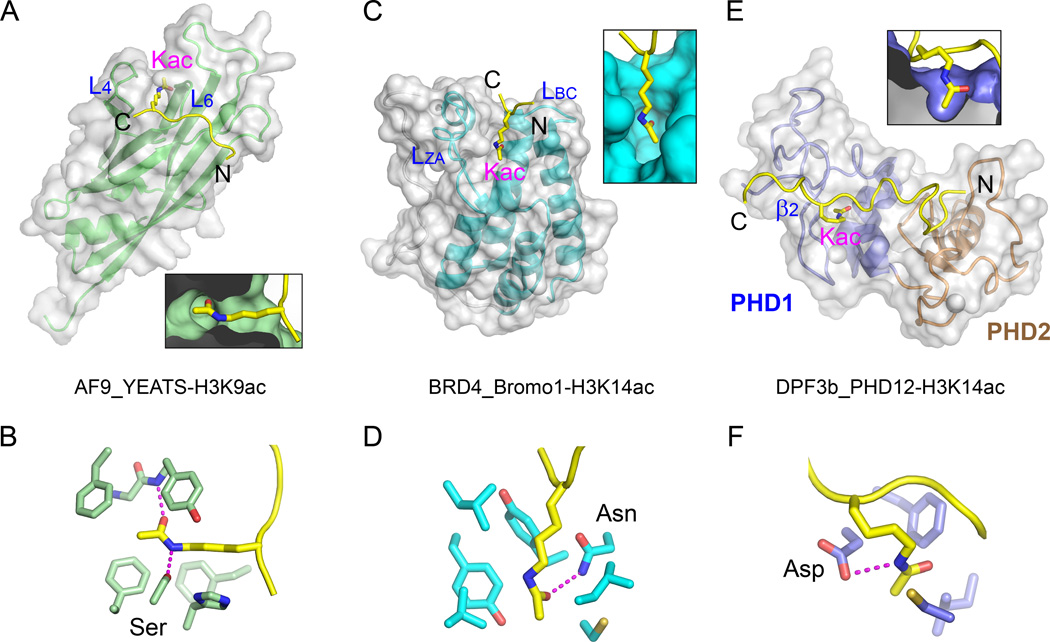
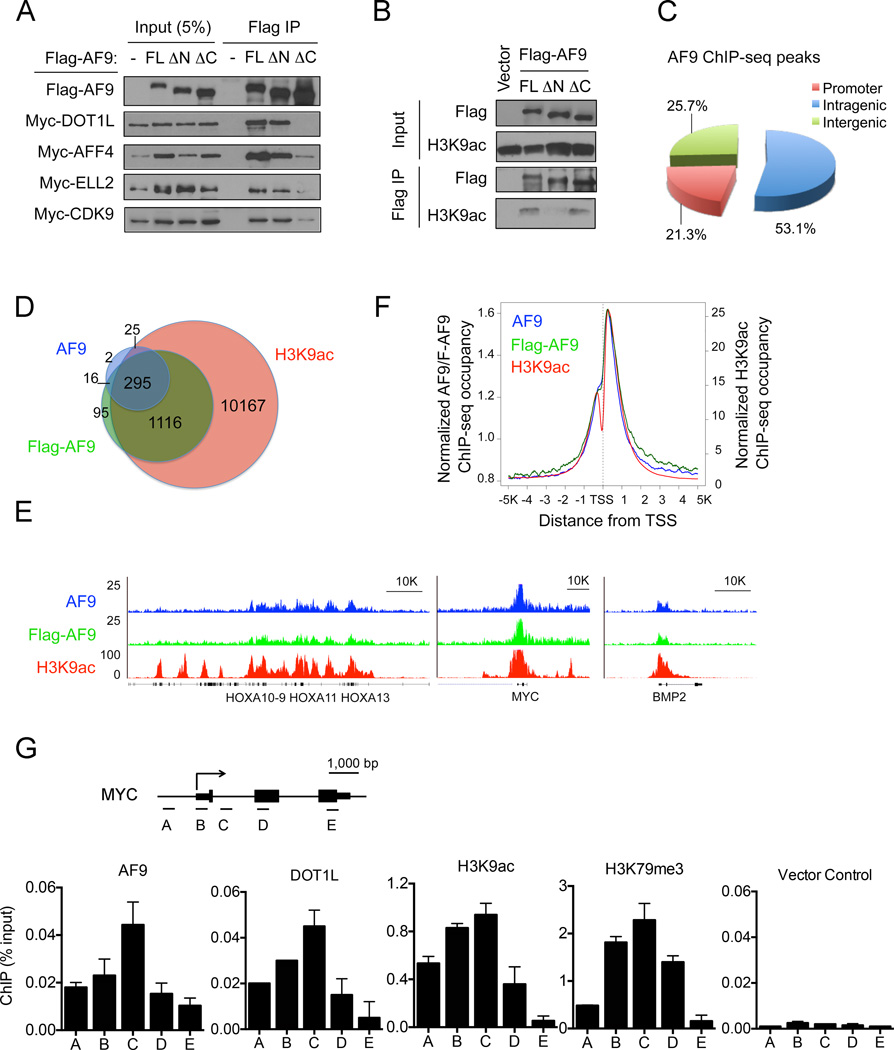
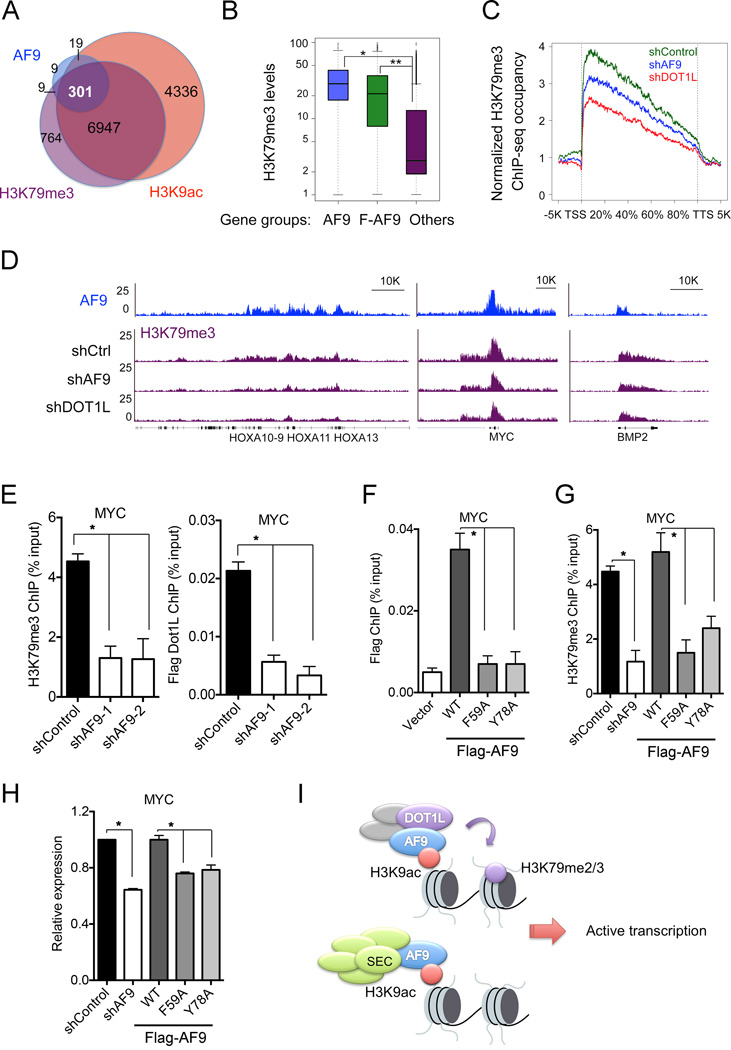
The recognition of modified histones by "reader" proteins constitutes a key mechanism regulating gene expression in the chromatin context. Compared with the great variety of readers for histone methylation, few protein modules that recognize histone acetylation are known. Here, we show that the AF9 YEATS domain binds strongly to histone H3K9 acetylation and, to a lesser extent, H3K27 and H3K18 acetylation. Crystal structural studies revealed that AF9 YEATS adopts an eight-stranded immunoglobin fold and utilizes a serine-lined aromatic "sandwiching" cage for acetyllysine readout, representing a novel recognition mechanism that is distinct from that of known acetyllysine readers. ChIP-seq experiments revealed a strong colocalization of AF9 and H3K9 acetylation genome-wide, which is important for the chromatin recruitment of the H3K79 methyltransferase DOT1L. Together, our studies identified the evolutionarily conserved YEATS domain as a novel acetyllysine-binding module and established a direct link between histone acetylation and DOT1L-mediated H3K79 methylation in transcription control.


Figures

Figure 1
Figure 1. The AF9 YEATS Domain Is a Novel Histone Acetylation-Recognizing Module
(A) Schematic representation of AF9 protein structure. (B) A histone peptide microarray probed with GST-AF9 YEATS domain. (C) Western blot analysis of histone peptide pulldowns with GST-AF9 YEATS domain and the indicated biotinylated peptides. (D) The AF9 YEATS domain binds with highest affinity to the H3K9ac peptide. ITC curves of the indicated histone peptides titrated into the AF9 YEATS domain. ND: not detectable. (E) Recognition of histone acetylation is a common property of the AF9/Yaf9 YEATS domains from diverse species. Western blot analysis of histone peptide pulldowns with YEATS domains from the indicated species and acetylated peptides. See also Figure S1 and Table S1.
Figure 2
Figure 2. Crystal Structure of the AF9 YEATS–H3K9ac Complex
(A) Overall structure of AF9 YEATS domain bound to the H3K9ac peptide. AF9 YEATS is shown as green ribbon with key residues of Kac pocket depicted as salmon stick. H3K9ac peptide is shown as yellow sticks covered by the simulated annealing Fo-Fc omit map countered at 2.5 σ level. (B) Electrostatic surface view of the AF9 YEATS-H3K9ac complex structure. Electrostatic potential is expressed as a spectrum ranging from −6 kT/e (red) to +6 kT/e (blue). The H3K9ac peptide is depicted as space-filling sphere with yellow for carbon, blue for nitrogen and red for oxygen atoms. (C) Topology diagram of AF9 YEATS domain. β-strands in green are numbered sequentially from N- to C-terminus and helices are shown in purple. The H3K9ac peptide is depicted as thick yellow line with the acetyl group highlighted as magenta star. (D) Conservation mapping around the H3-binding surface among AF9 homologues listed in panel E. White and green colors indicate low (≤0.25) and high (1.0) sequence conservation, respectively. The H3K9ac peptide is shown in yellow stick. (E) Sequence alignment of YEATS domain homologues from yeast to human. Conserved residues are shaded in yellow; identical residues are shaded in blue and cyan. Red dots, residues forming K9ac pocket; green star, the H3R8-binding residue; blue asters, the H3T6-binding residues; purple pound sign, H3K4 pocket residues. See also Figure S2.
Figure 3
Figure 3. Molecular Details for Type- and Site-Specific Recognition of H3K9ac by the AF9 YEATS Domain
(A) Stereo view of hydrogen bonding network involving H3 side chains (yellow sticks) and residues in AF9 YEATS (green sticks). Magenta dashes, hydrogen bonds; Small cyan balls, waters. (B) LIGPLOT diagram listing critical contacts between the H3K9ac peptide and the AF9 YEATS domain. H3 segment (orange) and key residues of AF9 YEATS (green) are depicted in ball-and-stick mode. Grey ball, carbon; Blue ball, nitrogen; Red ball, oxygen; Big cyan ball, water molecule. (C) Close-up view of the K9ac-binding pocket of the AF9 YEATS domain. The pocket is displayed as semi-transparent surface with key residues shown as green sticks. Kac is depicted in both yellow stick and space-filling sphere modes. (D) Hydrogen bonding networks involving H3 main chain and the AF9 YEATS domain. For clarity, H3 side chains are omitted from stick representation except for K9ac.
Figure 4
Figure 4. Analysis of the AF9 YEATS-H3K9ac interactions
(A) ITC fitting curves of AF9 YEATS titrated with different frames of the H3K9ac peptides (left) and the H3 peptides containing different modifications (right). (B) The AF9 YEATS-H3K9ac complex structure highlighting the residues used for the mutagenesis and binding studies. (C) ITC fitting curves of H31–10K9ac peptide with point mutants clustered to H3 binding (left) or non-binding (right) surfaces. (D) Western blot analysis of the peptide pulldown analysis using the WT AF9 YEATS domain and the indicated point mutants.
Figure 5
Figure 5. Structural Comparison of AF9 YEATS with Other Acetyllysine Readers
(A) Side-insertion of H3K9ac into AF9 YEATS. Deep insertion of Kac is highlighted in a close-up cutaway view at the bottom. AF9 YEATS is shown in both ribbon and semi-transparent molecular surface view. The two Kac pocket-forming loops are labeled L4 and L6. (B) Acetyllysine recognition by the AF9 YEATS reader pocket. Relayed hydrogen bonding is shown as magenta dashes. (C) Top-insertion of H3K14ac into the first BRD of BRD4 (Bromo1). Coordinates are taken from PDB entry, 3JVK. LZA and LBC denote two loops used for Kac pocket formation. Close-up view illustrates the deep insertion of Kac into a half-open pocket. (D) Acetyllysine recognition by the reader pocket of BRD4 Bromo1. Note the hydrogen bond between Asn side chain and the carbonyl oxygen of the acetyl group. (E) Top-insertion of H3K14ac into the first PHD finger (PHD1) of the DPF3b tandem PHD fingers (PHD12). Coordinates are taken from PDB entry, 2KWJ. Note the shallow nature of the Kac pocket highlighted in a close-up cut-away view. (F) Acetyllysine recognition details of the DPF3b PHD1 reader pocket. See also Figure S4.
Figure 6
Figure 6. AF9 Co-Localizes with H3K9ac Genome-Wide
(A) Western blot analysis of co-IP using the M2 anti-Flag antibody in cells expressing Flag-AF9 and Myc-tagged DOT1L, AFF4, ELL2 or CDK9 proteins. FL: full-length; ∆N: deletion of aa1–112; ∆C: deletion of aa480–568 of AF9. (B) Western blot analysis with the indicated antibodies of Flag ChIP in cells expressing the full-length or truncated Flag-AF9 proteins as in (A). (C) Genomic distribution of AF9 ChIP-seq peaks in HeLa cells. The peaks are enriched in the promoter regions (Transcription Start Site [TSS] −/+3K). P < 1.8e-74 (binomial test). (D) Venn diagram showing the overlap of AF9-, Flag-AF9- and H3K9ac-occupied genes. P< 3.6e-265 (3-way Fisher's exact test). (E) Genome-browser view of the AF9- (blue), Flag-AF9- (green) and H3K9ac (red)-ChIP-seq peaks on the MYC, BMP2 and HOXA genes. (F) Average genome-wide occupancies of AF9 (blue), Flag-AF9 (green) and H3K9ac (red) −/+5 kb around the TSS. (G) qPCR analysis of the indicated ChIP in HeLa cells stably expressing Flag-tagged AF9 or DOT1L. Flag ChIP of cells stably transduced with empty vector was used as a negative control. Schematic of the genomic structure of the MYC gene and PCR primer–targeting regions are indicated in the top panel. The error bars represent the S.E.M. of three experiments. See also Figure S5.
Figure 7
Figure 7. AF9 Is Required for DOT1L-Dependent H3K79me3 Deposition and Gene Activation
(A) Venn diagram showing the overlap of AF9-, H3K9ac- and H3K79me3-occupied genes. P< 3.0e-82 (3-way Fisher's exact test). (B) AF9-occupied genes have higher H3K79me3 levels. Box blots showing the average H3K79me3 levels in the AF9- (blue) or Flag-AF9- (green) occupied genes and the other genes (purple). *: P<2.4e-64, **: P<1.2e-163. (C–E) AF9 depletion reduces the H3K79me3 levels on AF9-occupied genes. (C) Average H3K79me3 occupancy along the transcription unit of the AF9-occupied genes in control (shControl, green) and AF9 KD (shAF9, blue) HeLa cells. H3K79me3 occupancy on the AF9-occupied genes in DOT1L KD cells (shDOT1L, red) is shown for comparison. The gene body length is aligned by percentage from the TSS to TTS. 5 kb upstream of TSS and 5kb downstream of TTS are also included. (D) Genome-browser view of the H3K79me3-ChIP-seq peaks on the indicated genes or regions in cells as in (C). AF9 ChIP-seq peaks are shown on top. (E) qPCR analysis of H3K79me3 and Flag-DOT1L ChIP on MYC in control and AF9 KD HeLa cells stably expressing Flag-DOT1L. (F) qPCR analysis of Flag-AF9 ChIP in cells stably expressing WT or mutant Flag-AF9. (G) AF9 YEATS–H3K9ac interaction is required for H3K79me3 deposition on MYC. qPCR analysis of H3K79me3 ChIP in control and AF9 knockdown cells expressing WT or the indicated mutant Flag-AF9. (H) qPCR analysis of MYC expression in cells as in (G). In panels E-H, the error bars represent the S.E.M. of three experiments. *: P<0.05 (two-way unpaired Student’s t-test). (I) Working model of the recruitment of DOT1L and the SEC complex by AF9 via recognition of H3K9ac by the YEATS domain. See also Figure S6.

References

    1. Adams PD, Afonine PV, Bunkoczi G, Chen VB, Davis IW, Echols N, Headd JJ, Hung LW, Kapral GJ, Grosse-Kunstleve RW, et al. PHENIX: a comprehensive Python-based system for macromolecular structure solution. Acta Crystallogr D Biol Crystallogr. 2010;66:213–221. - PMC - PubMed
    1. Ali M, Yan KZ, Lalonde ME, Degerny C, Rothbart SB, Strahl BD, Cote J, Yang XJ, Kutateladze TG. Tandem PHD Fingers of MORF/MOZ Acetyltransferases Display Selectivity for Acetylated Histone H3 and Are Required for the Association with Chromatin. J Mol Biol. 2012;424:328–338. - PMC - PubMed
    1. Biswas D, Milne TA, Basrur V, Kim J, Elenitoba-Johnson KS, Allis CD, Roeder RG. Function of leukemogenic mixed lineage leukemia 1 (MLL) fusion proteins through distinct partner protein complexes. Proceedings of the National Academy of Sciences of the United States of America. 2011;108:15751–15756. - PMC - PubMed
    1. Bonn S, Zinzen RP, Girardot C, Gustafson EH, Perez-Gonzalez A, Delhomme N, Ghavi-Helm Y, Wilczynski B, Riddell A, Furlong EE. Tissue-specific analysis of chromatin state identifies temporal signatures of enhancer activity during embryonic development. Nature genetics. 2012;44:148–156. - PubMed
    1. Bork P, Holm L, Sander C. The Immunoglobulin Fold - Structural Classification, Sequence Patterns and Common Core. J Mol Biol. 1994;242:309–320. - PubMed

Publication types

MeSH terms

Associated data