. 2014 Oct 30;514(7524):638-41.
doi: 10.1038/nature13823. Epub 2014 Oct 1.

Rapid fucosylation of intestinal epithelium sustains host-commensal symbiosis in sickness

Affiliations

Rapid fucosylation of intestinal epithelium sustains host-commensal symbiosis in sickness

Joseph M Pickard et al. Nature. .

Abstract

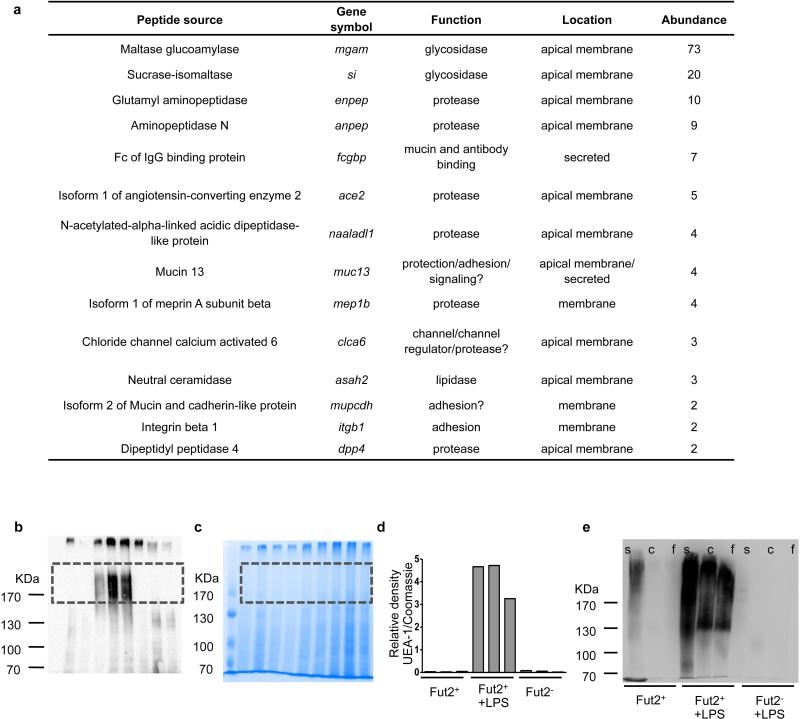
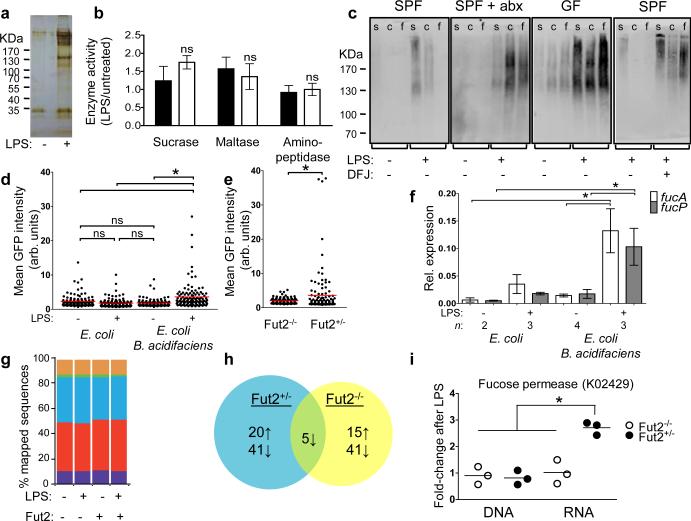
Systemic infection induces conserved physiological responses that include both resistance and 'tolerance of infection' mechanisms. Temporary anorexia associated with an infection is often beneficial, reallocating energy from food foraging towards resistance to infection or depriving pathogens of nutrients. However, it imposes a stress on intestinal commensals, as they also experience reduced substrate availability; this affects host fitness owing to the loss of caloric intake and colonization resistance (protection from additional infections). We hypothesized that the host might utilize internal resources to support the gut microbiota during the acute phase of the disease. Here we show that systemic exposure to Toll-like receptor (TLR) ligands causes rapid α(1,2)-fucosylation of small intestine epithelial cells (IECs) in mice, which requires the sensing of TLR agonists, as well as the production of interleukin (IL)-23 by dendritic cells, activation of innate lymphoid cells and expression of fucosyltransferase 2 (Fut2) by IL-22-stimulated IECs. Fucosylated proteins are shed into the lumen and fucose is liberated and metabolized by the gut microbiota, as shown by reporter bacteria and community-wide analysis of microbial gene expression. Fucose affects the expression of microbial metabolic pathways and reduces the expression of bacterial virulence genes. It also improves host tolerance of the mild pathogen Citrobacter rodentium. Thus, rapid IEC fucosylation appears to be a protective mechanism that utilizes the host's resources to maintain host-microbial interactions during pathogen-induced stress.


Figures

Extended Data Figure 1
Extended Data Figure 1. Requirements and kinetics for SI fucosylation induced by systemic injection of TLR ligands
a, Systemic injection of bacterial TLR ligands induces small intestine fucosylation, but simple starvation does not. UEA-1 staining (as in Fig. 1) after i.p. injection of CpG DNA, or Pam3CSK4, or food deprivation for 24 h of BALB/c SPF mouse. b, LPS injection causes SI fucosylation in various inbred mouse strains. SPF mice of the indicated strains were injected with LPS i.p. and SI was stained with UEA-1 after 24 hours, as in Fig. 1. Representative of at least 2 independent experiments. c, Fucosylation peaks at 8 h after LPS injection and is still detectable at 96 h. d, M cells can be readily detected by SEM and UEA-1 staining of the domes of the Peyer's patches, but are rare in the villi and are not massively induced in the villi by LPS injection. UEA-1 staining and SEM were performed on adjacent pieces from proximal 1/3 of SI. Scale bars=100 μm for UEA-1 staining, 50 μm for SEM images. Representative of at least 2 independent experiments. e, SI fucosylation does not require the presence of endogenous microbiota (LPS injection in GF mouse) and is not induced by oral administration of LPS (1 mg).
Extended Data Figure 2
Extended Data Figure 2. MyD88-dependent pathway for fucosylation of SI IECs in response to systemic stimulation of TLRs
a, FACS analysis of IECs from three segments of small intestine from the indicated mice. Cells are gated on the FSC/SSC high epithelial cell population. At least 2 mice per mutant genotype were stained along with two control mice in the experiments shown. b, SPF mice were pretreated with 20 mg streptomycin and orally infected with Salmonella typhimurium. SI was stained at 24 hours p.i. MyD88 expression was necessary in CD11c+ cells but not villin+ IECs for S. typhimurium-induced fucosylation.
Extended Data Figure 3
Extended Data Figure 3. A proposed model for the mechanisms linking inducible fucosylation to the gut microbiota
Systemic microbial agonists activate TLRs on CD11c+ DCs, causing secretion of the cytokine IL-23, which in turn stimulates RORγt-dependent innate lymphoid cells (ILCs) to secrete IL-22. IL-22 causes small intestine epithelial cells to upregulate the α(1,2)fucosyltransferase 2 enzyme (Fut2). Fucosylated proteins are either secreted into the lumen or expressed on the cell surface and later shed into the lumen. Fucosidase-expressing bacteria (blue) liberate fucose residues, which they can utilize and share with other bacteria lacking the fucose-cleaving enzyme. Bacterial metabolism of fucose potentially produces metabolites such as SCFAs. Fucose also directly or indirectly downregulates virulence gene expression by pathobionts (red) or bona fide pathogens.
Extended Data Figure 4
Extended Data Figure 4. Consequences of LPS injection in Fut2-sufficient and Fut2-deficient BALB/c mice
a, Inflammatory cytokines IL-1β, IL-6 and TNF-α were measured by ELISA in sera of mice before or 2 h after injection with LPS (4 h for IL-1β). abx, mice on antibiotic water for 2 days prior to injection. Bars are mean±s.e.m.; n.d., not detected. b, Expression of RegIIIγ (also regulated by the MyD88-IL23-IL22 pathway). Measurement by qPCR of reg3g gene expression in mid-SI tissue, relative to gapdh (ddCt method). Numbers indicate mean fold change±s.e.m. in LPS-treated vs. untreated mice. Differences between LPS-treated Fut2+ and abx or Fut2 levels are not significant (P>0.05, two-tailed Student's t test). c, Weight loss and recovery is not different in Fut2+/− and Fut2−/− mice after simple starvation (mean±s.e.m., P>0.05 at all time points, two-tailed Student's t test). d, Lack of direct toxic effect of antibiotics (abx) measured as the weight loss of BALB/c GF animals treated with LPS i.p (mean±s.e.m., P>0.05 by two-tailed Student's t test at all timepoints). e-g, Similar total bacterial loads in Fut2+/− and Fut2−/− mice before and after LPS injection and antibiotic treatment. Total bacterial loads in feces were estimated by plating on aerobic (e) and anaerobic (f) non-selective media, and by quantitative PCR for 16S gene copies (g). There were no significant differences between Fut2-sufficient (filled circles) and Fut2-deficient (open circles) mice before or after LPS treatment (two-tailed Student's t test). Circles - individual mice. Horizontal lines - means. Red circles- antibiotic-treated mice.
Extended Data Figure 5
Extended Data Figure 5. Fucosylated protein in IECs and gut contents
a, Proteins α(1,2)fucosylated in IECs after LPS injection identified by UEA-1 precipitation and mass spectrometry. Abundance is the number of peptide fragments attributed to each gene. b, IECs from Fut2+ untreated, Fut2+ LPS-treated, or Fut2 untreated mice were isolated, and lysates separated by SDS-PAGE. α(1,2)fucosylated proteins were detected by blotting with UEA-1 lectin conjugated to HRP. c, Identical gel stained with Coomassie blue for total protein content. d, Relative density of the boxed area of each lane from b divided by the relative density in c. e, UEA-1 staining of luminal proteins as in Fig. 3c. Blot is overexposed to show absence of luminal fucosylated proteins in the LPS-treated, Fut2 mouse.
Extended Data Figure 6
Extended Data Figure 6. Generation of fucose-sensing reporter bacterial strains
a, Reporter E. coli were grown to stationary phase in minimal medium containing 10mM glucose and the indicated concentrations of L-fucose (* indicates promoterless vector), and GFP fluorescence was measured. b, Fucosidase activity is dramatically reduced after 2 days of antibiotics (abx) treatment but recovers after cessation of treatment. Measurement of total α-L-fucosidase activity in feces. Fecal supernatant was assayed for cleavage of 4-methylumbelliferyl-fucopyranoside substrate by fluorescence. n = 5 SPF abx-treated, 3 GF mice. c, Fecal homogenates were plated anaerobically on BHIS agar containing 5-bromo-4-chloro-3-indolyl α-L-fucopyranoside, which forms a blue precipitate upon cleavage of the fucosyl residue. Both blue and white colonies are present. d, Pure cultures of Bacteroides species were streaked on the same medium as in c. B. uniformis (left) is not predicted to carry an α-L-fucosidase gene, and remains white; B. acidifaciens (middle) and B. thetaiotaomicron (right) both express fucosidase activity and develop blue colonies. e, Loss of B. acidifaciens from the feces of mice treated with antibiotics (Abx) in water (PCR for the gyrB gene). C-, water control. C+, B. acidifaciens genomic DNA. f, Summary of reporter E. coli experiments in SPF mice (representative experiment is shown in Fig. 3e). Points are mean GFP fluorescence from all reporter bacteria measured in each of 3 independent experiments (n = 65 bacteria per mouse; *P<0.05, Student's t test).
Extended Data Figure 7
Extended Data Figure 7. Microbial community structure is impacted by co-housing yet robust to host fucosylation and LPS exposure, whereas microbial gene expression depends on Fut2
a, Stable relative abundance of bacterial phyla across treatment groups and genotypes, as indicated by 16S rRNA gene sequencing. Values represent the mean abundance of phyla found at >1% relative abundance in at least one sample. b, Unweighted UniFrac analysis of the gut microbiota of Fut2-deficient (no outline) and Fut2-sufficient (black outline) mice. Points are colored based on kinship and labeled by timepoint (before or after LPS exposure). Results are based on 180,000 randomly selected 16S rRNA gene sequences/sample. c, Microbial diversity as measured by the Shannon Diversity Index (n = 178,100 sequences/sample). Values are mean±s.e.m. (n = 3 Fut2+, 4 Fut2 mice/timepoint). d, KEGG modules and pathways expressed in microbiota at higher levels after LPS exposure in Fut2-positive (left) and Fut2-negative mice (right) (n = 3/group; Humann/LefSe analysis; LDA>2).
Extended Data Figure 8
Extended Data Figure 8. Lack of indicible fucosylation and SI colonization in C rodentium infected mice
a, C. rodentium causes no SI fucosylation in SPF mice at day 3, day 7, or day 12 p.i. b, SI colonization by C. rodentium is low regardless of Fut2 expression and LPS treatment. SI contents were removed by gentle squeezing, homogenized in PBS, and plated. Means±s.e.m; n = 4. Dotted line shows the limit of detection.
Extended Data Figure 9
Effect of exogenous fucose on cecal short-chain fatty acid (SCFA) levels. Cecal SCFAs were measured after gavaging starved mice with the indicated sugars (100 mM concentration). Fucose gavage leads to increased propionate production in SPF but not GF mice. Means±s.e.m.; **P<0.01, Student's two-tailed t test.
Figure 1
Figure 1. MyD88-dependent fucosylation of SI IECs by systemic stimulation of TLRs
All panels: Ulex europaeus Agglutinin 1(UEA-1, binds α(1,2)-fucosylated substrates) staining in the proximal 1/3 of SI of mice untreated or 24 hours after i.p. LPS injection, or 6 hours after injection of IL-22 (MyD88−/− mouse). Scale bars=100 μm. Staining of tissue from mutant mice was always accompanied by staining of wild-type controls, and is representative of at least two independent experiments for each genotype.
Figure 2
Figure 2. Consequences of the loss of Fut-2-dependent fucosylation
a, Expression of mouse α(1,2)fucosyltransferase genes (Fut2, Fut1 and Sec1) and control villin-encoding gene, vil1 in the gut (cec, cecum; col, colon) 24 hours after LPS injection (semi-quantitative RT-PCR). b, Intestinal fucosylation (green) of Fut2-sufficent and -deficient mice. Red, propidium iodide. Scale bars=100 μm. c, FACS histograms of SI IECs from PBS (left) or LPS-injected (right), Fut2+ (top) or Fut2 (bottom) mice. d, Food consumption in LPS-treated Fut2+ (n=5, black bars) and Fut2 mice (n=3, open bars) (mean±s.e.m.) Representative of 3 experiments. e, Dependence of weight recovery after LPS challenge on the presence of microbiota and expression of Fut2 (mean±s.e.m. of percent of starting body weight, data combined from 4 experiments). *P<0.05, one-way ANOVA. abx, antibiotics (ampicillin and vancomycin).
Figure 3
Figure 3. Commensals utilize fucose detached from proteins fucosylated by Fut2 upon systemic challenge with LPS
a, Silver-stained SDS-PAGE of UEA-1-precipitated SI IEC protein from control or LPS-treated mouse. b, Ratios of digestive enzymes activities in SI IECs of LPS-treated to untreated Fut2-sufficient (black bars) or Fut2-deficient (open bars) mice two days after LPS injection. Mean±s.e.m. of 4 combined experiments, 4 mice/group. c, SDS-PAGE of intestinal contents blotted on nitrocellulose and stained with UEA-1-peroxidase complexes. s, SI; c, cecum; f, feces; abx, antibiotic treated mice; DFJ, deoxyfuconojirimycin. d, e, Fucose-sensitive GFP reporter expression in gnotobiotic mice colonized with the indicated strains (d, ) or SPF mice (e). Dots are values for individual bacteria, lines are means, n=120; *P<0.05 [one-way ANOVA with Bonferroni post-test (d), two-tailed Student's t test (e)]; representative of 3 independent experiments. f, fucA and fucP gene expression relative to housekeeping gene rpoA (Quantitative RT-PCR) in E. coli tested as in d. *P<0.05 by ANOVA with Bonferroni's post-test. g, Stable relative abundance of bacterial phyla across treatment groups and genotypes, as indicated by shotgun sequencing of community DNA. Phyla with a mean RPKM (reads per kilobase per million mapped reads) >40,000 are shown including Actinobacteria (purple), Bacteroidetes (red), Firmicutes (blue), Fusobacteria (green), Proteobacteria (orange), and Tenericutes (yellow). 16S rRNA gene sequencing confirms these observations. Extended Data Fig. 7 shows 16S rRNA gene sequencing results. h, Differentially expressed KEGG orthologous groups following LPS treatment (paired glm edgeR analysis; q<0.05, >2-fold change; see Supplemental Information Table 2 for complete list). i, Increased gut microbial expression of fucose permease (fucP; KO2429) in Fut2-sufficient mice (mean±s.e.m.; *P<0.01, Mann-Whitney test).
Figure 4
Figure 4. Host fucosylation increases tolerance of a pathogen
a, Difference in % weight loss between LPS-injected C. rodentium-infected and uninfected mice (mean±s.e.m.; *P=0.01 ***P=0.0001, two-tailed Student's t test; combined from 6 experiments). b, Fecal CFUs of C. rodentium from Fut2+ or Fut2 mice (mean±s.e.m., data combined from 6 experiments). c, Luminescence of thoroughly washed mid-colon of mice infected with pler-lux+ C. rodentium. n=4 for d12 and 8 for d7; mean±s.e.m. d, Average crypt depth in uninfected (n=3) or infected mice (n=4) at day 12 p.i., with or without LPS injection on day 4 p.i., mean±s.e.m.. In a-d black bars and circles – Fut2-positive; open bars and circles – Fut2-negative mice. e, Representative hematoxylin/eosin staining of distal colon of LPS-treated mice at day 12 p.i. Scale bars=100 μm. Bottom row - magnified boxed regions.

Comment in

References

    1. Ayres JS, Schneider DS. Tolerance of infections. Annu Rev Immunol. 2012;30:271–294. doi:10.1146/annurev-immunol-020711-075030. - PubMed
    1. Ayres JS, Schneider DS. The role of anorexia in resistance and tolerance to infections in Drosophila. PLoS biology. 2009;7:e1000150. doi:10.1371/journal.pbio.1000150. - PMC - PubMed
    1. Murray MJ, Murray AB. Anorexia of infection as a mechanism of host defense. Am J Clin Nutr. 1979;32:593–596. - PubMed
    1. Kyriazakis II, Tolkamp BJ, Hutchings MR. Towards a functional explanation for the occurrence of anorexia during parasitic infections. Animal behaviour. 1998;56:265–274. doi:10.1006/anbe.1998.0761. - PubMed
    1. Exton MS. Infection-induced anorexia: active host defence strategy. Appetite. 1997;29:369–383. doi:10.1006/appe.1997.0116. - PubMed

Publication types

MeSH terms

Associated data