. 2015 May 1;10(5):e0123263.
doi: 10.1371/journal.pone.0123263. eCollection 2015.

Overlapping DNA methylation dynamics in mouse intestinal cell differentiation and early stages of malignant progression

Affiliations

Overlapping DNA methylation dynamics in mouse intestinal cell differentiation and early stages of malignant progression

Marta Forn et al. PLoS One. .

Abstract

Mouse models of intestinal crypt cell differentiation and tumorigenesis have been used to characterize the molecular mechanisms underlying both processes. DNA methylation is a key epigenetic mark and plays an important role in cell identity and differentiation programs and cancer. To get insights into the dynamics of cell differentiation and malignant transformation we have compared the DNA methylation profiles along the mouse small intestine crypt and early stages of tumorigenesis. Genome-scale analysis of DNA methylation together with microarray gene expression have been applied to compare intestinal crypt stem cells (EphB2high), differentiated cells (EphB2negative), ApcMin/+ adenomas and the corresponding non-tumor adjacent tissue, together with small and large intestine samples and the colon cancer cell line CT26. Compared with late stages, small intestine crypt differentiation and early stages of tumorigenesis display few and relatively small changes in DNA methylation. Hypermethylated loci are largely shared by the two processes and affect the proximities of promoter and enhancer regions, with enrichment in genes associated with the intestinal stem cell signature and the PRC2 complex. The hypermethylation is progressive, with minute levels in differentiated cells, as compared with intestinal stem cells, and reaching full methylation in advanced stages. Hypomethylation shows different signatures in differentiation and cancer and is already present in the non-tumor tissue adjacent to the adenomas in ApcMin/+ mice, but at lower levels than advanced cancers. This study provides a reference framework to decipher the mechanisms driving mouse intestinal tumorigenesis and also the human counterpart.


Conflict of interest statement

Competing Interests: The authors have declared that no competing interests exist.

Figures

Fig 1
Fig 1. Simplified scheme of the experimental design to identify differential DNA methylation in intestinal cell differentiation and cancer.
Setting A examines changes related with cell differentiation processes and early stages of intestinal cancer. Setting B allows the identification of differences between the large intestine and the CT26 colon cancer cell line representing advanced stages of cancer progression. Illustration of the intestinal epithelium is based on schemes published in reference [82].
Fig 2
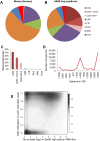
Fig 2. Genomic representativeness of AIMS-Seq.
A, Mouse genome composition according to the different genetic elements considered. B, Relative distribution of AIMS-Seq amplicons in the mouse genome. C, Coverage of genetic elements by AIMS-Seq amplicons. D, Distribution of AIMS-Seq amplicons regarding its distance to the transcription start site (TSS) of the closest gene. E, Density distribution of AIMS-Seq amplicons according to the number of reads detected in ISCs compared with the beta values of the amplicon flanking CpGs determined in Lgr5+ cells analyzed by WGBS (data from reference [25]).
Fig 3
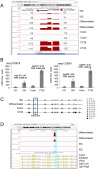
Fig 3. AIMS-Seq analysis.
A, Distribution of normalized reads obtained by AIMS-Seq in the genomic region neighboring the Slitrk1 gene. Amplicons amp133978 and amp133981 are indicated by arrows and the number of reads mapped in each one is shown next to the peak in four types of cells (ISC, differentiated, colon and CT26 cells) analyzed in duplicate. B, Both amplicons showed statistically significant differences according to the defined criteria (see Material and methods) in the comparison ISC vs. Differentiated cells and normal colon vs. CT26 cells. The logarithm of the fold change (log2FC) and the false discovery rate (FDR) are indicated for two comparisons between samples. C, Methylation profile of CpGs surrounding the XmaI site of amp133978 in four samples. The profile was represented using the Methylation plotter tool [83] and the methylation level of each CpG (beta value) is represented by a grey scale lollipop from white (unmethylated) to black (fully methylated) according to the scale. Sticks represent CpGs not determined. The CpG corresponding to the 3’ XmaI site is boxed. D, Comparison of the differential methylation detected by AIMS-Seq in ISC and differentiated cells with data generated by WGBS in related samples. Note the progressive increase of methylation from intestinal stem cells (Lgr5+) to more differentiated states. WGBS data were obtained from references [25,42].
Fig 4
Fig 4. Distribution of differentially methylated AIMS-Seq amplicons.
A, The results of five different comparisons (as illustrated in Fig 1) are distributed in rows. MA plots show the log2 ratio of the number of normalized reads per amplicon in the indicated comparisons. B, Relative distribution (% of the AIMS-Seq virtual universe) of hypermethylations (red) and hypomethylations according to different genomic features regarding gene context (UTR, exons, introns, junction exons/introns), genome element (CpG island, CpG island shore, LINE, SINE, LTR and non classified elements) and distance to transcription start site (TSS).
Fig 5
Fig 5. Differentially methylated domains in Differentiated-ISC and Adenoma-ISC comparisons.
Four examples are illustrated. Each track corresponds to the number of normalized reads in the AIMS-seq for each sample. Highlighted regions indicate domains larger than 50 kb and with at least 5 amplicons showing differential methylation between samples. R4 and R7 domains are hypermethylated in differentiated and adenoma cells versus ISCs. R10 and R12 domains are hypomethylated in adenoma cells versus ISCs and differentiated cells.
Fig 6
Fig 6. Differential gene expression.
A, Diagram of the gene expression analyses performed by microarrays. Comparisons are denoted by connecting lines. The number of genes overexpressed in the sample pointed by the arrowhead is indicated next to the connecting line. B, Overlapping of genes differentially expressed in different pair of samples. C, Semantic representation of biological processes enriched in genes overexpressed in adenomas and CT26 cells compared with the respective normal tissue. The graph was generated with Revigo [84]. Bubble size indicates the-log10 of the FDR (see Table K in S2 File for details).

References

    1. Booth C, Potten CS. Gut instincts: thoughts on intestinal epithelial stem cells. J Clin Invest. 2000;105: 1493–1499. - PMC - PubMed
    1. Barker N, Ridgway RA, van Es JH, van de Wetering M, Begthel H, van den Born M, et al. Crypt stem cells as the cells-of-origin of intestinal cancer. Nature. 2009;457: 608–611. 10.1038/nature07602 - DOI - PubMed
    1. Sato T, Vries RG, Snippert HJ, van de Wetering M, Barker N, Stange DE, et al. Single Lgr5 stem cells build crypt-villus structures in vitro without a mesenchymal niche. Nature. 2009;459: 262–265. 10.1038/nature07935 - DOI - PubMed
    1. Buczacki SJ, Zecchini HI, Nicholson AM, Russell R, Vermeulen L, Kemp R, et al. Intestinal label-retaining cells are secretory precursors expressing Lgr5. Nature. 2013;495: 65–69. 10.1038/nature11965 - DOI - PubMed
    1. Jung P, Sato T, Merlos-Suarez A, Barriga FM, Iglesias M, Rossell D, et al. Isolation and in vitro expansion of human colonic stem cells. Nature Medicine. 2011;17: 1225–1227. 10.1038/nm.2470 - DOI - PubMed

Publication types

Associated data