. 2015 Dec 3;528(7580):142-6.
doi: 10.1038/nature15740.

Genome-wide detection of DNase I hypersensitive sites in single cells and FFPE tissue samples

Affiliations

Genome-wide detection of DNase I hypersensitive sites in single cells and FFPE tissue samples

Wenfei Jin et al. Nature. .

Abstract

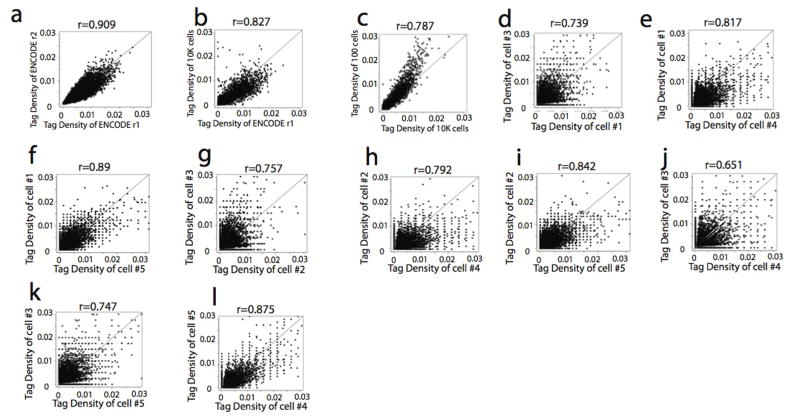
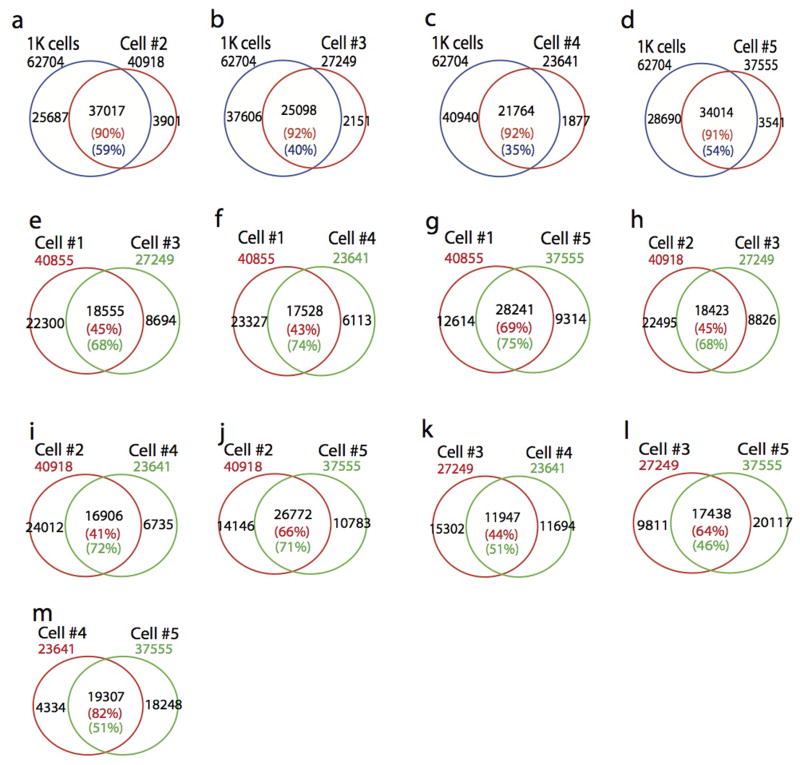
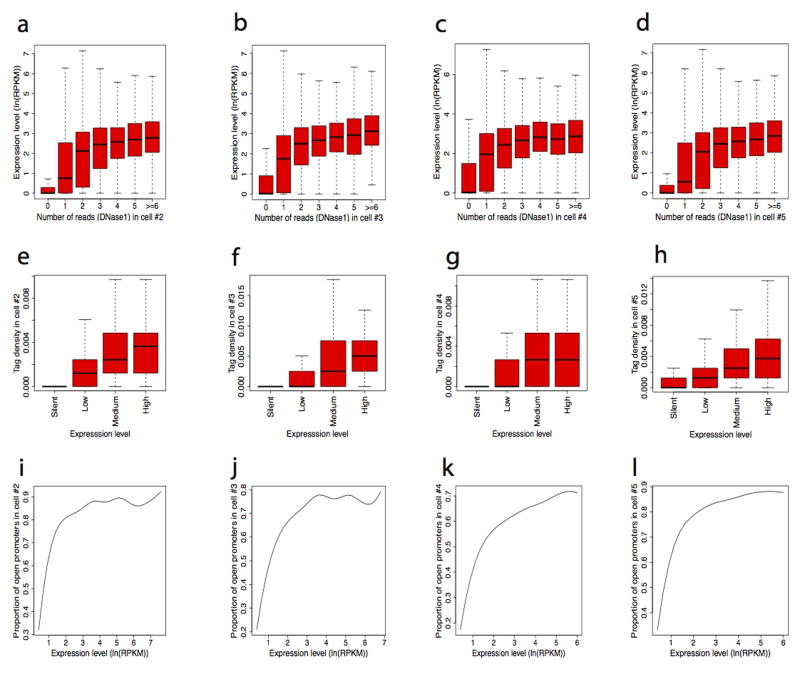
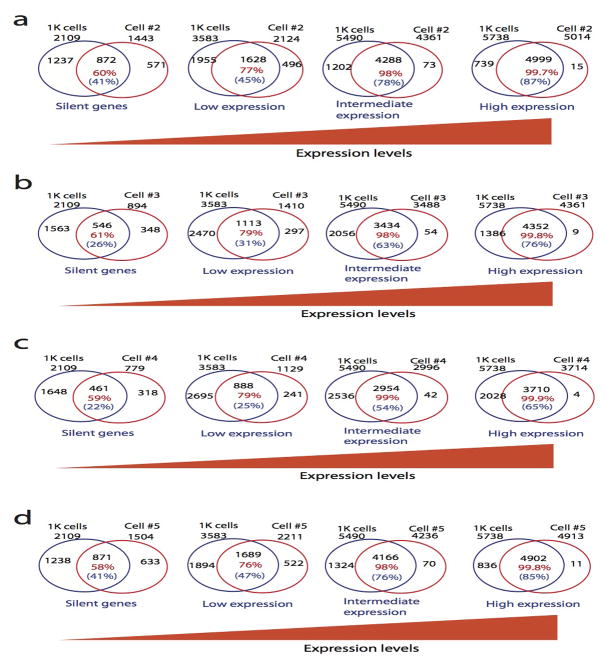
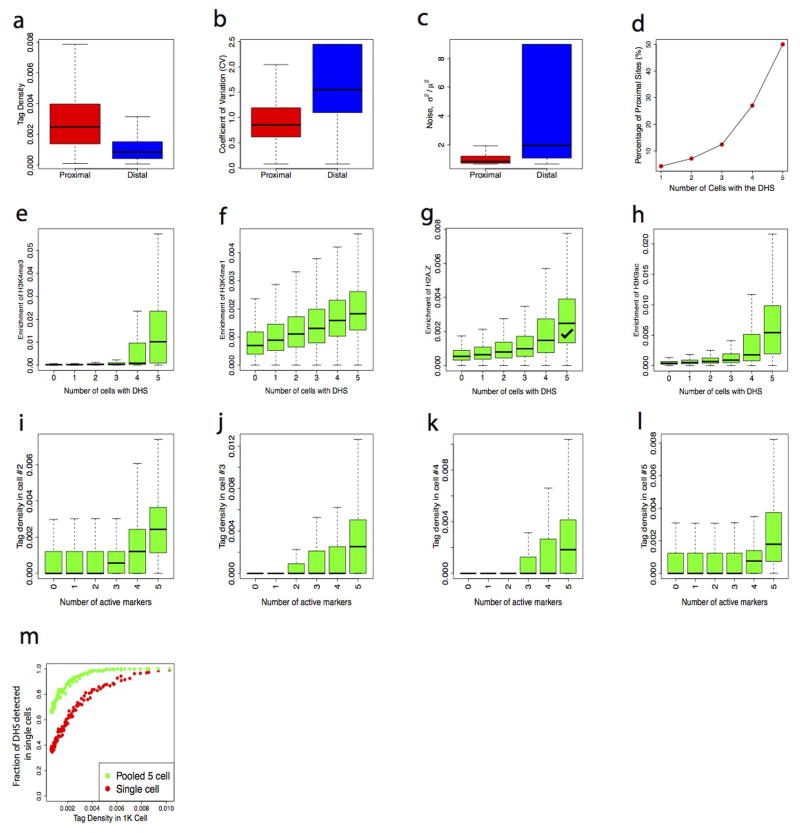
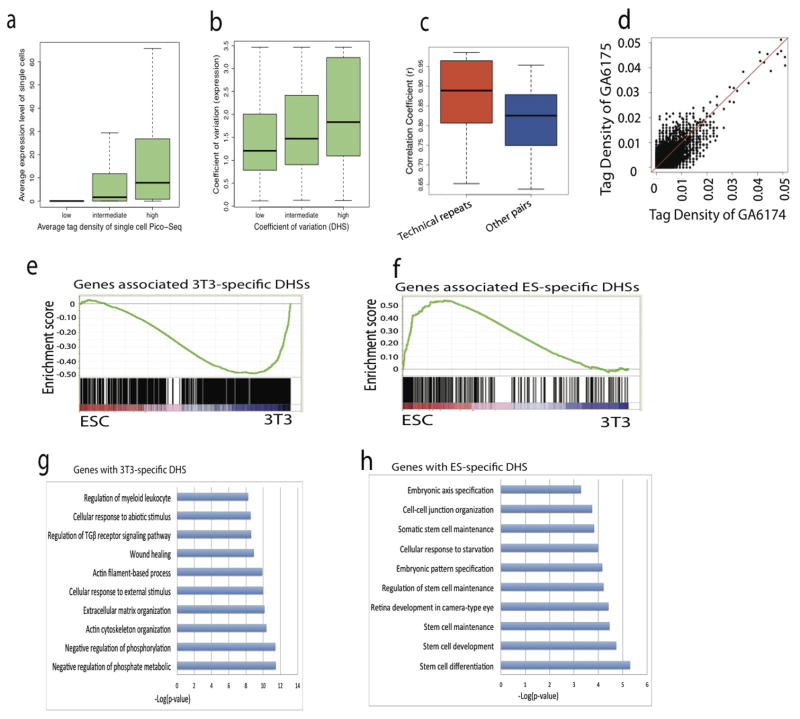
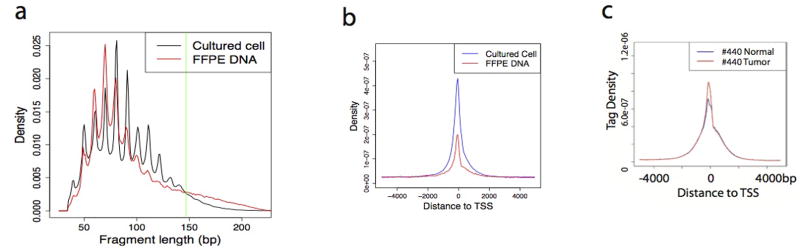
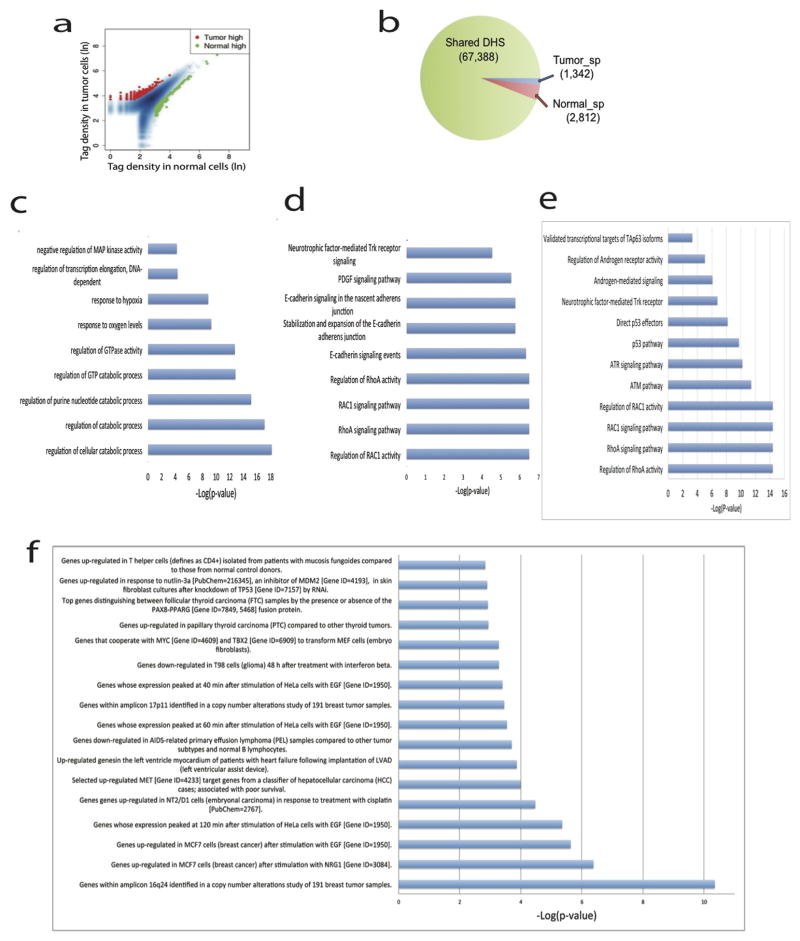
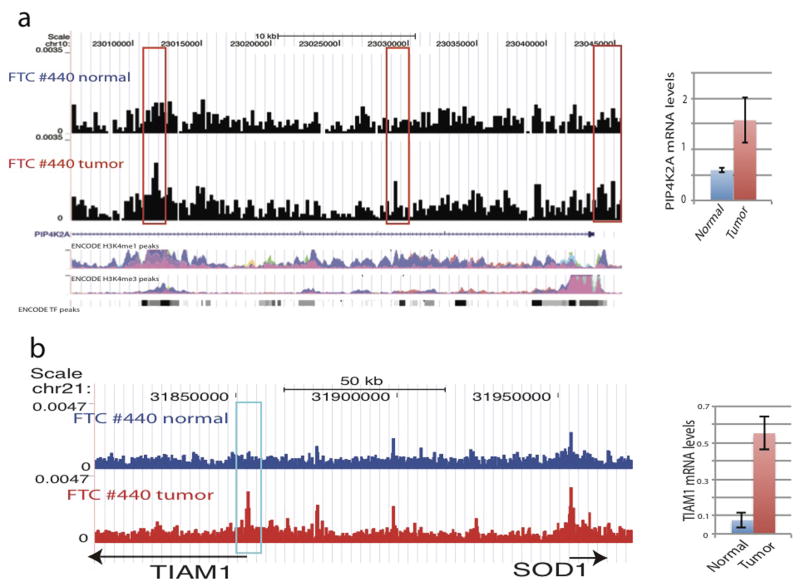
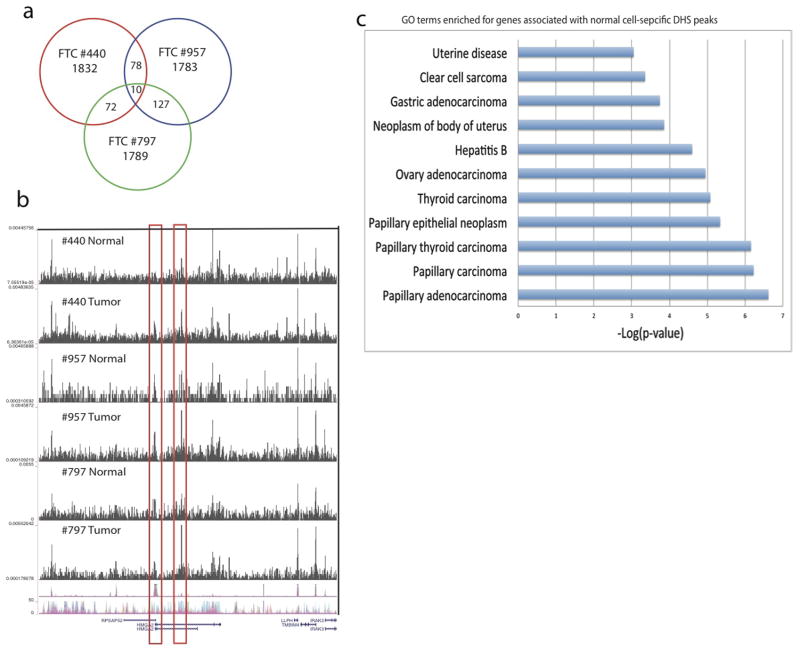
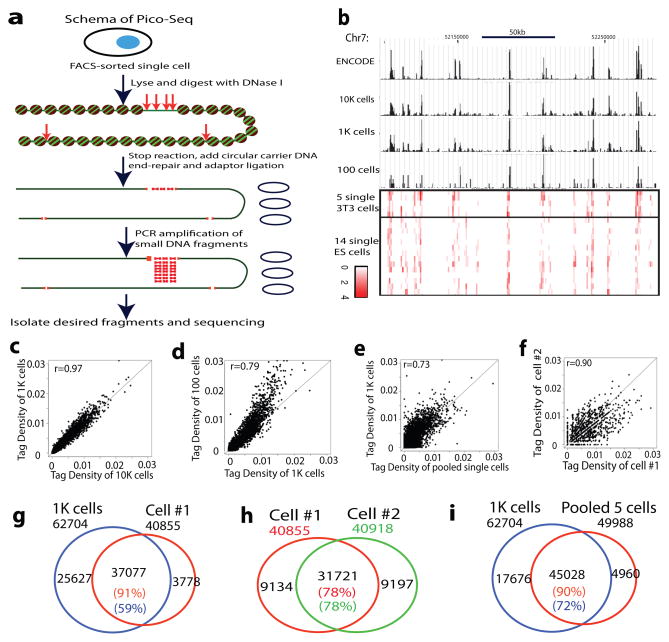
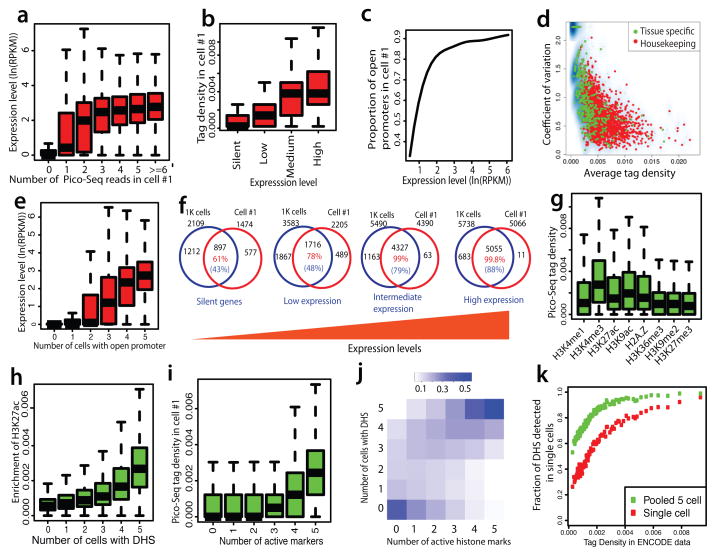
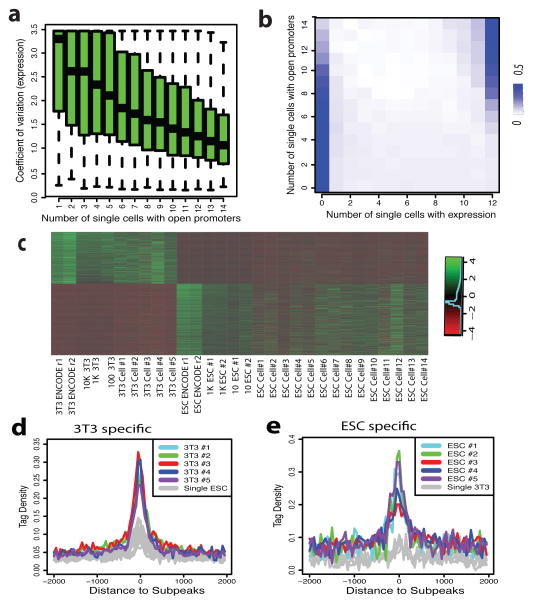
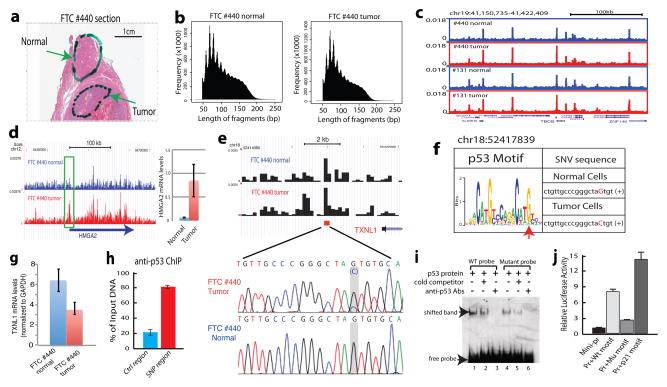
DNase I hypersensitive sites (DHSs) provide important information on the presence of transcriptional regulatory elements and the state of chromatin in mammalian cells. Conventional DNase sequencing (DNase-seq) for genome-wide DHSs profiling is limited by the requirement of millions of cells. Here we report an ultrasensitive strategy, called single-cell DNase sequencing (scDNase-seq) for detection of genome-wide DHSs in single cells. We show that DHS patterns at the single-cell level are highly reproducible among individual cells. Among different single cells, highly expressed gene promoters and enhancers associated with multiple active histone modifications display constitutive DHS whereas chromatin regions with fewer histone modifications exhibit high variation of DHS. Furthermore, the single-cell DHSs predict enhancers that regulate cell-specific gene expression programs and the cell-to-cell variations of DHS are predictive of gene expression. Finally, we apply scDNase-seq to pools of tumour cells and pools of normal cells, dissected from formalin-fixed paraffin-embedded tissue slides from patients with thyroid cancer, and detect thousands of tumour-specific DHSs. Many of these DHSs are associated with promoters and enhancers critically involved in cancer development. Analysis of the DHS sequences uncovers one mutation (chr18: 52417839G>C) in the tumour cells of a patient with follicular thyroid carcinoma, which affects the binding of the tumour suppressor protein p53 and correlates with decreased expression of its target gene TXNL1. In conclusion, scDNase-seq can reliably detect DHSs in single cells, greatly extending the range of applications of DHS analysis both for basic and for translational research, and may provide critical information for personalized medicine.


Figures

Extended Data Fig. 1
Extended Data Fig. 1. Scatter plots showing the high correlation of DHSs detected in a small number of cells or single cells
Each dot represents the tag density of one DHS or more DHSs with the same value. a–c, Correlation of DHS between ENCODE data and small cell number libraries. d–i, Correlation of DHSs between the 5 single cells.
Extended Data Fig. 2
Extended Data Fig. 2. Venn diagrams showing DHSs detected in single cell significantly overlap with that detected in 1000-cells or the other single cells
The total number of DHSs in each library was indicated outside of the Venn diagrams. a–d, Overlapping DHSs between single cell and 1000-cells data. e–m, Overlapping DHSs between two single cells.
Extended Data Fig. 3
Extended Data Fig. 3. Detectability of single cell DHSs at promoters is positively correlated with gene expression
a–d, Detection of DHSs around TSSs is correlated with higher gene expression in each single cell. Genes were sorted according to the number of Pico-Seq reads within −/+ 1Kb region of TSSs and plotted against their expression on Y-axis. e–h, Pico-Seq tag density is positively correlated with gene expression in each single cell. Genes were sorted to four groups according to their expression levels. Box plots show Pico-Seq tag density around TSSs (Y-axis). i–l, The proportion of open promoters detected by Pico-Seq in each single cell is positively correlated with gene expression.
Extended Data Fig. 4
Extended Data Fig. 4. The DHSs on the promoter of highly expressed genes are more reproducible
The percentage of overlapping between DHSs detected in 1K cells and each single cell positively correlated with gene expression. The total number of silent genes, lowly expressed, intermediately expressed and highly expressed genes showing DHSs were indicated outside of the Venn diagrams. The numbers in red indicate that percentages of DHSs detected in a single cell that overlapped with the DHSs detected in 1K cells.
Extended Data Fig. 5
Extended Data Fig. 5. The high variations of distal DHSs and detectability of single-cell DHSs correlated the number of active histone modifications
a–d, Distal DHSs showing lower tag density and higher variation than that of proximal DHSs among single cells. The average tag densities of the proximal DHSs among single cells are higher than that of distal DHSs (a). The proximal DHSs showed much higher variation (b) and noise (c) compared with that of distal DHSs. The fraction of proximal DHSs highly correlated with the number of cells with the DHSs (d). e–h, The histone modification levels (H3K4me3, H3K4me1, H3K9ac and H2A.Z) correlated with the detectability of DHSs in single cells. Histone modification peaks were sorted according to the number of single cells where they were detected by Pico-Seq. The active histone modification enrichment levels of each group are displayed using Box plots. i–l, The Pico-Seq density in each NIH3T3 single cell positively correlated with the number of active histone modifications at the DHS. Tag density of each Pico-Seq was sorted according to the number of histone modifications measured on a population of cells using ChIP-Seq. The Pico-Seq tag densities for each group are shown by Box plots. m, The DHS detectability in single cells is correlated with the tag density of DHS peaks in the 1000 cells library. The DHSs obtained from the 1000 cells library were binned to 100 groups based on the tag density (or peak height) (x-axis). Y-axis indicates the fraction of DHS detected in a single cell or pooled 5 single cell Pico-Seq libraries for each bin.
Extended Data Fig. 6
Extended Data Fig. 6. Biological variations contributed to cell-to-cell variation and DHSs detected in single-cell Pico-Seq can predict cell-type specific enhancers
a–b, Single cell chromatin accessibilities and single cell gene expressions are positively correlated. Average (a) and variation (b) of tag density in single cell Pico-Seq at gene promoters correlated with that of gene expression level in single cells, respectively. c–d, Biological variations contributed to cell-to-cell variations because correlation coefficient between technical repeats are significantly higher than that of other pairs of libraries (non-technical repeat pairs). Two NIH3T3 cells were sorted into one tube, which were digested with DNase I and then split to two tubes. Thus each tube contained the amount of DNA that should be similar to that of one cell. By doing this, the two libraries prepared using the two tubes could be treated as technical repeats. Correlations coefficient between technical repeats are higher than that of other pairs of libraries(c). Scatter plot of a pair of technical repeat (d). e–f, Genes associated with NIH3T3-specific DHSs and ESC-specific DHSs correlated with NIH3T3 and ESC specific expressed genes, respectively. g–h, Genes associated with NIH3T3-specific DHS or ESC-specific DHSs are enriched in distinctive gene ontology terms.
Extended Data Fig. 7
Extended Data Fig. 7. The Pico-Seq libraries for FFPE tissues slide showing expected patterns
a, DNA fragments of the Pico-Seq libraries from both cultured cells and FFPE tissues showed periodical cut patterns expected from DNase I digestion of nucleosomal DNA. b, The Pico-Seq reads from both cultured cells and FFPE tissues are enriched around TSSs. c. The reads enrichments around TSS of FTC #440 normal and FTC #440 tumor are similar.
Extended Data Fig. 8
Extended Data Fig. 8. Tumor specific DHS in FTC #440 enriched GO terms and pathways
a–b, Normal-specific and tumor-specific DHSs account a small fraction of the total DHS. c, GO biological process terms significantly enriched in the tumor specific DHS. d, Pathways significantly enriched in the tumor specific DHS. e, Pathways significantly enriched in the tumor specific DHS with relaxed threshold. f, Gene sets that represent gene expression signatures of genetic and chemical perturbations significantly enriched in tumor specific DHS.
Extended Data Fig. 9
Extended Data Fig. 9. Tumor-specific DHSs are correlated with increased expression in the tumor cells
a, Genome Browser image showing the increased chromatin accessibility of two tumor-specific DHS regions at the PIP4K2A gene locus (left panel). The ENCODE H3K4me1 and H3K4me3 peaks are shown at the bottom of the panel. The PIP4K2A mRNA levels in normal and tumor cells, respectively, determined by quantitative RT-PCR and normalized to GAPDH (Right panel). b, Genome Browser image showing the increased chromatin accessibility of the TIAM1 promoter in thyroid tumor cells (left panel). TIAM1 mRNA levels in normal and tumor cells, respectively, determined by quantitative RT-PCR and normalized to GAPDH (Right panel).
Extended Data Fig. 10
Extended Data Fig. 10. The tumor-specific DHSs in each individual usually are unique
a, The vast majority of DHSs are unique to each individual tumor case. b, Genome Browser image showing the two tumor-specific DHSs at the HMGA2 locus in three FTC patients. c, The normal cell-specific DHSs are enriched in multiple disease ontologies in PTC #131.
Figure 1
Figure 1. Genome-wide detection of DNase I hypersensitive sites of single cells using Pico-Seq
a. Schema of Pico-Seq. FACS-sorted single cells were digested with DNase I, followed by end-repair, adaptor ligation, PCR amplification in the presence of circular carrier DNA and sequencing. b. Genome Browser displays showing the DHS in ENCODE data and Pico-Seq data (black tracks). The red tracks show Pico-Seq read densities in DHSs of 5 single NIH3T3 cells and 14 single mouse ES cells. c–f. Scatter plots showing the tag density correlation of DHSs between two libraries. Each dot represents one or more DHSs. g–i. Venn diagrams showing the significant overlaps of DHSs between two libraries.
Figure 2
Figure 2. Detectability of single-cell DHSs is positively correlated with gene expression and number of active histone modifications
a. Number of tags within −/+ 1Kb of TSSs correlated with higher gene expression in single cell #1. b. Pico-Seq tag density in single cell #1 is positively correlated with gene expression in a population of cells. c. The proportion of open promoters detected by Pico-Seq in single cell #1 is positively correlated with gene expression. d. Housekeeping genes (red) show higher tag density and lower variation than tissue-specific genes (green). e. Genes with open promoter in more single cells are associated with higher expression levels. f. The percentage of overlaps between DHSs detected in 1K NIH3T3 cells and single cell #1 positively correlated with gene expression. The total number of genes with DHSs for each group was indicated outside of the Venn diagrams. The number in red indicate that percentages of DHSs detected in single cell #1 that overlapped with the DHSs detected in 1K cells. g. Active histone modifications (H3K4me1, H3K4me3, H3K9ac, H3K27ac and H2A.Z) are associated with higher Pico-Seq tag density than the repressive H3K27me3 and H3K9me2 modifications in single cells. h. The H3K27ac level effectively predicts the detectability by Pico-Seq. i. The Pico-Seq density in cell #1 correlated with the number of histone active modifications. j. The detection of DHSs across multiple single cells is positively correlated with the number of histone modifications. k. The DHS detectability in single cells is correlated with the tag density of DHS peaks in the ENCODE data.
Figure 3
Figure 3. Single-cell Pico-Seq DHS data can predict cell-specific enhancers
a. Genes with DHS in fewer single cells (x-axis) exhibit much higher variation of gene expression across different single cells (y-axis). b. Genes with DHS in fewer single cells (y-axis) are expressed in fewer single cells (x-axis). c. The NIH3T3-specific and ESC-specific DHSs identified in single cells showed expected cell specificity in all libraries. d. The subpeaks of NIH3T3-specific super-enhancers showing much higher tag density in NIH3T3 cells than that in ES cells. e. The subpeaks of ESC-specific super-enhancers showing much higher tag density in ES cells than that in NIH3T3 cells.
Figure 4
Figure 4. Application of Pico-Seq to FFPE patient tissue sections reveals novel pathophysiological information on thyroid cancers
a. A full view of a Hematoxylin and Eosin stained slide of FTC #440. Cells recovered from the highlighted areas were subject to Pico-Seq analysis. b. Typical periodic DNase cleavage patterns of nucleosomes were detected for both the normal and tumor cells by Pico-Seq. c. Genome Browser image displaying the Pico-Seq profiles of the normal (blue) and tumor (red) cells from two thyroid carcinomas #440 and #131. d. Genome Browser image showing the increased chromatin accessibility of the HMGA2 promoter in the tumor cells of FTC #440 (left panel). qRT-PCR analysis shows the increased HMGA2 mRNA level in the tumor cells (right panel). e. A single nucleotide variation (SNV) was identified at a DHS near the 3′ end of the TXNL1 gene in the tumor cells of FTC #440. The SNV location is indicated by the red square. The SNV was confirmed by Sanger sequencing (highlighted region). f. The G to C change in tumor cells negatively impacts p53 target motif. The SNV in the p53 motif logo is indicated by a red arrowhead. g. The G to C change in the tumor cells is correlated with decreased expression of TXNL1 by qRT-PCR analysis. h. p53 is bound to the SNV region in a human thyroid cell line by ChIP-qPCR analysis. i. The G-to-C change decreases p53 binding affinity in vitro by gel shift assay. j. The G-to-C change reduces the activity of the p53 motif to activate a reporter promoter in vivo. The p53 motif from the p21 promoter was used as a positive control.

Comment in

  • A single cell's open chromatin.
    Rusk N. Rusk N. Nat Methods. 2016 Jan;13(1):12-3. doi: 10.1038/nmeth.3724. Nat Methods. 2016. PMID: 27110626 No abstract available.

References

    1. Boyle AP, et al. High-resolution mapping and characterization of open chromatin across the genome. Cell. 2008;132:311–322. doi: 10.1016/j.cell.2007.12.014. - DOI - PMC - PubMed
    1. Thurman RE, et al. The accessible chromatin landscape of the human genome. Nature. 2012;489:75–82. doi: 10.1038/nature11232. - DOI - PMC - PubMed
    1. Sheffield NC, et al. Patterns of regulatory activity across diverse human cell types predict tissue identity, transcription factor binding, and long-range interactions. Genome Res. 2013;23:777–788. doi: 10.1101/gr.152140.112. - DOI - PMC - PubMed
    1. Song L, Crawford GE. DNase-seq: a high-resolution technique for mapping active gene regulatory elements across the genome from mammalian cells. Cold Spring Harb Protoc. 2010;2010 doi: 10.1101/pdb.prot5384. pdb prot5384. - DOI - PMC - PubMed
    1. John S, et al. Chromatin accessibility pre-determines glucocorticoid receptor binding patterns. Nat Genet. 2011;43:264–268. doi: 10.1038/ng.759. - DOI - PMC - PubMed

Publication types

MeSH terms

Associated data