. 2015 Jul 16;162(2):412-424.
doi: 10.1016/j.cell.2015.06.016.

Integrative Analyses of Human Reprogramming Reveal Dynamic Nature of Induced Pluripotency

Affiliations

Integrative Analyses of Human Reprogramming Reveal Dynamic Nature of Induced Pluripotency

Davide Cacchiarelli et al. Cell. .

Abstract

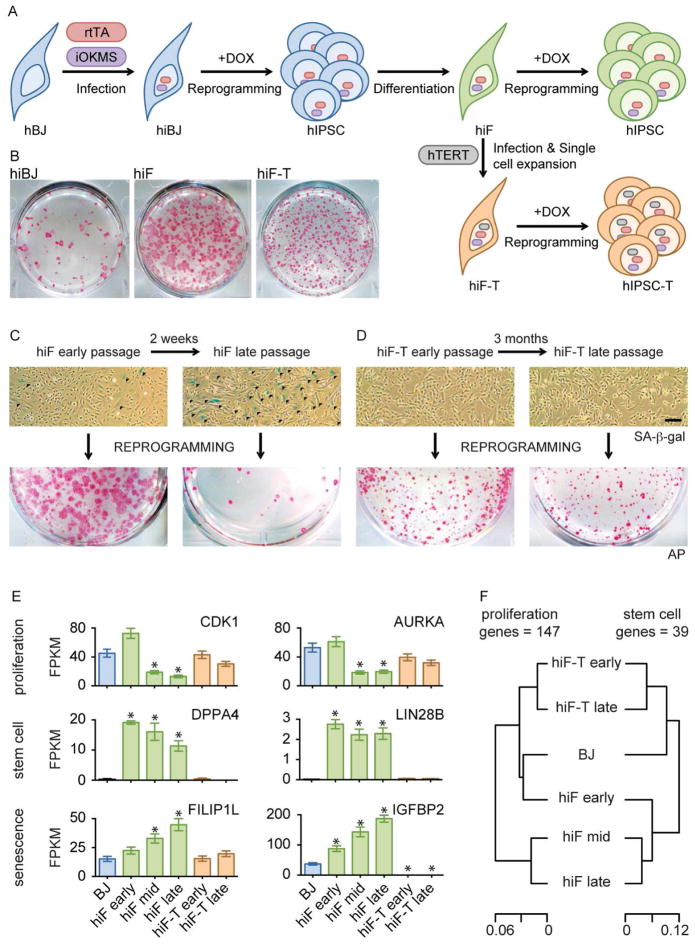
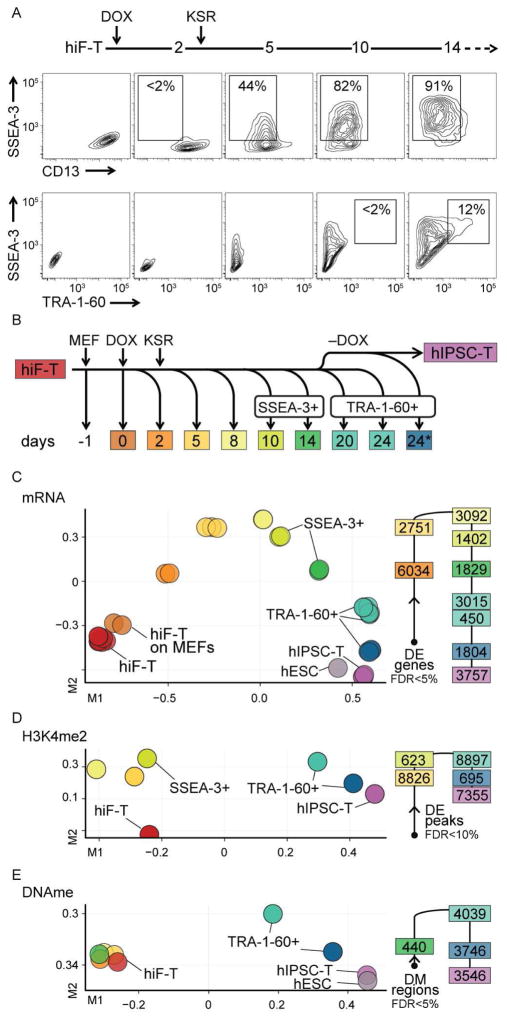
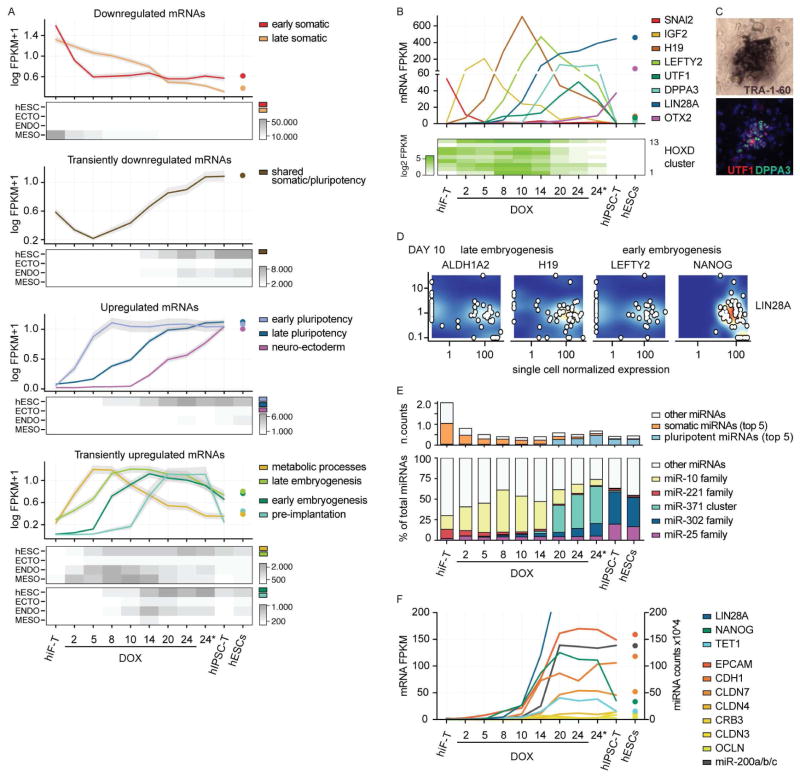
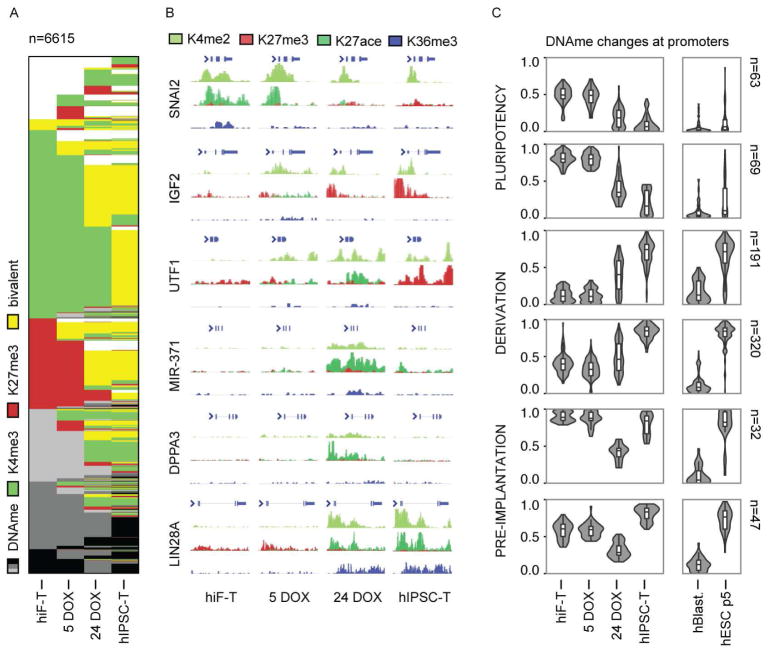
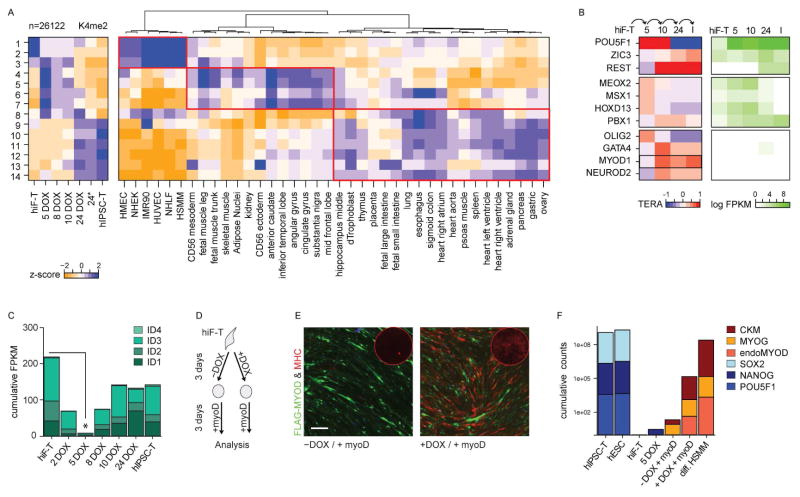
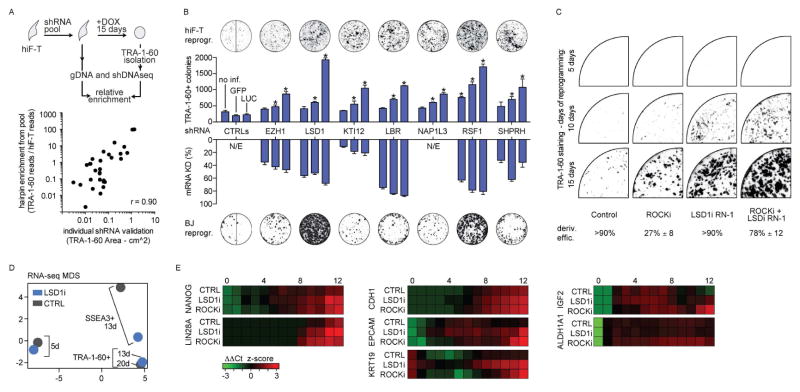
Induced pluripotency is a promising avenue for disease modeling and therapy, but the molecular principles underlying this process, particularly in human cells, remain poorly understood due to donor-to-donor variability and intercellular heterogeneity. Here, we constructed and characterized a clonal, inducible human reprogramming system that provides a reliable source of cells at any stage of the process. This system enabled integrative transcriptional and epigenomic analysis across the human reprogramming timeline at high resolution. We observed distinct waves of gene network activation, including the ordered re-activation of broad developmental regulators followed by early embryonic patterning genes and culminating in the emergence of a signature reminiscent of pre-implantation stages. Moreover, complementary functional analyses allowed us to identify and validate novel regulators of the reprogramming process. Altogether, this study sheds light on the molecular underpinnings of induced pluripotency in human cells and provides a robust cell platform for further studies. PAPERCLIP.


Figures

Figure 1
Figure 1. An optimized secondary reprogramming system for human reprogramming
A) Schematic representation of secondary reprogramming strategy and hiF-T engineering using inducible reprogramming factors (iOKMS) under the control of the reverse tetracycline transactivator (rtTA). Fibroblasts and IPSCs are shown as belonging to a primary hiBJ (blue), derived secondary hiF (green) and hiF-hTERT (brown) reprogramming system. B) Alkaline Phosphatase (AP) staining of the indicated reprogrammed cells. C–D) Representative bright fields of hiF and hiF-T cultures at different passages, after senescence-associated-beta-galactosidase (SA-b-GAL - upper panels) assay and corresponding alkaline phosphatase (AP) staining after 24 days of reprogramming (lower panels). Scale Bar, 100μm. Senescent cells are stained in blue and indicated with dark arrows. E) Histograms showing absolute expression levels of selected proliferation, stemness and senescence related genes, as measured by RNA-seq. FPKM, fragments per kilobase per million fragments mapped. Error bars represent a 95% confidence interval around the average values. *, significant difference with respect to control BJ at FDR < 0.1%. F) Hierarchical clustering of BJ, hiF and hiF-T cells according to expression levels of proliferation (left) or stemness-related (right) genes.
Figure 2
Figure 2. Integrative analysis of human cellular reprogramming
A) Flow cytometry analysis of surface markers during reprogramming of hiF-T cells. B) Schematic representation of time course collection of reprogramming intermediates, including fractionation by the indicated surface markers. For reprogramming, hiF-T cells were seeded on MEF feeder layer (MEF). Reprogramming was initiated at day 0 (DOX) and a switch to KSR-hESC media was performed at day 2 (KSR). The collection point labeled 24* represents cells reprogrammed for 20 days in DOX followed by 4 days without DOX. C) MDS analysis of RNA-seq data (left) along with the number of differentially expressed (DE) genes associated with each transition (right). More comparisons are shown in Figure S2A. D–E) MDS analyses of epigenomic data from regions differentially enriched (DE) in H3K4me2 or differentially DNA methylated (DM). In all the representations, samples are color coded to the reference time points in panel B.
Figure 3
Figure 3. Transcriptional dynamics during human cellular reprogramming
A) Line plots showing expression dynamics of differentially expressed genes during reprogramming, grouped by k-medoids clustering. Refer to Figure 2B for reprogramming time points. Grey shades represent a 95% bootstrap confidence interval around the median values. For each cluster the median expression value in hESC using 18 reference hESC lines is also reported. Heatmaps below each set of clusters (up-regulated, down-regulated and transients) show the total expression of genes in each cluster with respect to gene sets that define pluripotent (hESC) or embryonic germ layer-specific cells (ECTOderm, ENDOderm, MESOderm). B) Absolute expression levels (FPKM) of selected dynamic genes reported as line plot or heatmap. C) Representative colony of reprogrammed hIF-T cells identified by TRA-1-60 chromogenic staining in bright field and overlapping UTF1 and DPPA3 fluorescent staining. Complete field and staining controls are reported in Figure S3A. D) Co-expression relationships between representative markers of the identified developmental transitions with respect to LIN28A as reference pluripotent marker, measured by single-cell RNA-seq. Additional single-cell data are shown in Figure S3D. D) Absolute expression levels of categorized miRNAs (as normalized counts – see methods) (upper panel) and the relative expression levels of specific miRNA families with respect to total miRNA abundance (lower panel) at the indicated time points and in hESC line HUES64. E) Line plot showing absolute expression values of mRNA and miRNA involved in MET during reprogramming and in reference hESCs. Pluripotent genes with different onset during reprogramming (LIN28A, NANOG, TET1) are also included to illustrate the relationship between epithelialization and acquisition of pluripotency.
Figure 4
Figure 4. Changes in bivalency and DNA methylation during reprogramming
A) Chromatin state maps of 6,595 dynamic promoter regions, showing active (H3K4me3), repressed (H3K27me3) or bivalent regions (functionally poised by the co-enrichment of both H3K4me3 and H3K27me3). Promoters with none of these histone marks are marked by different degrees of DNA methylation (DNAme, 3 shades of gray for the ranges 25–50% – 50–75% and 75–100%). B) Histone methylation at representative 5–50 kb loci from the major transcriptional clusters in Figure 3B. A similar map of the broad pre-implantation region around the miR-371 cluster is also reported in Figure S4C–D. C) Violin plots showing promoter DNA methylation dynamics across the indicated reprogramming time points and sample types, grouped by k-means clustering. n, size of each cluster. The box plots show the first and the third quartiles, along with the medians.
Figure 5
Figure 5. Transient chromatin remodeling and epigenetic priming during reprogramming
A) Left: Heatmap showing the z-scores of the mean H3K4me2 enrichment in 26,122 dynamic genomic regions, grouped into 14 clusters. For full representation of the clusters and corresponding H3K27me3 dynamics refer to Figure S4A–B. Right: Heatmap showing the corresponding z-scores of the mean H3K27ac enrichment across tissues of different identity. B) Heatmap showing the TERA score of selected transcription factors predicted to be activated during the indicated reprogramming transitions, based on H3K4me2 footprints. Corresponding absolute gene expression values (FPKM) during reprogramming are reported on the right. A full list of the top transcription factors groups and their predicted co-binding relationships are shown in Figure S5. C) Bar plot showing the cumulative absolute expression values (FPKM) of the ID gene family during reprogramming. D) Schematic representation of the OKMS-enhanced MYOD reprogramming of hiF-Ts. E) Representative field of MYOD-mediated myogenic conversion without (−DOX) or with (+DOX) prior OKMS activation for 3 days. Cells positive for ectopic FLAG-MYOD are green while cells positive for the late muscle marker MHC are red. The corresponding MHC whole-well staining is shown in the corner of each condition. Scale Bar, 200μm F) Bar plot showing the normalized cumulative expression counts of pluripotent (SOX2, NANOG, POU5F1) and muscle -specific genes (muscle creatine kinase – CKM, myogenin – MYOG, endogenous MYOD, endoMYOD). Controls are reference PSCs, hiF-T reprogramming time points and differentiated human skeletal muscle myoblasts (HSMM).
Figure 6
Figure 6. Characterization of negative regulators of reprogramming
A) Schematic representation of the pooled shRNA screening strategy. B) Scatter plot showing comparison of selected reprogramming efficiencies in shRNA-perturbed hIF-T cells at day 15 in a pooled screening format (Y axis - enrichment of shRNA sequence reads from TRA-1-60+ cells versus cells prior to induction of reprogramming) versus an arrayed format (X axis - area of TRA-1-60+ colonies). The reported values are the mean of biological duplicates. C) Bar plots showing reprogramming efficiency (number of TRA-1-60+ colonies) upon shRNA-mediated perturbation of candidate regulators (upper histogram) and the corresponding change in mRNA expression levels in hIF-T cells relative to the effect of a control shRNA targeting luciferase (LUC) mRNA (lower histogram). Additional controls are shRNAs targeting GFP mRNA or uninfected cells. Three distinct hairpins were tested for each gene and representative TRA-1-60 stainings for each shRNA group are displayed above each set (control lane shows wells of both shGFP and shLUC treatments). Similar effects were observed in primary BJ reprogramming experiments, as shown by TRA-1-60 stainings below each set. Error bars indicate s.d. from the average. All reported values in histograms are significant with respect to controls at FDR < 5%. *, significant difference with respect to control at FDR < 1%. C) Representative TRA-1-60 staining at indicated time points of hiF-T reprogrammed in the continuous presence of the indicated inhibitors. D) Gene expression profiles, from RNA-seq, of hiF-T reprogramming with or without LSD1 inhibition (LSD1i and CTRL respectively), represented as points in two-dimensional MDS component space. A gene set enrichment analysis is described in Figure S6C. E) Heatmap showing expression (normalized z-score) of indicated genes during reprogramming in different conditions (untreated control, LSD1 inhibition, ROCK inhibition). Key time points for reprogramming transitions are indicated (0, 4, 8, 12). Corresponding MDS plot of the RNA-seq time course utilized to identify these genes is reported in Figure S6D.

References

    1. Apostolou E, Hochedlinger K. Chromatin dynamics during cellular reprogramming. Nature. 2013;502:462–471. - PMC - PubMed
    1. Baccelli I, Trumpp A. The evolving concept of cancer and metastasis stem cells. J Cell Biol. 2012;198:281–293. - PMC - PubMed
    1. Boyle P, Clement K, Gu H, Smith ZD, Ziller M, Fostel JL, Holmes L, Meldrim J, Kelley F, Gnirke A, et al. Gel-free multiplexed reduced representation bisulfite sequencing for large-scale DNA methylation profiling. Genome Biol. 2012;13:R92. - PMC - PubMed
    1. Chan EM, Ratanasirintrawoot S, Park IH, Manos PD, Loh YH, Huo H, Miller JD, Hartung O, Rho J, Ince TA, et al. Live cell imaging distinguishes bona fide human iPS cells from partially reprogrammed cells. Nat Biotechnol. 2009;27:1033–1037. - PubMed
    1. Edgar R, Mazor Y, Rinon A, Blumenthal J, Golan Y, Buzhor E, Livnat I, Ben-Ari S, Lieder I, Shitrit A, et al. LifeMap Discovery™: the embryonic development, stem cells, and regenerative medicine research portal. PLoS ONE. 2013;8:e66629. - PMC - PubMed

Publication types

MeSH terms

Associated data