. 2015 Jan;16(1):85-95.
doi: 10.1038/ni.3047. Epub 2014 Dec 1.

Regulatory iNKT cells lack expression of the transcription factor PLZF and control the homeostasis of T(reg) cells and macrophages in adipose tissue

Affiliations

Regulatory iNKT cells lack expression of the transcription factor PLZF and control the homeostasis of T(reg) cells and macrophages in adipose tissue

Lydia Lynch et al. Nat Immunol. 2015 Jan.

Abstract

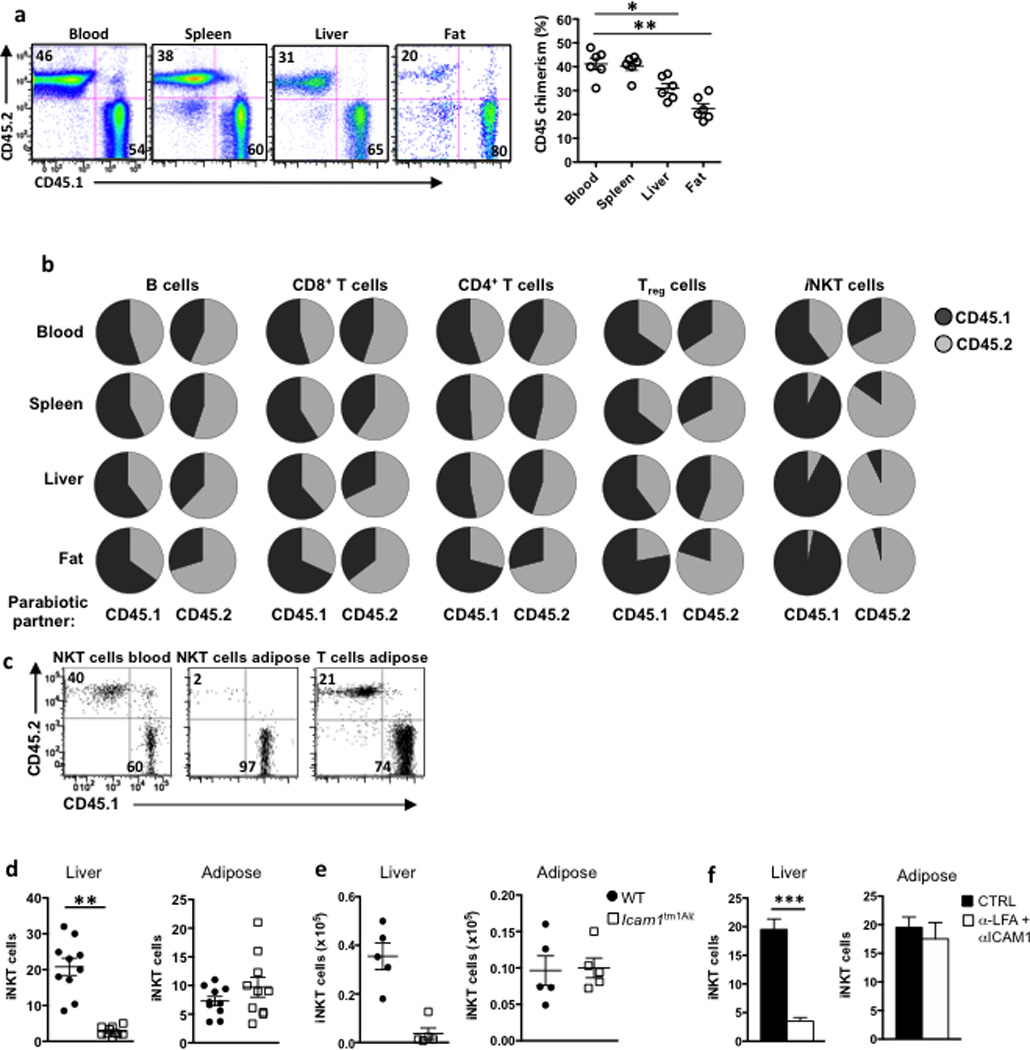
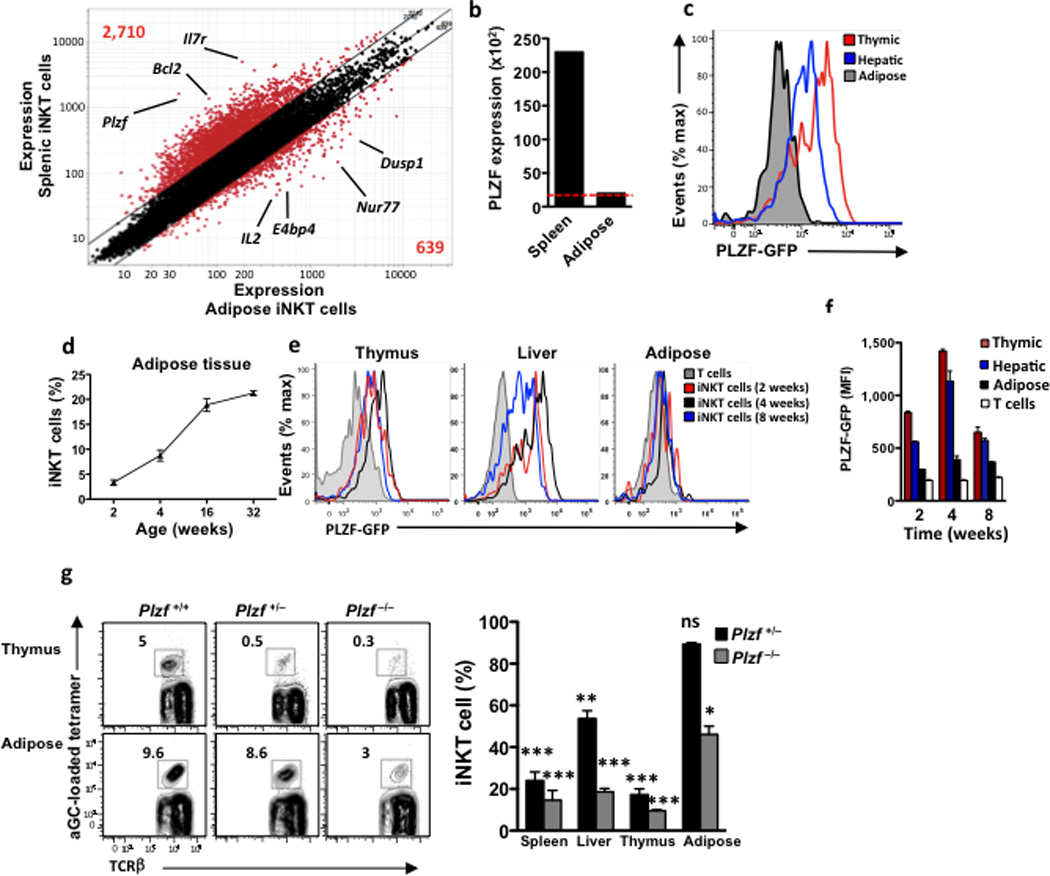
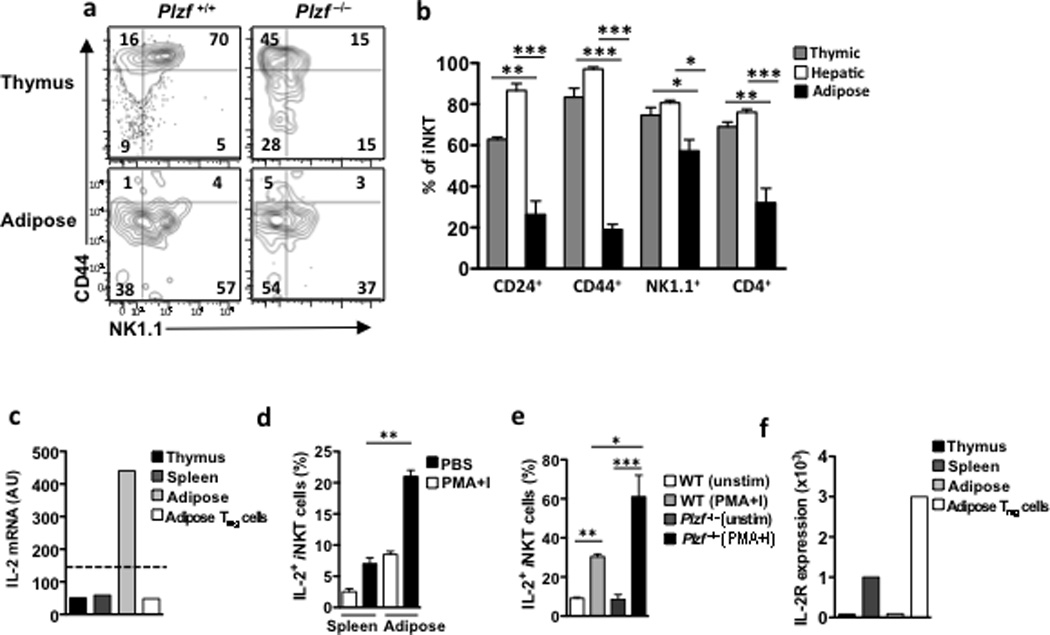
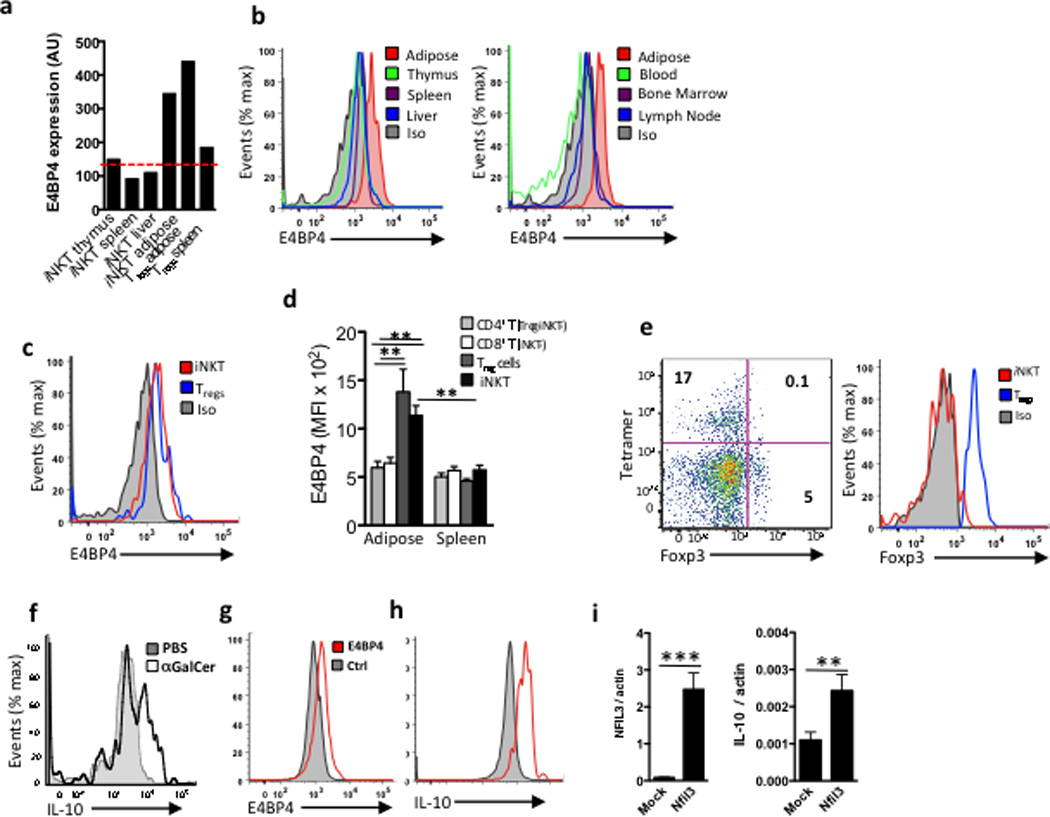
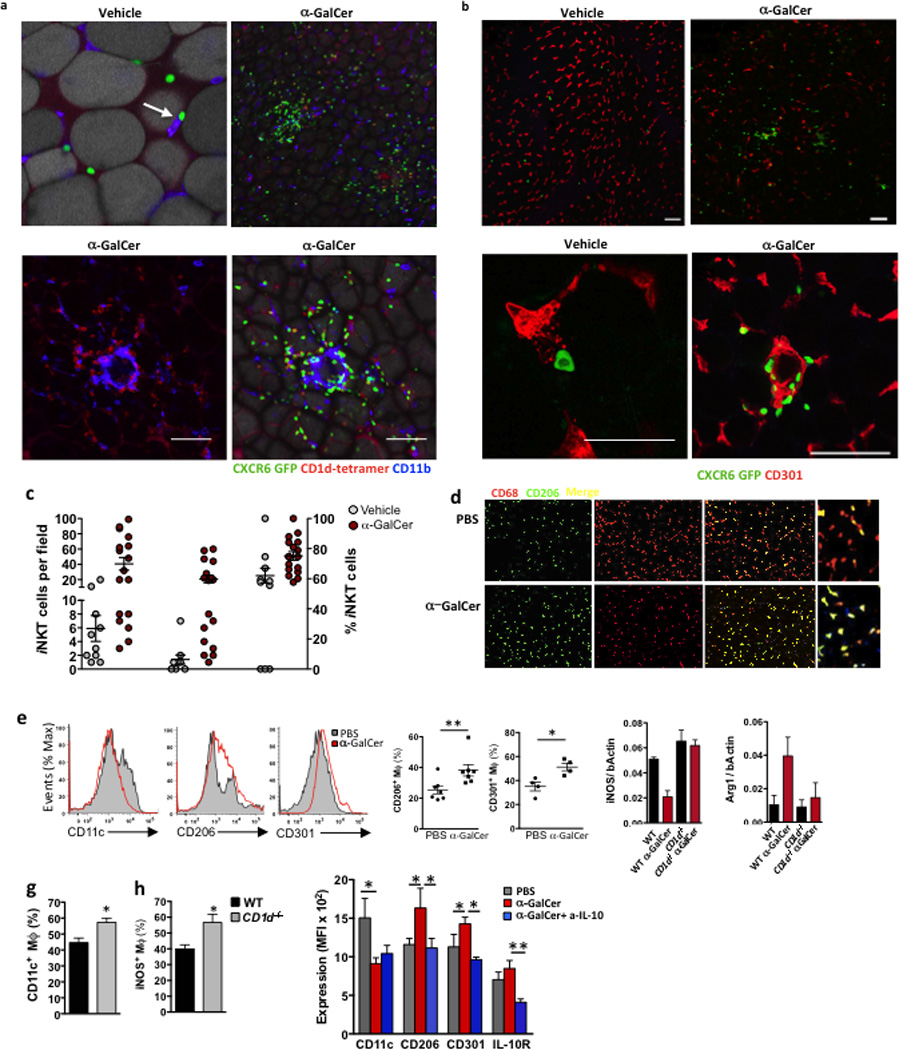
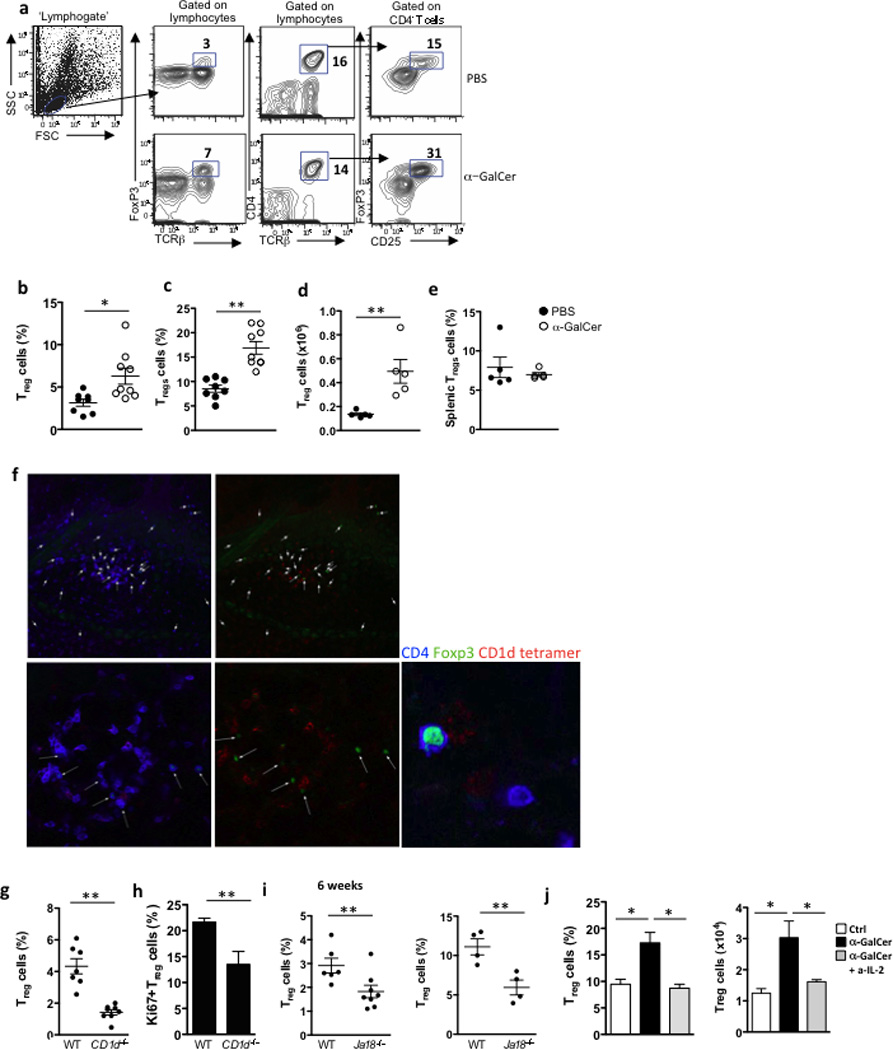
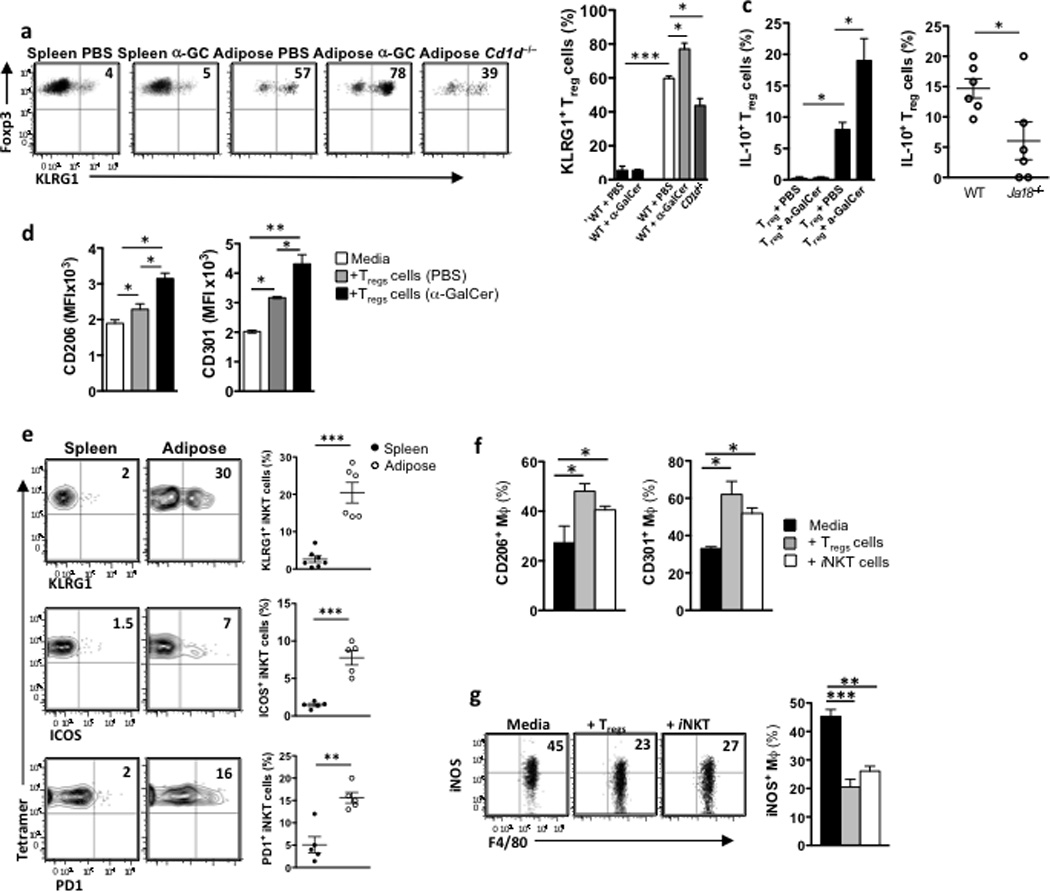
Invariant natural killer T cells (iNKT cells) are lipid-sensing innate T cells that are restricted by the antigen-presenting molecule CD1d and express the transcription factor PLZF. iNKT cells accumulate in adipose tissue, where they are anti-inflammatory, but the factors that contribute to their anti-inflammatory nature, as well as their targets in adipose tissue, are unknown. Here we found that iNKT cells in adipose tissue had a unique transcriptional program and produced interleukin 2 (IL-2) and IL-10. Unlike other iNKT cells, they lacked PLZF but expressed the transcription factor E4BP4, which controlled their IL-10 production. The adipose iNKT cells were a tissue-resident population that induced an anti-inflammatory phenotype in macrophages and, through the production of IL-2, controlled the number, proliferation and suppressor function of regulatory T cells (Treg cells) in adipose tissue. Thus, iNKT cells in adipose tissue are unique regulators of immunological homeostasis in this tissue.


Figures

Figure 1
Figure 1. iNKT cells are tissue resident in adipose tissue and do not rely on ICAM or LFA1 for retention
(a) Relative frequencies of CD45.1 (host) and CD45.2 (parabiotic partner) lymphocytes in the blood, spleen, liver and adipose tissue of the CD45.1 member of a CD45.1 and CD45.2 congenic C57BL/6 parabiotic pair joined at 6 wk of age and examined 2 weeks later. Shown are representative facs plots from 2 experiments in 5 pairs of mice each (n=20 mice). Graph shows chimerism of total lymphocytes in each organ in the parabiotic pairs (n=10 pairs). (b) Pie charts indicate the average of the relative frequencies of CD45.1 (black) and CD45.2 (grey) lymphocyte subsets in each partner after 15 d parabiosis (n=10 pairs). Results were generated after B cells, CD8+ and CD4+ T cells, Tregs, and iNKT cells were gated, in blood, spleen, liver and fat. (c) Representative dot plots of iNKT cell chimerism (as measured by CD45.1 and CD45.2) in blood and adipose compared to other non-iNKT T cells in adipose in a CD45.1 partner of parabiotic pair. (d) iNKT cell levels, as a % of lymphocytes, in liver and adipose in WT and ICAM1−/− mice (n=10 per group). (e) iNKT cell numbers in liver and adipose in WT and ICAM1−/− mice (n=5 per group). (f) WT mice were injected with anti-LFA and anti-ICAM1 and iNKT cell levels were measured in liver and fat the following day. Graphs represent one (n=4) of two independent experiments. Statistical comparisons using student t-test. *p<0.05, **p=<0.01.
Figure 2
Figure 2. Adipose iNKT cells lack PLZF and are present in PLZF−/− mice
(a) Microarray analysis. Normalized expression values for transcripts isolated from iNKT cells from epididymal fat versus spleen of 6-week-old B6 males. (b) PLZF expression levels of iNKT cells from matched spleen and adipose tissue. Red dotted line represents the expression cut-off level. (c) PLZF-GFP mice were used to measure PLZF expression by flow cytometry. iNKT cells were gated in each organ and GFP+ cells were measured. Histogram illustrates matched organs from one mouse, data is representative of 9 mice. (d) Levels of iNKT cells in adipose tissue with age, as a % of total adipose T cells. n=4 mice per age group. (e) GFP+ cells gated on iNKT cells in thymus, liver and adipose, from PLZF-GFP mice age 2, 4 and 8 weeks old. Histograms represent 4 mice per age group. (f) PLZF MFI expression on thymic, hepatic and adipose iNKT cells compared to adipose (non-iNKT) T cells (white) Each timepoint = n=4 mice. (g) Representative contour plots of iNKT cell levels in thymus and adipose in PLZF+/+, PLZF+/− and PLZF−/− littermates. Right: Graph of reduced iNKT cell levels in PLZF+/− (n=7) and PLZF−/− (n=4) compared to WT mice (n=5). * represents statistical significance compared to WT littermate mice. Statistical comparisons using ANOVA and Tukey post-hoc test. *p<0.05, **p=<0.01, ***p<0.001.
Figure 3
Figure 3. Adipose iNKT cells have similar characteristics to PLZF negative iNKT cells
(a) Contour plots of NK1.1 and CD44 in matched thymic and adipose iNKT cells. (b) Graph represents the % of thymic, hepatic and adipose iNKT cells expressing CD24, CD44, NK1.1 and CD4 on, n=3 mice per organ. (c) IL-2 mRNA levels in iNKT cells from thymus, spleen and adipose tissue, as well as Tregs from adipose tissue. (d) Graph of IL-2 production by splenic and adipose iNKT cells measured by flow cytometry of intracellular staining of IL-2 after 4 hour stimulation with PBS or PMA and Ionomycin (PMA+I) (n=4). (e) Histogram of IL-2 intracellular staining gated on adipose iNKT cells in PLZF+/+ and PLZF−/− mice after 4 hours of PMA+I stimulation with Brefeldin A, representative of n=4 per group (f) IL-2R mRNA levels in iNKT cells from thymus, spleen and adipose tissue, as well as Tregs from adipose tissue. Dotted line represents the expression cut-off value. Statistical comparisons using ANOVA and Tukey post-hoc test. *p<0.05, **p=<0.01, ***p<0.001.
Figure 4
Figure 4. Adipose iNKT cells express E4BP4 which induces IL-10 production
(a) mRNA levels of E4BP4 (Nfil3) in iNKT cells from thymus, spleen, liver and adipose tissue, as wells as Tregs from adipose and spleen as comparison. (b) Representative histogram of intracellular staining for E4BP4 in iNKT cells in several organs and adipose (red), and isotype control (grey filled) (n=4 mice, same mice for each organ). (c) Representative histogram comparing intracellular staining of E4BP4 in adipose iNKT cells vs. adipose Tregs cells (B&C) representative of n=6. (d) Graph of E4BP4 expression (MFI) by flow cytometry gated on adipose and splenic CD4+ and CD8+ T cells after Tregs and iNKT cells were excluded, compared to adipose and splenic Tregs and iNKT cells (n=5). (e) Representative dot plot of Foxp3 staining and tetramer staining after gating on adipose TCRβ+ cells, and histogram of Foxp3 levels in iNKT cells and Tregs cells from adipose tissue (representative of n=8). (f) Intracellular staining of IL-10 in adipose iNKT cells after 4hrs stimulation in vivo following PBS or αGalCer injection, representative of n=6 mice. (g) Primary splenic iNKT cell lines were transfected with E4BP4 (red lines) or mock transfected (grey). Representative histogram of E4BP4 expression 18 hrs after transfection. (h) Intracellular levels of IL-10 levels and (i) mRNA levels of IL-10 in iNKT cells transfected with E4BP4 or mock transfected (n=3 cell lines transfected and mock transfected).
Figure 5
Figure 5. Adipose iNKT cells interact with macrophages in vivo and induce M2 macrophages through IL-10
(a&b) Confocal images of CD1d tetramer labeling and CXCR6-GFP+ cells, co-stained with CD11b or CD4, in whole adipose tissue sections from WT and CXCR6-GFP+ mice 4 days after treatment with vehicle control or αGalCer (representative of 5 mice per treatment). (c) Quantification of iNKT-macrophage interactions. Number of iNKT cells after vehicle or αGalCer treatment per field (Left group), number of iNKT cells co-localizing with macrophages (middle group), and quantification of % of total iNKT cells interacting with macrophages per field after vehicle or αGalCer treatment (right group). (d) Immunofluorescent microscopy staining for macrophages in whole mount adipose tissue 3 days after in vivo PBS or αGalCer treatment. CD68 (red), CD206/MMR (green) and double positive ‘M2 phenotype’ macrophages (merged yellow cells). (e) Representative histograms of CD11c, CD206 and CD301 levels after gating on CD11b+F480+ macrophages in adipose tissue. Graphs of CD206+ (n=7) and CD301+ F480+ (n=4) macrophages in each mouse after treatment in vivo with PBS or αGalCer. (f) qPCR of iNOS and Arginine (Arg1) levels over bActin in whole adipose tissue after vehicle or αGalCer treatment in WT and CD1d−/− mice (n=3 per group). (g) Surface CD11c+ and (h) intracellular levels of iNOS in adipose macrophages in WT and CD1d−/− mice (n=3 per group). (i) In vivo treatment of WT mice with PBS or αGalCer (aGC) was repeated, with the inclusion of an IL-10 neutralizing antibody (aIL-10). Graph of mean level of CD11c, CD206, CD301 and IL-10R on adipose macrophages (n=4–5). Statistical comparisons using t-tests or ANOVA for group of 3 with Tukey post-hoc test. *p<0.05, **p=<0.01, ***p<0.001.
Figure 6
Figure 6. Adipose iNKT control adipose tissue Tregs through IL-2 production
(a) Gating strategy, and representative contour plots of adipose Tregs after PBS or αGalCer treatment. (b) Levels of Tregs as a % of adipose lymphocytes and (c) as % of adipose T cells, after treatment with PBS (n=8) or αGalCer (n=9). and (d) number of Tregs in adipose tissue after treatment with PBS or αGalCer (n=5). (e) Levels of splenic Tregs from the same mice after treatment with PBS or αGalCer (n=5). Treg cell levels and numbers were measured 3 days post-injection. (f) Confocal images of CD1d tetramer labeling and Foxp3-GFP+ cells, co-stained with CD4, in whole adipose tissue sections from Foxp3-GFP+ mice that received αGalCer (represents 4 mice). (g) Levels of Tregs as a % of adipose lymphocytes, in 6wk-old WT versus CD1d−/− mice (n=7 per strain). (h) Adipose Tregs were stained intracellularly with Ki67 in 6wk-old WT versus CD1d−/− mice (n=5). (i) Levels of Tregs as a % of adipose T cells, in 6wk-old and 6 month old WT (n=6 and n=4) versus Ja18−/− mice (n=9 and n=4). (j) Treatment of WT mice with PBS or αGalCer (n=5 per group) was repeated, with the inclusion of an IL-2 neutralizing antibody in one group of αGalCer treated mice, and Treg % and number were measured in adipose tissue. Statistical comparisons using t-tests or ANOVA for group of 3 with Tukey post-hoc test. *p<0.05, **p=<0.01, ***p<0.001.
Figure 7
Figure 7. Adipose iNKT cells enhance the suppressive ability of Tregs and have similar functions to Tregs
(a) Dot plots and graph of Klrg1 surface expression on splenic Treg cells (CD3+CD4+Foxp3+) in spleen 3 days after PBS or αGalCer treatment, or in WT adipose tissue 3 days after PBS or αGalCer treatment, or in adipose tissue of CD1d−/− mice (n=5 per group). (b) Intracellular IL-10 production in vivo by Treg cells in spleen (first 2 bars) and adipose tissue (last 2 bars) after treatment in vivo with αGalCer (n=4). (c) Basal intracellular IL-10 production in vivo by adipose Tregs in WT and Ja18−/− mice (n=6). (d) 10,000 Tregs were isolated from adipose tissue that had been treated with PBS or αGalCer for 3 days (pooled from 5 mice per treatment group), and cultured with peritoneal macrophages. MFI of CD301 and CD206 levels were measured on cultured macrophages (n=3 experiments). (e) Klrg1, ICOS and PD-1 surface expression on iNKT cells from spleen and adipose tissue (n=5–6). (f) Peritoneal macrophages were isolated from WT mice and cultured for 48hrs with either iNKT cells or Treg cells from adipose tissue or media alone. After 48hrs of culture, macrophages were stained for flow cytometric analysis of CD206/MMR and CD301 levels (n=2 independent experiments). (g) Dot plots and graphs of intracellular iNOS levels in peritoneal macrophages from obese mice cultured with adipose Treg cells and iNKT cells for 24 hours. Statistical comparisons using t-tests or ANOVA for group of 3 with Tukey post-hoc test. *p<0.05, **p=<0.01, ***p<0.001.

References

    1. Cohen NR, Garg S, Brenner MB. Antigen Presentation by CD1 Lipids, T Cells, and NKT Cells in Microbial Immunity. Adv Immunol. 2009;102:1–94. - PubMed
    1. Savage AK, et al. The transcription factor PLZF directs the effector program of the NKT cell lineage. Immunity. 2008;29:391–403. - PMC - PubMed
    1. Kovalovsky D, et al. The BTB-zinc finger transcriptional regulator PLZF controls the development of invariant natural killer T cell effector functions. Nature immunology. 2008;9:1055–1064. - PMC - PubMed
    1. Martin E, et al. Stepwise development of MAIT cells in mouse and human. PLoS biology. 2009;7:e54. - PMC - PubMed
    1. Kreslavsky T, et al. TCR-inducible PLZF transcription factor required for innate phenotype of a subset of gammadelta T cells with restricted TCR diversity. Proceedings of the National Academy of Sciences of the United States of America. 2009;106:12453–12458. - PMC - PubMed

Publication types

MeSH terms

Substances

Associated data