. 2015 Aug;12(8):767-72.
doi: 10.1038/nmeth.3453. Epub 2015 Jun 29.

Single-nucleotide-resolution mapping of m6A and m6Am throughout the transcriptome

Affiliations

Single-nucleotide-resolution mapping of m6A and m6Am throughout the transcriptome

Bastian Linder et al. Nat Methods. 2015 Aug.

Abstract

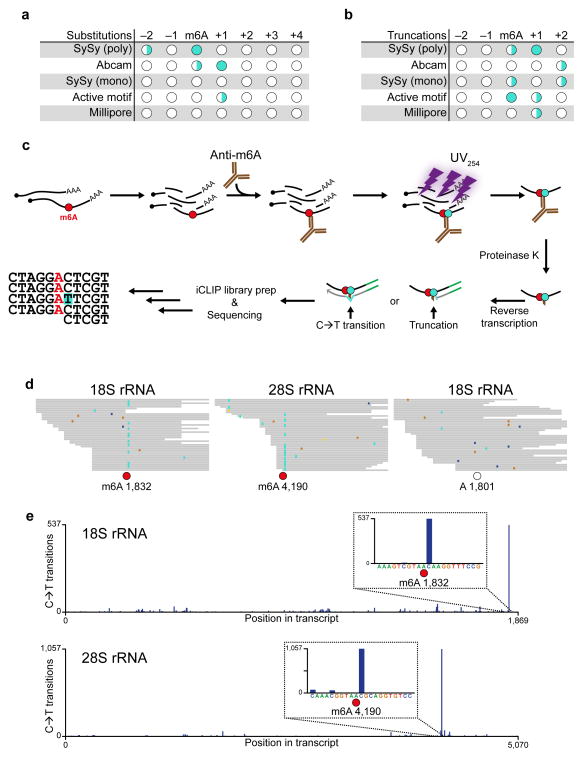
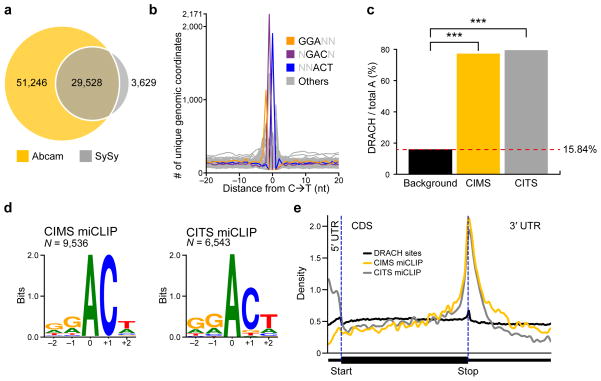
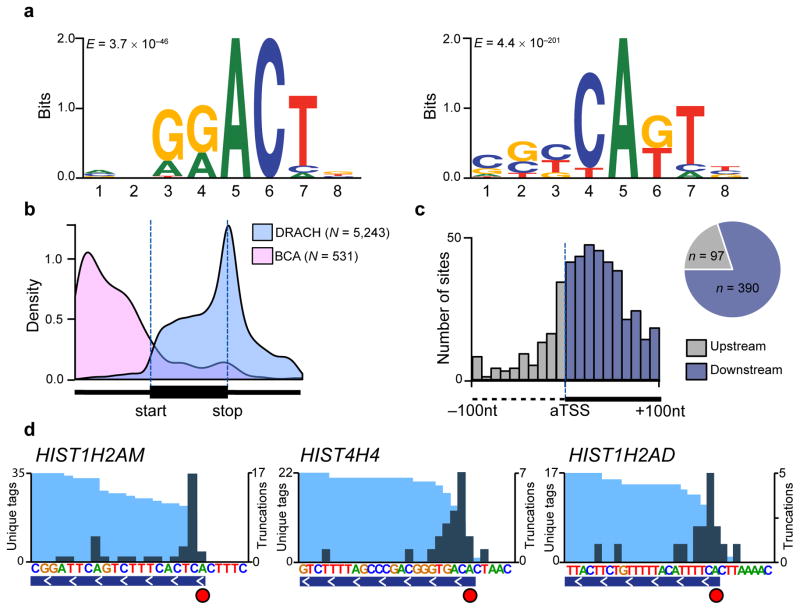
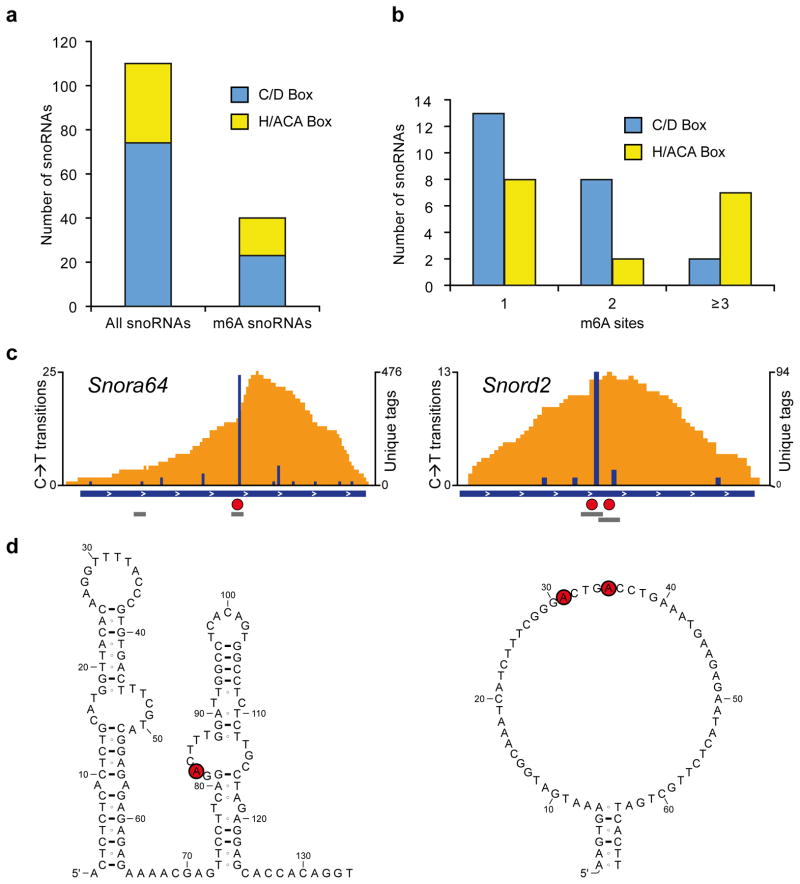
N(6)-methyladenosine (m6A) is the most abundant modified base in eukaryotic mRNA and has been linked to diverse effects on mRNA fate. Current mapping approaches localize m6A residues to transcript regions 100-200 nt long but cannot identify precise m6A positions on a transcriptome-wide level. Here we developed m6A individual-nucleotide-resolution cross-linking and immunoprecipitation (miCLIP) and used it to demonstrate that antibodies to m6A can induce specific mutational signatures at m6A residues after ultraviolet light-induced antibody-RNA cross-linking and reverse transcription. We found that these antibodies similarly induced mutational signatures at N(6),2'-O-dimethyladenosine (m6Am), a modification found at the first nucleotide of certain mRNAs. Using these signatures, we mapped m6A and m6Am at single-nucleotide resolution in human and mouse mRNA and identified small nucleolar RNAs (snoRNAs) as a new class of m6A-containing non-coding RNAs (ncRNAs).


Conflict of interest statement

COMPETING FINANCIAL INTERESTS

The authors declare no competing financial interests.

Figures

Figure 1
Figure 1. Anti-m6A antibodies induce signature mutations that directly indicate the location of m6A
(a) In vitro transcribed RNA containing a single m6A was UV-crosslinked to different antibodies, purified, reverse transcribed and sequenced. Positions with crosslinking-induced single-nucleotide substitutions were identified and categorized into high (●), medium (◑) and low (○) frequency sites (>25%, 5–25%, and <5%, respectively). (b) Similar to a, but with analysis of truncations instead of substitutions. (c) Schematic of the miCLIP protocol. Purified cellular RNA is fragmented and incubated with an anti-m6A antibody. After crosslinking with UV light (254 nm), covalently bound antibody-RNA complexes are recovered by protein A/G-affinity purification, SDS-PAGE and nitrocellulose membrane transfer. RNA is then released from the membrane by proteinase K and reverse transcribed. Peptide fragments that remain on the RNA lead to nucleotide incorporation errors (indicated as C→T transition) and cDNA truncations. (d) miCLIP reads from HEK293 total RNA were aligned to rRNA and analyzed for mismatches at the two most abundant cellular m6A residues (red circles) at positions 1,832 and 4,190 of 18S and 28S rRNA, respectively. As a control, a non-methylated DRACH consensus site at position 1,801 of 18S rRNA was analyzed (open circle). C→T transitions are shown in turquoise, other single-nucleotide mismatches are indicated by blue, brown and yellow colors. (e) Quantitative representation of the C→T transitions in 18S (upper panel) and 28S (lower panel) rRNAs.
Figure 2
Figure 2. C→T transitions and truncations map m6A throughout the transcriptome
(a) Overlap analysis of miCLIP peak clusters generated by the Abcam and SySy antibodies. (b) Frequency plot of nucleotide triplets at C→T transitions. The most abundant 3-mers at positions −1, 0 and +1 are GGA, GAC and ACT, and are shown in color. These reconstitute the most common m6A consensus sequence GGACT. AAC, the other RAC motif known to be highly methylated, is the second most abundant 3-mer at the transition site (shown in grey here for clarity). (c) Adenosines called by miCLIP are significantly more often in DRACH sequence context than expected by the background distribution of this motif. (P < 1 × 10⁻¹⁵, Fisher’s exact test). (d) Transcripome-wide sequence logos of C→T transitions and truncations are identical to the m6A consensus motif. Weblogo analyses of the sequence environment of C→T transitions (left panel) or truncations (right panel) (m6A is at position 0). (e) miCLIP-identified m6A residues show a metagene distribution profile that is typical for m6A. Metagene distribution plots of DRACH consensus site background (black) and the m6A residues predicted by the CIMS- (yellow) and CITS-based (grey) miCLIP.
Figure 3
Figure 3. miCLIP identifies m6A with single-nucleotide resolution
m6A residues detected by CIMS and CITS miCLIP in the ncRNA MALAT1. Orange and dark blue tracks: CIMS miCLIP unique read coverage and C→T transitions, respectively. Light blue and black tracks: CITS miCLIP unique read coverage and unique read starts, respectively. Horizontal blue bars: Transcript models. Red circles: miCLIP called m6A. Small horizontal bars in insets: DRACH consensus sites with a methylation status that is undefined (grey), confirmed positive (turquoise) or confirmed negative (magenta) by SCARLET.
Figure 4
Figure 4. Antibody-induced truncations map m6Am throughout the transcriptome
(a) MEME analysis of the sequence environment (−4 to +4) of 797 truncations localized to 5′UTRs identified two predominant motifs: The canonical m6A motif DRACH (left panel; E = 3.7 × 10−46), and a motif that is best described by the consensus sequence BCA (right panel; E = 4.4 × 10−201). (b) Truncations in DRACH and BCA sequence context follow distinct metagene distribution profiles. (c) Truncations in CITS miCLIP cluster around the annotated transcription start site (aTSS). The number of truncations in 10nt bins between −100nt and +100nt relative to the aTSS is plotted (upstream of aTSS, grey; downstream of aTSS, blue). The pie chart shows the proportion of truncations found upstream and downstream of the aTSS. (d) Truncations identify m6Am with single-nucleotide resolution. Examples of known m6Am-containing 5′UTRs are shown (light blue and teal tracks, unique CITS miCLIP read coverage and unique read starts, respectively; horizontal blue bars, transcript models; red circles, called m6Am residues).
Figure 5
Figure 5. m6As are abundant in mouse snoRNAs
(a) Bargraph showing the number of snoRNAs analyzed and the number of snoRNAs with at least one m6A. Both, C/D-box and H/ACA-box snoRNAs are methylated. (b) C/D-box and H/ACA-box snoRNAs can be methylated at multiple positions. (c) Examples of m6A-modified snoRNAs. The H/ACA-box snoRNA Snora64 and the C/D-box snoRNA Snord2 contain m6A (red circles) in canonical DRACH consensus sites (grey bars). Orange and blue tracks: unique CIMS miCLIP read coverage and C→T transitions, respectively. Horizontal blue bars: transcript models. Grey bars: DRACH consensus sites. Red circles: called m6A residues. (d) Methylation occurs in single-stranded regions of snoRNAs. Shown are secondary structures of Snora64 and Snord2 as predicted in the Ensembl database. Red circles: called m6A residues.

References

    1. Meyer Kate D, et al. Comprehensive analysis of mRNA methylation reveals enrichment in 3′ UTRs and near stop codons. Cell. 2012;149:1635–1646. - PMC - PubMed
    1. Dominissini D, et al. Topology of the human and mouse m6A RNA methylomes revealed by m6A-seq. Nature. 2012;485:201–206. - PubMed
    1. Perry RP, Kelley DE, Friderici K, Rottman F. The methylated constituents of L cell messenger RNA: evidence for an unusual cluster at the 5′ terminus. Cell. 1975;4:387–394. - PubMed
    1. Desrosiers R, Friderici K, Rottman F. Identification of methylated nucleosides in messenger RNA from Novikoff hepatoma cells. Proceedings of the National Academy of Sciences of the United States of America. 1974;71:3971–3975. - PMC - PubMed
    1. Schibler U, Kelley DE, Perry RP. Comparison of methylated sequences in messenger RNA and heterogeneous nuclear RNA from mouse L cells. Journal of Molecular Biology. 1977;115:695–714. - PubMed

Publication types

Associated data