. 2015 Apr 16;58(2):362-70.
doi: 10.1016/j.molcel.2015.02.014. Epub 2015 Mar 19.

Convergence of developmental and oncogenic signaling pathways at transcriptional super-enhancers

Affiliations

Convergence of developmental and oncogenic signaling pathways at transcriptional super-enhancers

Denes Hnisz et al. Mol Cell. .

Abstract

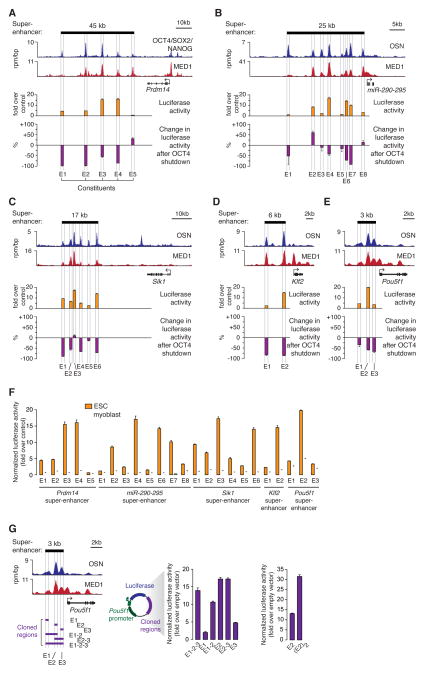
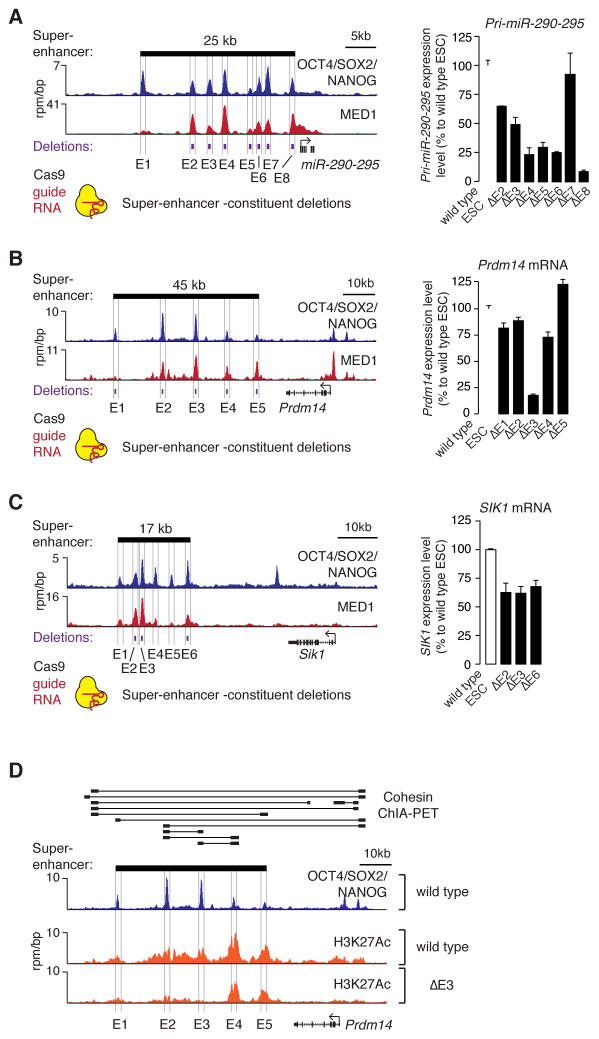
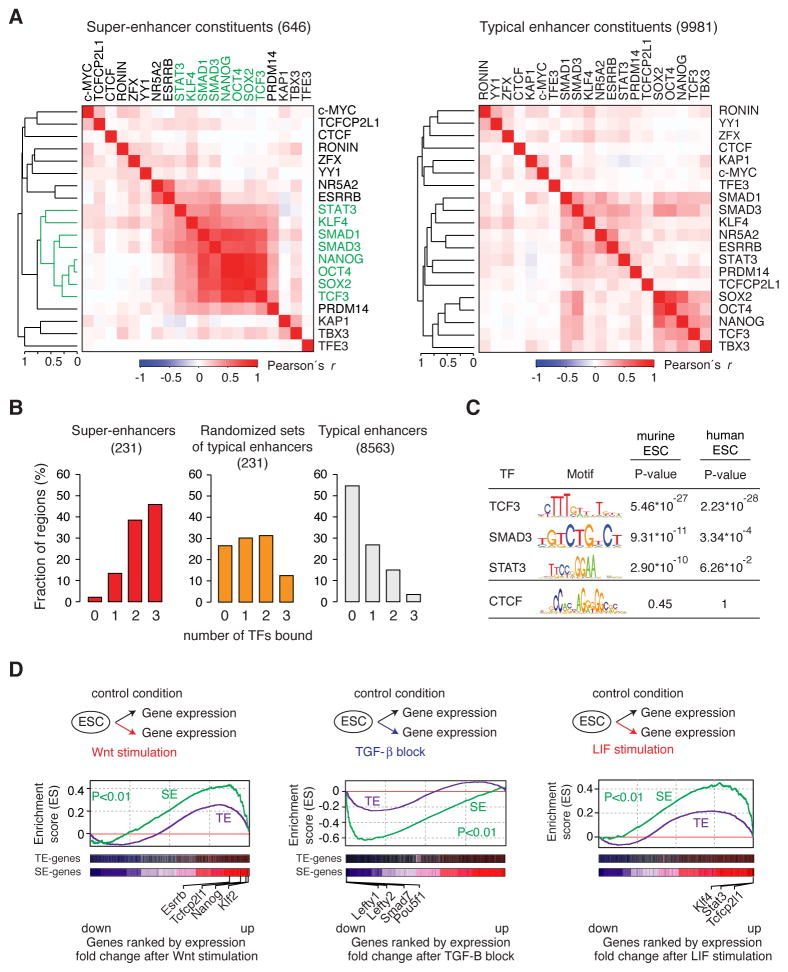
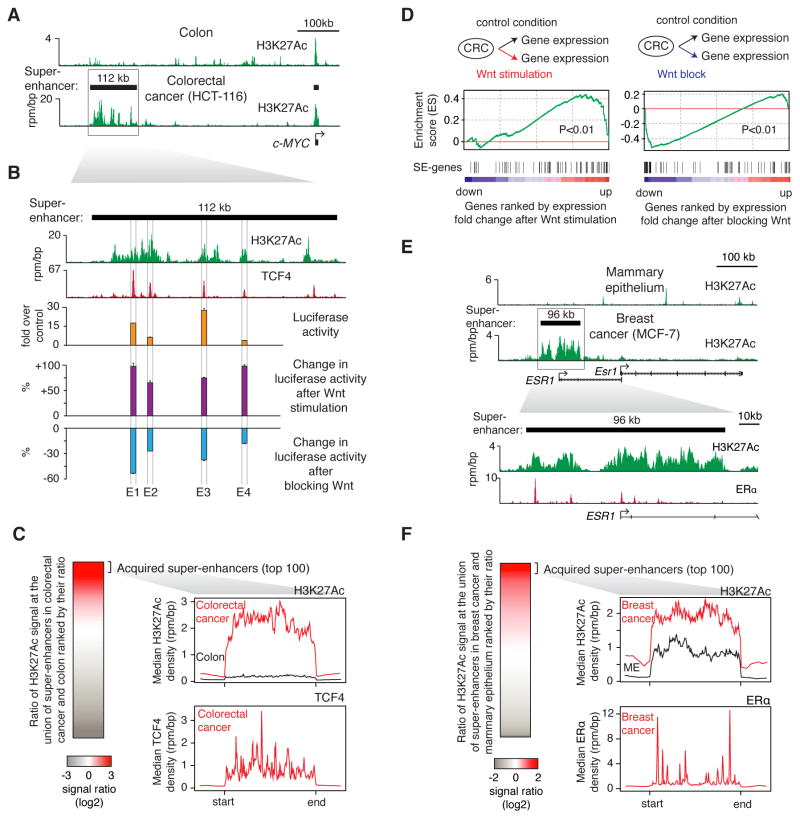
Super-enhancers and stretch enhancers (SEs) drive expression of genes that play prominent roles in normal and disease cells, but the functional importance of these clustered enhancer elements is poorly understood, so it is not clear why genes key to cell identity have evolved regulation by such elements. Here, we show that SEs consist of functional constituent units that concentrate multiple developmental signaling pathways at key pluripotency genes in embryonic stem cells and confer enhanced responsiveness to signaling of their associated genes. Cancer cells frequently acquire SEs at genes that promote tumorigenesis, and we show that these genes are especially sensitive to perturbation of oncogenic signaling pathways. Super-enhancers thus provide a platform for signaling pathways to regulate genes that control cell identity during development and tumorigenesis.


Figures

Figure 1
Figure 1. Activities of super-enhancer constituents
ChIP-Seq binding profiles for OCT4, SOX2 and NANOG (merged) and Mediator (MED1) at the (A) Prdm14, (B) miR-290-295, (C) Sik1, (D) Klf2 and (E) Pou5f1 (Oct4) loci in ESCs. Enhancer activity measured in luciferase reporter assays in wild type cells and the change in enhancer activity after OCT4 shutdown is plotted for each constituent enhancer within the super-enhancer. The super-enhancer is depicted as a black bar above the binding profiles. The difference in values after OCT4 shutdown is statistically significant for all constituents, except from miR-290-295 M1, M3 and M5 (P<0.05, Student’s t-test). (F) Enhancer activity of the SE constituents measured in ESCs and myoblasts. The difference between the two values is statistically significant for each active constituent (P<0.01, Student’s t-test). (G) Enhancer activities of indicated fragments (purple) of the Pou5f1 SE. Throughout the figure, values correspond to mean +SD from three biological replicate experiments. See also Figure S1, S2, Table S1.
Figure 2
Figure 2. Contributions of super-enhancer constituents to gene expression in vivo
(A) (left) ChIP-Seq binding profiles for OCT4, SOX2 and NANOG (merged) and Mediator (MED1) at the miR-290-295 locus in ESCs. (right) miR-290-295 expression level in ESCs in which the indicated super-enhancer constituents were deleted. Values correspond to mean +SD from three biological replicate experiments. (B) Gene expression analysis at the Prdm14 locus after deletion of super-enhancer constituents. (C) Gene expression analysis at the Sik1 locus after deletion of SE constituents. All values correspond to mean +SD from three biological replicate experiments. The difference of all values measured in deletion lines, except for miR-290-295 E7, are statistically significant compared to wild type (P<0.05, Student’s t-test). (D) ChIP-Seq binding profiles for H3K27Ac in wild type and Prdm14 E3 deleted ESCs. Cohesin (SMC1) ChIA-PET data for ESCs is shown above the binding profiles, where thick black bars connected by lines indicate regions that show high-confidence interactions (Dowen et al., 2014). See also Table S2.
Figure 3
Figure 3. Signaling modules at super-enhancers
(A) Hierarchical clustering of 20 transcription factor ChIP-Seq binding profiles at super-enhancer and typical enhancer constituents. A set of factors with binding profiles similar to Oct4, Sox2 and Nanog is highlighted in green. (B) Percentage of super-enhancers and typical enhancers bound by the indicated number of signaling TFs (TCF3, SMAD3, STAT3). Randomized sets of typical enhancers indicate sets of typical enhancers where the numbers in the sets correspond to the number of constituents within super-enhancers. (C) Binding motifs for TCF3, SMAD3 and STAT3 and the P-values for their enrichment in super-enhancer constituent enhancers in murine and human ESCs. The motif of CTCF is not found enriched, and serves as a negative control. The P-values in mESCs are re-analysis from (Whyte et al., 2013) (D) Gene set enrichment analysis (GSEA) of gene expression changes after manipulation of the Wnt, TGF-β and LIF pathways. “SE-genes” indicate genes associated with SEs, “TE-genes” with typical enhancers, respectively. See also Figure S3, Table S3.
Figure 4
Figure 4. TCF4 occupancy and Wnt responsiveness of super-enhancers acquired in colorectal cancer
(A) ChIP-Seq binding profiles for H3K27Ac at the c-MYC locus in colon and colorectal cancer cells (HCT-116). (B) A blow-up of the region indicated by a box on panel (A). TCF4 binding profile in the HCT-116 is displayed, along with the enhancer activity of TCF4-bound constituents of the acquired super-enhancer at MYC locus. Luciferase reporter activity in HCT-116 cells and the change in enhancer activity after Wnt stimulation or blockage are plotted. Values correspond to mean +SD from three biological replicate experiments. (C) (left) Ratio of H3K27Ac in CRC (HCT-116) vs. normal colon tissue used densities at the union of SEs identified in the two samples. (right) Metagene representation of H3K27Ac and TCF4 ChIP-Seq densities at the regions corresponding to the top 100 acquired super-enhancers. (D) Gene set enrichment analysis (GSEA) of gene expression changes after manipulation of the Wnt pathway. “SE-genes” indicate genes that are associated with acquired SEs. (E) (top) ChIP-Seq binding profiles for H3K27Ac at the ESR1 locus in mammary epithelium and breast cancer cells (MCF-7). (bottom) A blow-up of the region indicated on top. ChIP-Seq binding profile for ERα is displayed. (F) (left) Ratio of H3K27Ac in breast cancer (MCF-7) vs. mammary epithelium (ME) at the union of SEs identified in the two samples. (right) Metagene representation of H3K27Ac and ERα ChIP-Seq densities at the regions corresponding to the top 100 acquired super-enhancers. See also Figure S4, Table S1, Table S3.

Comment in

References

    1. Bender MA, Ragoczy T, Lee J, Byron R, Telling A, Dean A, Groudine M. The hypersensitive sites of the murine beta-globin locus control region act independently to affect nuclear localization and transcriptional elongation. Blood. 2012;119:3820–3827. - PMC - PubMed
    1. Brown JD, Lin CY, Duan Q, Griffin G, Federation AJ, Paranal RM, Bair S, Newton G, Lichtman AH, Kung AL, et al. NF-kappaB Directs Dynamic Super Enhancer Formation in Inflammation and Atherogenesis. Molecular cell 2014 - PMC - PubMed
    1. Bulger M, Groudine M. Functional and mechanistic diversity of distal transcription enhancers. Cell. 2011;144:327–339. - PMC - PubMed
    1. Chapuy B, McKeown MR, Lin CY, Monti S, Roemer MG, Qi J, Rahl PB, Sun HH, Yeda KT, Doench JG, et al. Discovery and characterization of super-enhancer-associated dependencies in diffuse large B cell lymphoma. Cancer cell. 2013;24:777–790. - PMC - PubMed
    1. Chen X, Xu H, Yuan P, Fang F, Huss M, Vega VB, Wong E, Orlov YL, Zhang W, Jiang J, et al. Integration of external signaling pathways with the core transcriptional network in embryonic stem cells. Cell. 2008;133:1106–1117. - PubMed

Publication types

Substances

Associated data