. 2015 Sep 15;142(18):3239-51.
doi: 10.1242/dev.123554. Epub 2015 Jun 12.

Quantification of regenerative potential in primary human mammary epithelial cells

Affiliations

Quantification of regenerative potential in primary human mammary epithelial cells

Jelena R Linnemann et al. Development. .

Abstract

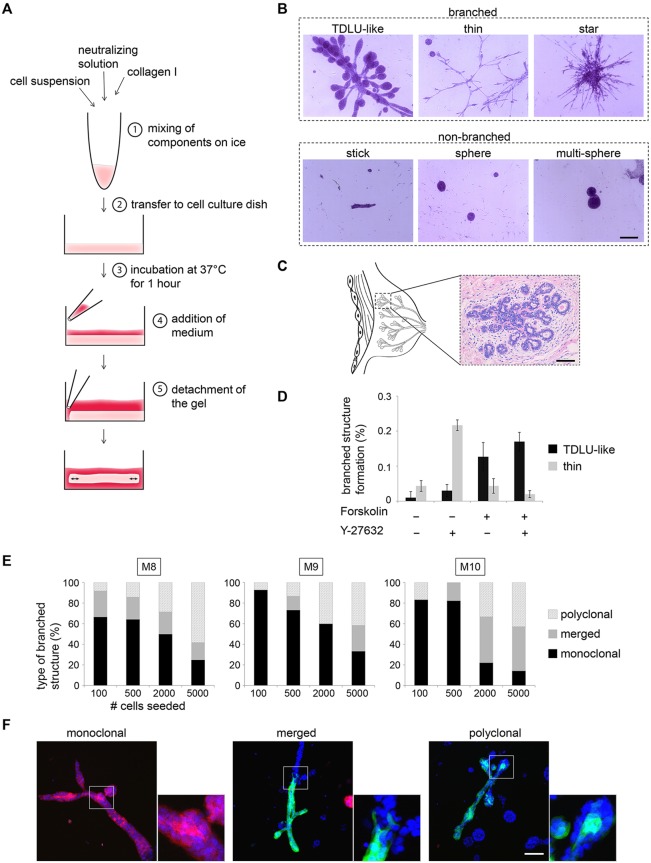
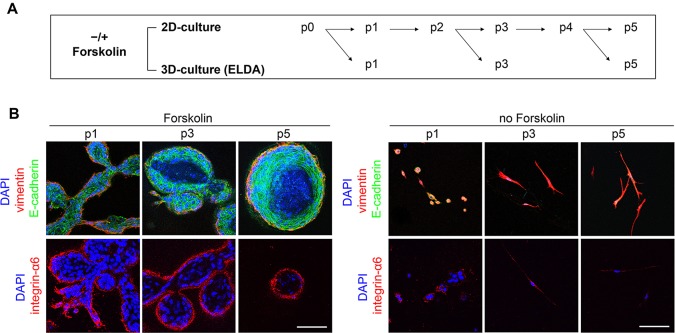
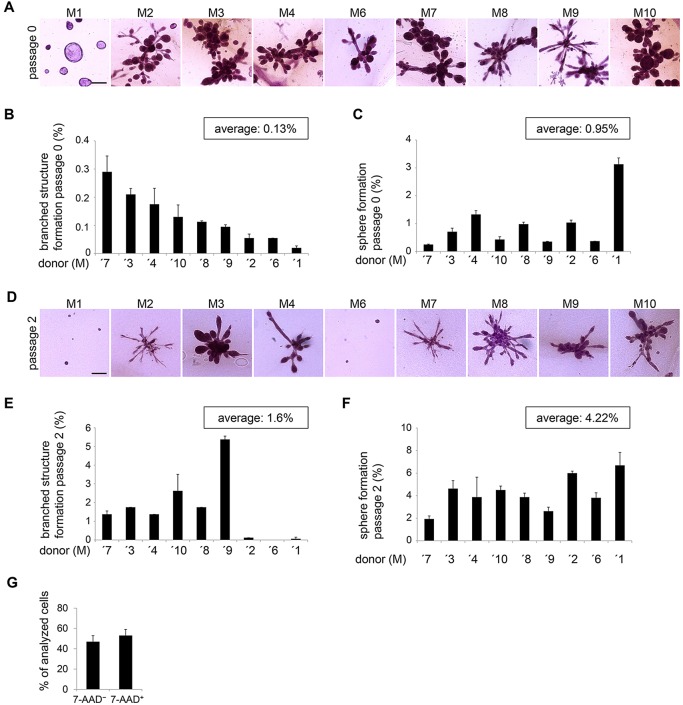
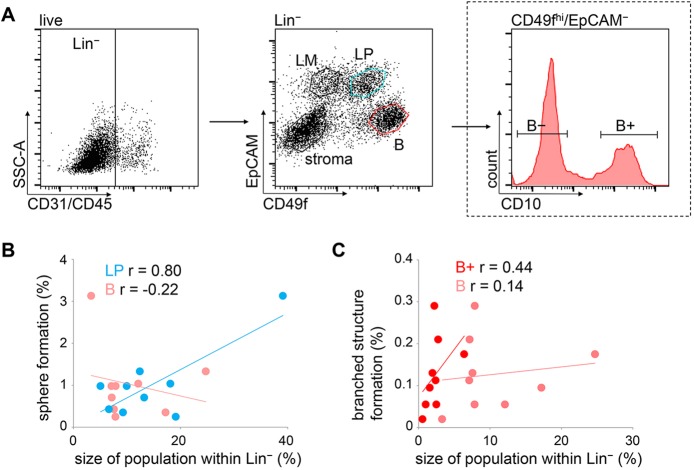
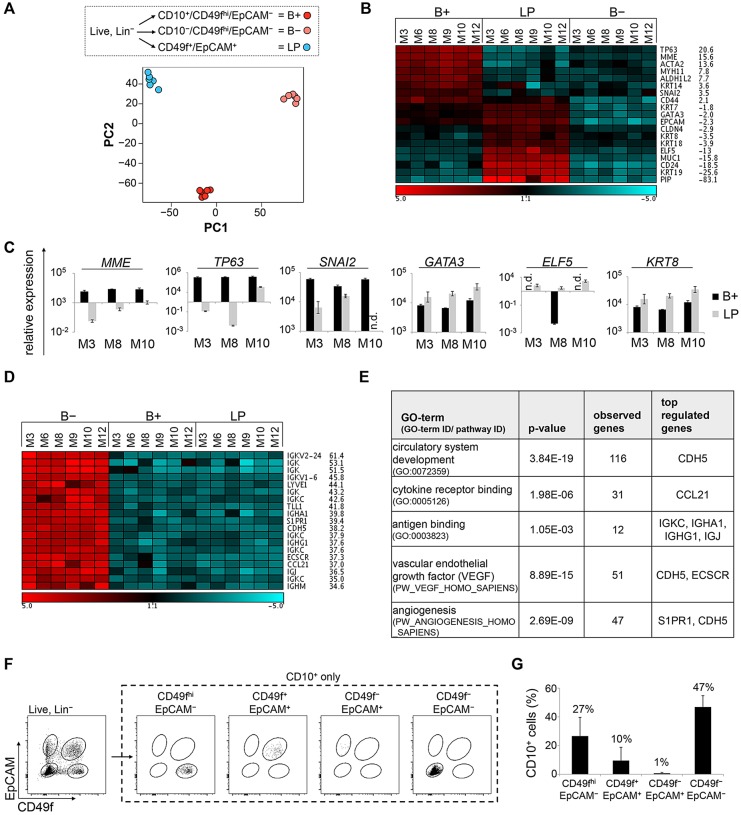
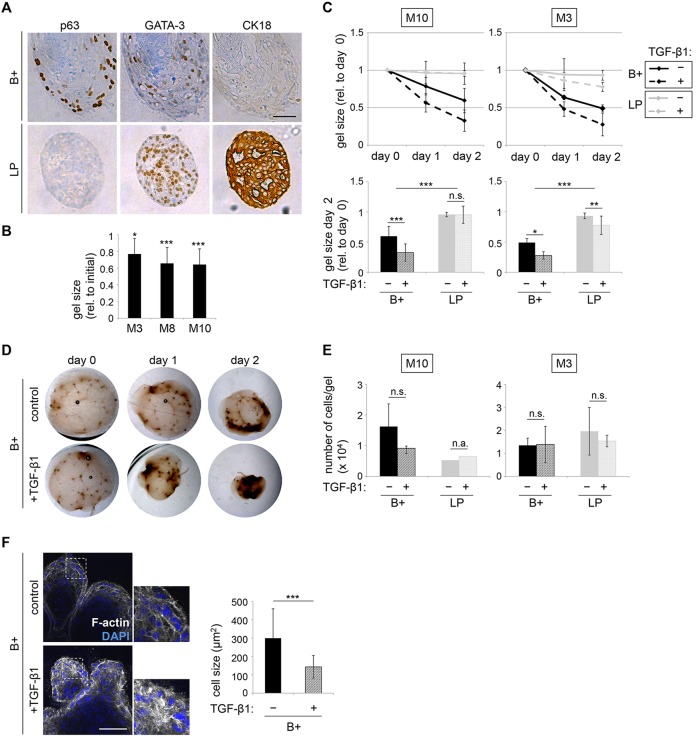
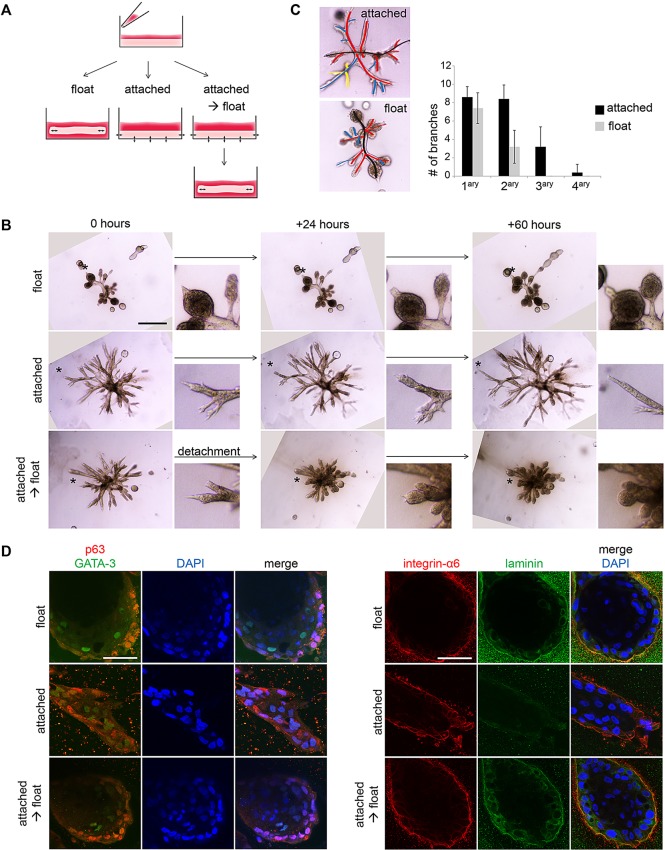
We present an organoid regeneration assay in which freshly isolated human mammary epithelial cells are cultured in adherent or floating collagen gels, corresponding to a rigid or compliant matrix environment. In both conditions, luminal progenitors form spheres, whereas basal cells generate branched ductal structures. In compliant but not rigid collagen gels, branching ducts form alveoli at their tips, express basal and luminal markers at correct positions, and display contractility, which is required for alveologenesis. Thereby, branched structures generated in compliant collagen gels resemble terminal ductal-lobular units (TDLUs), the functional units of the mammary gland. Using the membrane metallo-endopeptidase CD10 as a surface marker enriches for TDLU formation and reveals the presence of stromal cells within the CD49f(hi)/EpCAM(-) population. In summary, we describe a defined in vitro assay system to quantify cells with regenerative potential and systematically investigate their interaction with the physical environment at distinct steps of morphogenesis.

Keywords: Basal; Branching morphogenesis; CD10; Collagen gel; Luminal; Mammary stem cell; Organoid; Primary human mammary epithelial cells; Progenitor cells; Regenerative potential; Terminal ductal-lobular units.


Figures

Fig. 1.
Fig. 1.
Identification of culture conditions promoting generation of TDLU-like structures. (A) Experimental setup: floating collagen gels. (B) Bright-field microscopy: carmine-stained representative images of different types of branched and non-branched structures (donor M8). Scale bar: 200 µm. (C) Bright-field microscopy: Hematoxylin and Eosin-stained section of a terminal ductal lobular unit (TDLU) from a healthy woman. Scale bar: 100 µm. (D) Improvement of culture conditions: one-time treatment with 3 µM Y-27632 at day 0 of culture and continuous treatment with 10 µM forskolin (14 days of culture). Star-like branched structures were not detected. n=3 gels/condition. Structure formation per 100 seeded cells is shown (donor M8). Data are mean±s.d. (E) Quantification of monoclonal, merged and polyclonal structures formed by eGFP, mCherry and unlabeled passage 1 cells (donors M8, M9, M10) in floating collagen I gels: 100, 500, 2000 and 5000 cells were seeded per well (24-well plate). Monoclonal: complete structure eGFP or mCherry positive. Merged: monoclonal structure merged with second structure. Polyclonal: eGFP/mCherry-positive and -negative areas. n≥9 eGFP/mCherry-positive structures/condition. (F) Confocal microscopy: representative images of monoclonal, merged and polyclonal structures as defined in E. Scale bar: 100 µm.
Fig. 2.
Fig. 2.
Maintenance and expansion of TDLU-like structure formation. (A) Experimental setup: freshly isolated HMECs (donor M4) were cultured in 2D±10 µM forskolin for five passages (p), and transferred to floating collagen I gels in limiting dilution at p1, 3 and 5. (B) Confocal microscopy: representative TDLU-like structures after 2D culture (see A). Vimentin (red), E-cadherin (green), integrin-α6 (red), DAPI (blue). Scale bars: 100 µm. Data are mean with 95% confidence intervals (CIs).
Fig. 3.
Fig. 3.
Frequency of TDLU-like structure-forming cells varies between donors and is increased by 2D culture. (A) Bright-field microscopy: carmine-stained representative images of TDLU-like structures from freshly isolated cells of nine donors (M1-M4, M6-M10) in floating collagen I gels. Scale bar: 200 µm. (B) TDLU-like structure formation/100 seeded HMECs, 9 days of culture. n=2 gels/donor. (C) Sphere formation/100 seeded HMECs, 9 days of culture. n=2 gels/donor. (D) Bright-field microscopy: carmine-stained representative images of TDLU-like structures from nine donors (M1-4, M6-M10), 12 days of 2D culture prior transfer to collagen I gels. Scale bar: 200 µm. (E) TDLU-like structure formation/100 seeded HMECs, established in 2D culture (see D), 9 days of culture. n=2 gels/donor. (F) Sphere formation/100 seeded HMECs, established in 2D culture, 9 days of culture. n=2 gels/donor. Data are shown as mean±s.d. (G) Viability by FACS, using 7-AAD: n=10 donors (M1-M10). (B,C,F-H) Data are shown as mean±s.d.
Fig. 4.
Fig. 4.
TDLU-like structure-forming potential is contained within a CD10+/CD49fhi/EpCAM basal population. (A) FACS of freshly isolated HMECs: dead cells (7AAD=live), hematopoietic (CD45+) and endothelial cells (CD31+) were excluded. EpCAM and CD49f were used to depict the following populations in Lin (CD45/CD31): stroma (CD49f/EpCAM­−), luminal mature (LM, CD49f/EpCAM+), luminal progenitors (LP, CD49f+/EpCAM+) and basal (B, CD49fhi/EpCAM). LP and B populations were isolated. The B population was further subdivided into B− (CD10/CD49fhi/EpCAM) and B+ (CD10+/CD49fhi/EpCAM). (B) Linear correlation between sphere formation/100 freshly isolated HMECs and the size of LP within Lin population (blue dots), or the size of the B population (pink dots). One dot per donor. (C) Linear correlation between TDLU-like structure formation/100 freshly isolated HMECs and the size of B+ within Lin population (red dots) or the B population (pink dots). One dot per donor. r, correlation coefficient.
Fig. 5.
Fig. 5.
CD10 staining reveals a stromal component within the CD49fhi/EpCAM population. (A) Gene expression profiling: RNA for microarray analysis derived from three subpopulations (B+, B− and LP, as indicated) using freshly isolated HMECs from six donors (M3, M6, M8, M9, M10, M12). Unsupervised clustering of all samples was followed by principal component analysis (PCA). (B) Heatmap: expression values of up- and downregulated luminal and basal genes in all samples. Fold-change of B+ versus LP expression levels. Red (high) and blue (low) indicates log2 expression values. Scale bar is in log2. (C) RT-PCR: MME/CD10, TP63, SNAI2, GATA3, ELF5 and KRT8 mRNA expression in B+ and LP cells. n=3. (D) Heatmap: expression values of the top 20 significantly (FDR<10%) upregulated genes in B− samples versus B+ samples with corresponding fold-changes. Red (high) and blue (low) indicates log2 expression values. Scale bar is in log2. (E) GO term analyses: selected significantly enriched terms (P<0.01) associated with genes differentially regulated between B− and B+ populations (FDR<10%, FC>3×). (F) Representative flow cytometry analysis showing CD10+ fraction within the four populations defined by CD49f/EpCAM. (G) Quantification of F. Average of 10 donors (M1-M10). n.d., not detectable. (C,G) Data are shown as mean±s.d.
Fig. 6.
Fig. 6.
TDLU-like structures derived from B+ cells recapitulate functional aspects of the mammary gland. (A) Immunohistochemistry: p63, GATA3 and CK18 in representative sections of structures derived from LP or B+ cells (donor M10), fixed at culture day 20. For LP and B+, six and five fields of view were analyzed, respectively. Scale bar: 50 µm. (B) Quantification: gel size at day 13 (M3), day 14 (M8) and day 15 (M10) of culture as a percentage of the size at day 0. n=6 gels (M3, M10) and n=9 gels (M8). (C) Gel contraction: size of gels containing LP or B+ cells (donors M3, M10) at day 12 of culture (indicated as day 0) imaged for 2 days. Gel size plotted relative to day 0. Treatment with 2.0 ng/ml of TGFβ1 at day 0. Lower panel: bar graphs of gel size at day 2 as a percentage of day 0. n=12 gels/condition. (D) Bright-field microscopy: representative images of control and TGFβ1-treated gels containing B+ cells from C. (E) Average number of cells/gel at the end of analysis shown in C. Gels containing LP cells (donor M10) were pooled and counted. (F) Contraction of individual cells. Confocal microscopy (left): B+ cell derived structures (donor M8) were treated with TGFβ1 as in C, and stained with Phalloidin for F-actin (white) and DAPI (blue). Areas outlined are shown at higher magnification on the right. Scale bar: 100 µm. Cell size was determined for 30 cells of three different structures/condition using ImageJ area tool. n.s., not significant; n.a., not applicable. (C,E,F) Data are mean±s.d.
Fig. 7.
Fig. 7.
Matrix compliance in floating collagen gels is required for alveologenesis and luminal differentiation. (A) Experimental layout: freshly isolated HMECs were seeded into collagen I gels, which were immediately detached to float (left) or left attached to the cell culture dish (middle, right). Once branched structures had formed, some attached gels were detached (right). (B) Bright-field microscopy: representative images of HMEC-derived branched structures (donor M8), cultured according to A and imaged for 60 h, starting at day 13 of culture. Smaller images: detail of area indicated by asterisk. Scale bar: 500 µm. (C) Quantification of side branches: representative image with primary, secondary and tertiary side branches indicated by red, blue and yellow lines, respectively. Graph shows the number of side branches/structure in attached and floating collagen gels at day 13 of culture for five structures/condition (donor M8). Data are mean±s.d. (D) Confocal microscopy: representative images of HMEC-derived branched structures (donor M8), cultured according to A,B: p63 (red), GATA3 (green), integrin α6 (red), laminin (green) and DAPI for nuclei (blue). Scale bars: 50 µm.

References

    1. Alitalo A. and Detmar M. (2012). Interaction of tumor cells and lymphatic vessels in cancer progression. Oncogene 31, 4499-4508. 10.1038/onc.2011.602 - DOI - PubMed
    1. Anderson E., Clarke R. B. and Howell A. (1998). Estrogen responsiveness and control of normal human breast proliferation. J. Mammary Gland Biol. Neoplasia 3, 23-35. 10.1023/A:1018718117113 - DOI - PubMed
    1. Asselin-Labat M.-L., Sutherland K. D., Barker H., Thomas R., Shackleton M., Forrest N. C., Hartley L., Robb L., Grosveld F. G., van der Wees J. et al. (2007). Gata-3 is an essential regulator of mammary-gland morphogenesis and luminal-cell differentiation. Nat. Cell Biol. 9, 201-209. 10.1038/ncb1530 - DOI - PubMed
    1. Bachelard-Cascales E., Chapellier M., Delay E., Pochon G., Voeltzel T., Puisieux A., Caron de Fromentel C. and Maguer-Satta V. (2010). The CD10 enzyme is a key player to identify and regulate human mammary stem cells. Stem Cells 28, 1081-1088. 10.1002/stem.435 - DOI - PubMed
    1. Bainer R. and Weaver V. (2013). Cell biology. Strength under tension. Science 341, 965-966. 10.1126/science.1243643 - DOI - PubMed

Publication types

Associated data