. 2015 May;35(10):1686-99.
doi: 10.1128/MCB.01321-14. Epub 2015 Mar 2.

Lipid-overloaded enlarged adipocytes provoke insulin resistance independent of inflammation

Affiliations

Lipid-overloaded enlarged adipocytes provoke insulin resistance independent of inflammation

Jong In Kim et al. Mol Cell Biol. 2015 May.

Abstract

In obesity, adipocyte hypertrophy and proinflammatory responses are closely associated with the development of insulin resistance in adipose tissue. However, it is largely unknown whether adipocyte hypertrophy per se might be sufficient to provoke insulin resistance in obese adipose tissue. Here, we demonstrate that lipid-overloaded hypertrophic adipocytes are insulin resistant independent of adipocyte inflammation. Treatment with saturated or monounsaturated fatty acids resulted in adipocyte hypertrophy, but proinflammatory responses were observed only in adipocytes treated with saturated fatty acids. Regardless of adipocyte inflammation, hypertrophic adipocytes with large and unilocular lipid droplets exhibited impaired insulin-dependent glucose uptake, associated with defects in GLUT4 trafficking to the plasma membrane. Moreover, Toll-like receptor 4 mutant mice (C3H/HeJ) with high-fat-diet-induced obesity were not protected against insulin resistance, although they were resistant to adipose tissue inflammation. Together, our in vitro and in vivo data suggest that adipocyte hypertrophy alone may be crucial in causing insulin resistance in obesity.


Figures

FIG 1
FIG 1
Long-chain fatty acids induce adipocyte hypertrophy. 3T3-L1 adipocytes were differentiated and then cultured for another 6 days with various long-chain fatty acids at the indicated doses (250, 500, and 750 μM). CTL, control (BSA); PA, palmitic acid; SA, stearic acid; OA, oleic acid. (A) Microscopic images were obtained on the indicated days. (B) Oil red O staining of 3T3-L1 adipocytes treated with various fatty acids. (C) Scanning electron microscopy images of OA (500 μM)-treated hypertrophic adipocytes. (D) Nile red staining of lipid-overloaded 3T3-L1 adipocytes (top). The cells were fixed and stained with Nile red to visualize lipid droplets on day 6 after fatty acid treatment, and images were acquired using a confocal microscope. Lipid droplet (LD) volume distribution in lipid-overloaded 3T3-L1 adipocytes (bottom). LD volumes were measured from three-dimensional (3D) reconstructed images using Carl Zeiss ZEN. Scale bars, 20 μm.
FIG 2
FIG 2
SFA-treated adipocytes, but not MUFA-treated adipocytes, promote proinflammatory responses. (A) After treatment of 3T3-L1 adipocytes with various long-chain fatty acids (500 μM), nuclear extracts and cell lysates were subjected to immunoblot analysis. CTL, control (BSA); PA, palmitic acid; SA, stearic acid; OA, oleic acid; TNF-α concentration, 10 ng/ml. (B) mRNA levels of proinflammatory genes were measured by quantitative RT-PCR. Relative mRNA levels were quantified after normalization against cyclophilin. *, P < 0.05 versus CTL cells (Student's t test). (C) Levels of TNF-α, MCP-1, and IL-6 secreted from lipid-overloaded adipocytes. (D) Migration of THP-1 monocytes. THP-1 monocytes were prestained with CellTracker (red) and incubated for 6 h in Transwell plates (8-μm pore) with conditioned medium (top left). Photomicrographs of migrated cells were taken (bottom left). Cell migration was assessed (right). After 3 or 6 days of fatty acid treatment, adipocytes were washed with PBS and incubated with fresh culture medium for 15 h. The conditioned medium was collected for ELISA and Transwell culture. *, P < 0.05 versus CTL cells (Student's t test).
FIG 3
FIG 3
Hypertrophic adipocytes are insulin resistant without any changes in the insulin downstream signaling cascade. 3T3-L1 adipocytes were differentiated and then cultured for another 6 days with various long-chain fatty acids (500 μM). CTL, control (BSA); PA, palmitic acid; SA, stearic acid; OA, oleic acid. (A) Insulin-dependent glucose uptake assays using [14C]deoxyglucose. *, P < 0.05 versus CTL cells (Student's t test). (B) Immunoblot analysis of adipocytes treated for 6 days with long-chain fatty acids, with or without insulin (10 nM). (C) Conditioned medium was collected from adipocytes overloaded with long-chain fatty acids for 6 days and then treated with newly differentiated 3T3-L1 adipocytes (top). Immunoblot analysis of adipocytes treated with conditioned medium (CM) for 48 h, with or without insulin (10 nM) (bottom). (D to F) Differentiated 3T3-L1 adipocytes were treated with palmitic acid (PA; 500 μM), palmitic acid and oleic acid mixture (PA+OA; 250 μM each), and oleic acid (OA; 500 μM). (D) Glucose uptake assays using [14C]deoxyglucose. ***, P < 0.001 versus CTL cells (Student's t test). (E) Immunoblot analysis of adipocytes treated for 6 days with long-chain fatty acids with or without insulin (10 nM) treatment. (F) The mRNA levels of proinflammatory genes were measured by qRT-PCR. Relative mRNA levels were quantified after normalization against cyclophilin. *, P < 0.05; **, P < 0.01; ***, P < 0.001 versus CTL cells (Student's t test).
FIG 4
FIG 4
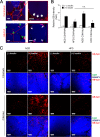
Hypertrophic adipocytes are insulin resistant. 3T3-L1 adipocytes were differentiated and then cultured for another 6 days with various long-chain fatty acids (500 μM). CTL, control (BSA); PA, palmitic acid; SA, stearic acid; OA, oleic acid. (A) Hypertrophic adipocytes challenged with fatty acids were incubated with a Cy3-labeled glucose bioprobe. After a 10-min incubation, insulin was added, and the fluorescence intensity of the glucose bioprobe was monitored every 2 min using a DeltaVision imaging system. Arrows designate relatively small adipocytes. Scale bars, 80 μm. ***, P < 0.001 versus CTL cells (ANOVA). (B) Hypertrophic adipocytes challenged with OA (500 μM; 6 days) were categorized into four groups: (i) S/M-ADs, <40 μm in diameter with multilocular lipid droplets; (ii) L/M-ADs, >40 μm in diameter with multilocular lipid droplets; (iii) S/U-ADs, <40 μm in diameter with uniloculus-like lipid droplets; and (iv) L/U-ADs, >40 μm in diameter with uniloculus-like lipid droplets. (C) Cellular distributions of each categorized cell type were computationally calculated by using ImageJ. (D) Glucose bioprobe fluorescence intensity in each cell type was detected every 2 min using a DeltaVision imaging system (bottom). For a single analysis, 50 images with ∼200 cells were analyzed. ***, P < 0.001 versus CTL cells (ANOVA).
FIG 5
FIG 5
Insulin-stimulated GLUT4 trafficking is impaired in large/uniloculus-like adipocytes. (A to C) 3T3-L1 adipocytes stably expressing myc-GLUT4-mCherry were challenged with various fatty acids (500 μM) for 6 days. The cells were fixed, stained with an anti-Myc antibody (green), and imaged on a total internal reflection fluorescence microscopy (TIRFM) in the presence or absence of insulin (100 nM). CTL, control (BSA); PA, palmitic acid; SA, stearic acid; OA, oleic acid. Scale bars, 20 μm. (A) Schematic drawing illustrating events observed under the TIRF zone. (B) Insulin-induced GLUT4 membrane insertion was examined by using TIRFM in nonpermeabilized cells. Data presented are representative microscopic images of L/U-ADs in each indicated group. (C) 3T3-L1 adipocytes were treated with OA (500 μM) for 6 days. Insulin-induced GLUT4 membrane insertion was examined by using TIRFM in nonpermeabilized cells. Data presented are microscopic images representative of indicated groups. (D) Cellular actin structures were detected by phalloidin staining. After 6 days of OA (500 μM) treatment, 3T3-L1 adipocytes were fixed, permeabilized, and stained with phalloidin-TRITC (red), BODIPY (green), and DAPI (blue). Scale bars, 20 μm. (E) Stable 3T3-L1 adipocytes expressing GLUT4-mCherry were challenged with OA (500 μM) for 6 days. In the presence of insulin, adipocytes were fixed and imaged on a confocal microscope. Scale bars, 20 μm.
FIG 6
FIG 6
TLR4 mutant mice fed a short-term HFD develop systemic insulin resistance. For 1 week, 10-week-old C3H/HeN and C3H/HeJ mice were fed an NCD or HFD. (A) Body weight (BW) gain, epididymal adipose tissue (eAT) mass, and liver mass were measured. (B) Distribution of adipocyte sizes in eAT. (C) mRNA levels of inflammatory genes from eAT were measured by quantitative real-time PCR analysis. Relative mRNA levels were quantified after normalization against cyclophilin. (D and E) Oral glucose tolerance test (D) and area under the curve (AUC) (E) results for all groups. Each bar represents the mean ± standard deviation (SD) for each group of mice (n = 7). *, P < 0.05; ***, P < 0.001; n.s., not significant.
FIG 7
FIG 7
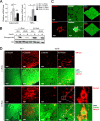
The adipose tissues of TLR4 mutant mice fed a short-term HFD are insulin resistant. Epididymal adipose tissues (eAT) from wild-type control C3H/HeN mice and TLR4 mutant C3H/HeJ mice fed an HFD for 1 week were ex vivo cultured. (A) The eATs of control C3H/HeN mice were incubated with CellTracker (top; red) or the glucose bioprobe (bottom; red) and BODIPY (blue) in the presence of insulin and visualized with confocal microscopy. Scale bars, 10 μm (left) and 5 μm (right; magnified images). (B and C) Insulin-dependent glucose bioprobe uptake assay. Adipose tissues were ex vivo cultured with or without insulin (1 μM). Glucose bioprobe (red) and BODIPY (blue) were incubated for 30 min. (B) The relative glucose bioprobe intensity per cell was analyzed using ImageJ. Each bar represents the mean ± SD for each group of mice (n = 7). *, P < 0.05; n.s., not significant. (C) Glucose bioprobe fluorescence from each group was visualized with confocal microscopy. Data presented are representative microscopic images. Scale bars, 200 μm.
FIG 8
FIG 8
Rosiglitazone-induced, newly differentiated small adipocytes are insulin sensitive. For 1 month, 12-week-old db/+ and db/db mice were treated without or with rosiglitazone (15 mg/kg) by oral gavage. (A) Relative mRNA levels of adiponectin and TNF-α from the epididymal adipose tissues (eAT) of rosiglitazone-treated db/+ and db/db mice. *, P < 0.05; **, P < 0.01. (B) Immunoblot analysis of epididymal adipose tissue (eAT). Phosphorylation of Akt (Ser308) with or without insulin (50 nM) treatment. (C) Whole-mount immunohistochemistry analysis of eATs of rosiglitazone-treated db/+ and db/db mice. Newly differentiated small adipocytes (top) and crown-like structure (bottom). Adipose tissues were stained with CD11b antibody (red), BODIPY (green), and DAPI (blue) (n = 4). Scale bars, 50 μm. (D) Ex vivo glucose bioprobe uptake assay. eATs from rosiglitazone-treated db/+ or db/db mice were ex vivo cultured with or without insulin (1 μM). Glucose bioprobe (red) and BODIPY (green) were incubated for 30 min (n = 4). Data presented are representative microscopic images. Scale bars, 100 μm.
FIG 9
FIG 9
Graphical representation of the process whereby long-chain fatty acid challenge induces adipocyte hypertrophy and lipid droplet unilocularization. Hypertrophied adipocytes with uniloculus-like lipid droplets show decreased GLUT4 translocation to the plasma membrane and disorganized cortical actin structures. Hypertrophy-mediated impairment of GLUT4 translocation results in adipocyte insulin resistance regardless of inflammation.

References

    1. Kershaw EE, Flier JS. 2004. Adipose tissue as an endocrine organ. J Clin Endocrinol Metab 89:2548–2556. doi:10.1210/jc.2004-0395. - DOI - PubMed
    1. Xu A, Wang Y, Keshaw H, Xu LY, Lam KS, Cooper GJ. 2003. The fat-derived hormone adiponectin alleviates alcoholic and nonalcoholic fatty liver diseases in mice. J Clin Invest 112:91–100. doi:10.1172/JCI17797. - DOI - PMC - PubMed
    1. Wang QA, Tao C, Gupta RK, Scherer PE. 2013. Tracking adipogenesis during white adipose tissue development, expansion and regeneration. Nat Med 19:1338–1344. doi:10.1038/nm.3324. - DOI - PMC - PubMed
    1. Martinsson A. 1969. Hypertrophy and hyperplasia of human adipose tissue in obesity. Pol Arch Med Wewn 42:481–486. - PubMed
    1. Weisberg SP, McCann D, Desai M, Rosenbaum M, Leibel RL, Ferrante AW Jr. 2003. Obesity is associated with macrophage accumulation in adipose tissue. J Clin Invest 112:1796–1808. doi:10.1172/JCI19246. - DOI - PMC - PubMed

Publication types

MeSH terms

Associated data