. 2009 Aug;29(15):4067-79.
doi: 10.1128/MCB.01461-08. Epub 2009 May 18.

High-affinity transporters for NAD+ precursors in Candida glabrata are regulated by Hst1 and induced in response to niacin limitation

Affiliations

High-affinity transporters for NAD+ precursors in Candida glabrata are regulated by Hst1 and induced in response to niacin limitation

Biao Ma et al. Mol Cell Biol. 2009 Aug.

Abstract

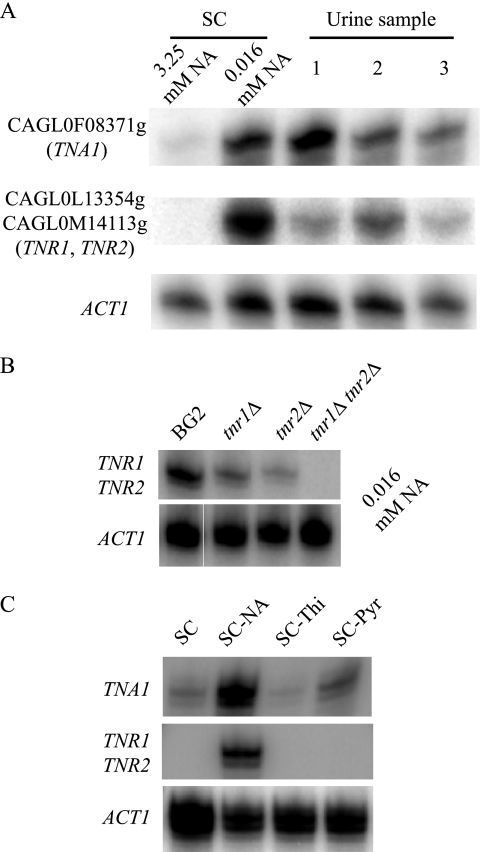
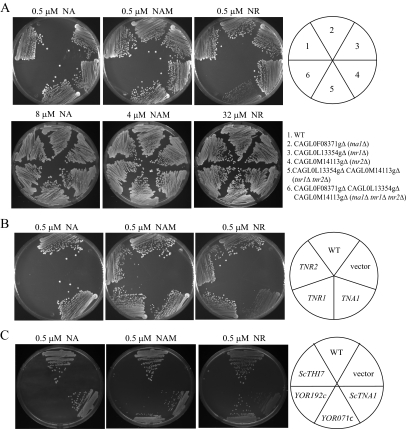
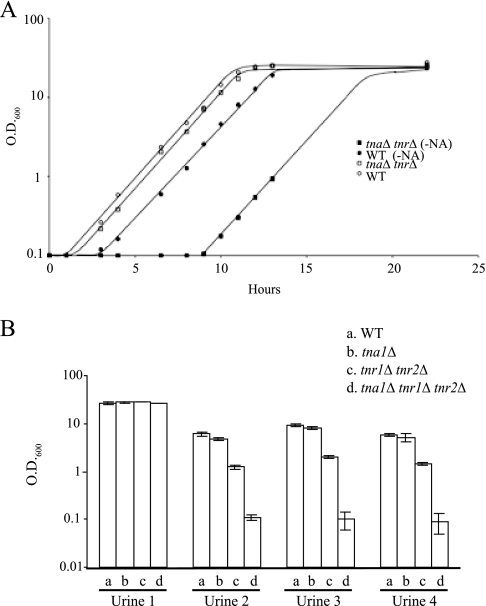
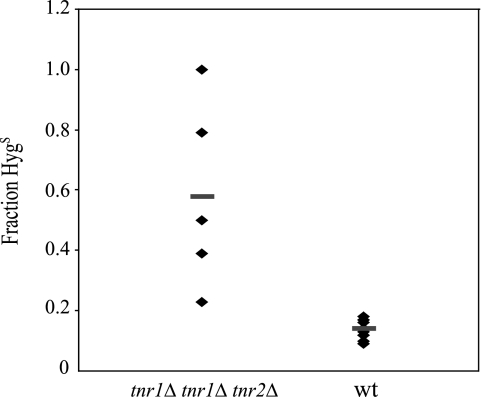
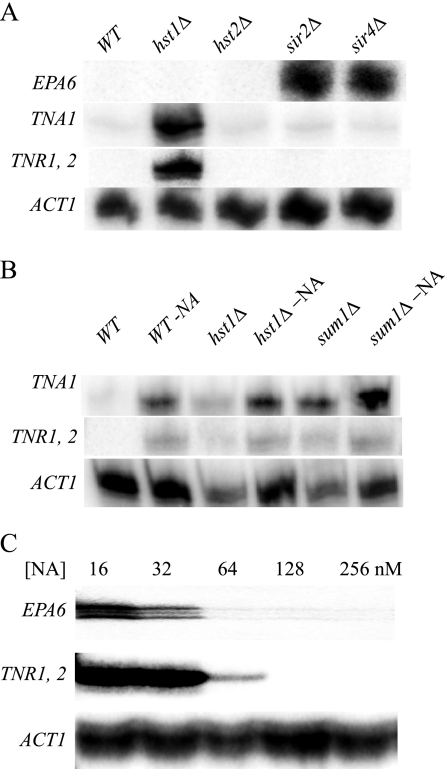
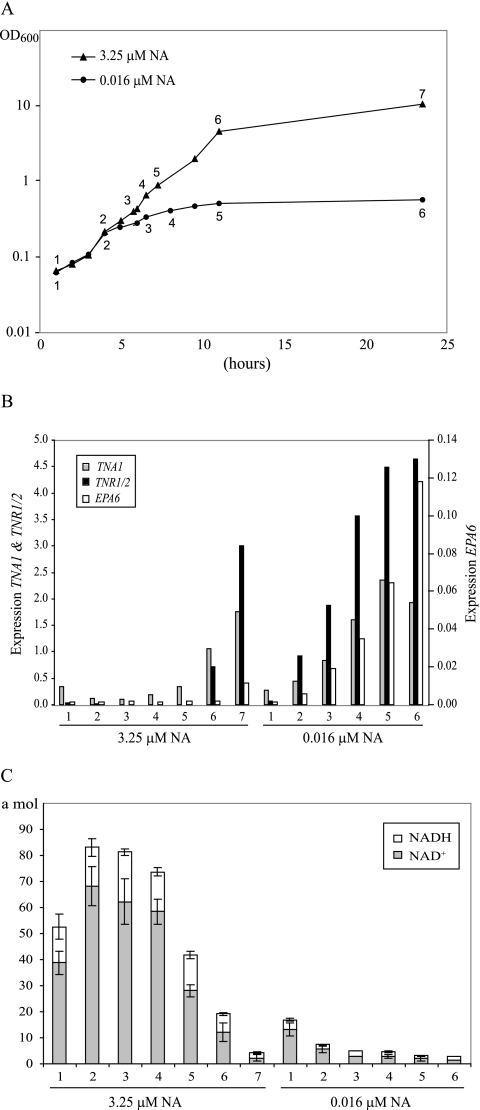
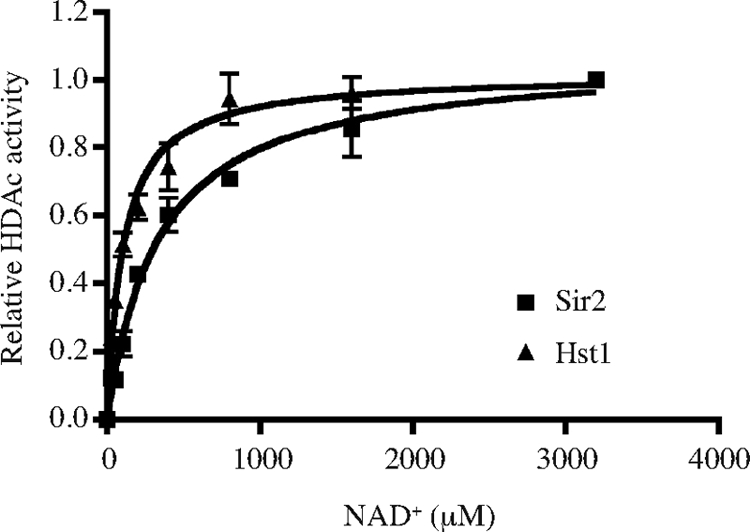
The yeast Candida glabrata is an opportunistic pathogen of humans. C. glabrata is a NAD(+) auxotroph, and its growth depends on the availability of niacin (environmental vitamin precursors of NAD(+)). We have previously shown that a virulence-associated adhesin, encoded by EPA6, is transcriptionally induced in response to niacin limitation. Here we used transcript profiling to characterize the transcriptional response to niacin limitation and the roles of the sirtuins Hst1, Hst2, and Sir2 in mediating this response. The majority of genes transcriptionally induced by niacin limitation are regulated by Hst1, suggesting that it is the primary sensor of niacin limitation in C. glabrata. We show that three highly induced genes, TNA1, TNR1, and TNR2, encode transporters which are necessary and sufficient for high-affinity uptake of NAD(+) precursors. Strikingly, if a tna1 tnr1 tnr2 mutant is starved for niacin, it exhibits an extended lag phase, suggesting a central role for the transporters in restoring NAD(+) homeostasis after niacin limitation. Lastly, we had previously shown that the adhesin encoded by EPA6 is induced during experimental urinary tract infection (UTI); we show here that EPA6 transcriptional induction during UTI is strongly enhanced in the tna1 tnr1 tnr2 mutant strain, implicating the transporters in the growth of C. glabrata during infection.


Figures

FIG. 1.
FIG. 1.
TNA1, TNR1, and TNR2 are transcriptionally induced by niacin limitation. (A) S1 nuclease analysis of TNA1, TNR1/TNR2, and ACT1 transcript levels. RNA prepared from strain BG2 growing in SC medium containing 3.25 μM or 16 nM NA or in three different urine samples. The OD600 of all cultures was 0.5. (B) S1 nuclease analysis of TNA1 and TNR1/TNR2 transcript levels of the BG2, tnr1 mutant (BG1338), tnr2 mutant (BG1335), and tnr1 tnr2 mutant (BG1337) strains. Strains were grown in SC medium containing16 nM NA. The OD600 of all cultures was 0.5. (C) S1 nuclease analysis of TNA1 and TNR1/TNR2 transcript levels of strain BG2 growing in SC medium with limiting amounts of niacin (SC-NA, 16 nM), thiamine (SC-Thi, 6 nM), or pyridoxine (SC-Pyr, 0.19 nM). At these vitamin levels, the terminal OD600 of all of the cultures was 1.5.
FIG. 2.
FIG. 2.
Growth of tna1, tnr1, and tnr2 mutant strains is compromised at low concentrations of NAD+ vitamin precursors. (A) Growth of six strains on medium with 0.5 μM NA, NAM, or NR as the sole source of NAD+. The relevant genotypes of the strains are wild type (WT; strain BG2), tna1 (BG1441), tnr1 (BG1338), tnr2 (BG1335), tnr1 tnr2 (BG1337), and tna1 tnr1 tnr2 (BG1447). The cells are able to grow equally well if supplemented with excess NAD+ precursors (8 μM NA, 4 μM NAM, and 32 μM NR; at concentrations of one-half of these levels, growth of the relevant transporter mutants is compromised relative to that of the wild type). (B) Complementation of the growth defect of tna1 tnr1 tnr2 mutants. Strain1442 was transformed with an empty expression vector or with vectors expressing TNA1, TNR1, or TNR2, and growth was assessed on SC plates containing 0.5 μM NA, NAM, or NR. (C) The tna1 tnr1 tnr2 mutant C. glabrata strain was transformed with plasmids expressing S. cerevisiae ORFs YGR260w (TNA1), YOR192c (THI72), YOR071c (NRT1), and YLR237w (THI7). These strains were plated on SC-URA-NA plates supplemented with 0.5 μM NA, NAM, or NR.
FIG. 3.
FIG. 3.
Growth of the tna1 tnr1 tnr2 mutant strain is compromised after starvation for NAD+ precursors. (A) Wild-type (WT; BG2) and tna1 tnr1 tnr2 mutant (BG1447) strains in SC liquid medium containing 8 μM NA. The strains were inoculated from overnight cultures grown in SC or SC-NA medium for 48 h. Note that there is no difference in growth rate once the cells are growing; however, the lag phase for starved cells is approximately 2 h for BG2 and 9 h for BG1447. (B) Growth of transporter mutant strains BG1441 (tna1Δ), BG1337 (tnr1Δ tnr2Δ), and BG1447 (tna1Δ tnr1Δ tnr2Δ) in human urine cultures. Cultures were inoculated at an OD600 of 0.1 and grown overnight at 30°C.
FIG. 4.
FIG. 4.
Flp1 recombinase reporter measuring expression of EPA6 during UTI. The Hygs phenotype (expressed as a percentage of the total number of cells recovered) of two C. glabrata strains, 1697 (wild type [wt]) and 1700 (tna1 tnr1 tnr2 mutant), is shown. Organisms were recovered from kidney tissue 7 days after transurethral inoculation. Individual diamonds correspond to cells recovered from one animal; each the bar represents the mean.
FIG. 5.
FIG. 5.
(A) Sirtuin regulation of TNA1, TNR1, and TNR2. S1 nuclease analysis of TNA1, TNR1/TNR2, and ACT1 transcript levels. RNA was prepared from five strains, the wild type (WT; BG2) and the hst1 (BG1218), hst2 (BG1219), sir2 (BG1216), sir4 (BG1217) mutants. RNA was prepared from cells grown in SC medium containing 3.25 μM NA to an OD600 of 0.5. (B) S1 nuclease analysis of TNA1, TNR1/TNR2, and ACT1 transcript levels. RNA was prepared from three strains, the wild type (BG2) and the hst1 (BG1218) and sum1 (BG1462) mutants, growing in SC medium containing 3.25 μM (lanes 1, 3, and 5) or 16 nM (lanes 2, 4, and 6) NA. The OD600 of all of the cultures was 0.5. (C) S1 nuclease analysis of EPA6, TNR1/TNR2, and ACT1 transcript levels. Strain BG2 was grown in SC medium containing the indicated initial concentrations of NA; all cultures were grown to an OD600 of 0.5.
FIG. 6.
FIG. 6.
Analysis of C. glabrata grown in SC medium containing 3.25 or 0.016 μM NA. (A) The values are time points for the collection of cells used in quantitative reverse transcription-PCR and for analysis of intracellular NAD+ and NADH concentrations. (B) Quantitative reverse transcription-PCR analysis of TNA1, TNR1/2, and EPA6 transcript levels. RNA was prepared from wild-type C. glabrata grown in SC medium containing 3.25 or 0.016 μM NA. The indicated time points correspond to those in panel A. The transcript levels of TNR1/TNR2, TNA1, and EPA6 were normalized to levels of HHT2, a gene with constant expression levels under normal and low-NA conditions based on our microarray analysis. (C) Intracellular NAD+ and NADH concentrations. Cells grown in SC medium containing 0.016 μM NA have very low levels of intracellular NAD+ and NADH compared with those of cells grown in SC containing 3.25 μM NA. Error bars represent the standard error of the mean.
FIG. 7.
FIG. 7.
Apparent Kms of C. glabrata Hst1 and Sir2. Relative HDAC activities of rHst1 (squares) and rSir2 (triangles) are shown. Bacterially expressed and purified Hst1 and Sir2 were incubated with [3H]acetylated histone H4 peptide (40,000 cpm/reaction mixture) in the presence of different concentrations of NAD+. The plots are from assays carried out in triplicate. The measured Km of rHst1 is approximately 118 ± 19 μM, and that of rSir2 is approximately 339 ± 40 μM.

References

    1. Anderson, R. M., K. J. Bitterman, J. G. Wood, O. Medvedik, H. Cohen, S. S. Lin, J. K. Manchester, J. I. Gordon, and D. A. Sinclair. 2002. Manipulation of a nuclear NAD+ salvage pathway delays aging without altering steady-state NAD+ levels. J. Biol. Chem. 27718881-18890. - PubMed
    1. Bedalov, A., M. Hirao, J. Posakony, M. Nelson, and J. A. Simon. 2003. NAD+-dependent deacetylase Hst1p controls biosynthesis and cellular NAD+ levels in Saccharomyces cerevisiae. Mol. Cell. Biol. 237044-7054. - PMC - PubMed
    1. Belenky, P., K. L. Bogan, and C. Brenner. 2007. NAD+ metabolism in health and disease. Trends Biochem. Sci. 3212-19. - PubMed
    1. Belenky, P. A., T. G. Moga, and C. Brenner. 2008. Saccharomyces cerevisiae YOR071C encodes the high affinity nicotinamide riboside transporter Nrt1. J. Biol. Chem. 2838075-8079. - PubMed
    1. Bieganowski, P., and C. Brenner. 2004. Discoveries of nicotinamide riboside as a nutrient and conserved NRK genes establish a Preiss-Handler independent route to NAD+ in fungi and humans. Cell 117495-502. - PubMed

Publication types

MeSH terms

Associated data