DICER1 and microRNA regulation in post-traumatic stress disorder with comorbid depression
- PMID: 26632874
- PMCID: PMC4686835
- DOI: 10.1038/ncomms10106
DICER1 and microRNA regulation in post-traumatic stress disorder with comorbid depression
Erratum in
-
Corrigendum: DICER1 and microRNA regulation in post-traumatic stress disorder with comorbid depression.Nat Commun. 2016 Mar 3;7:10958. doi: 10.1038/ncomms10958. Nat Commun. 2016. PMID: 26936533 Free PMC article. No abstract available.
Abstract
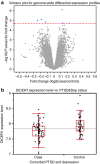
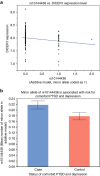
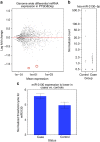
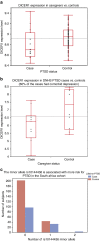
DICER1 is an enzyme that generates mature microRNAs (miRNAs), which regulate gene expression post-transcriptionally in brain and other tissues and is involved in synaptic maturation and plasticity. Here, through genome-wide differential gene expression survey of post-traumatic stress disorder (PTSD) with comorbid depression (PTSD&Dep), we find that blood DICER1 expression is significantly reduced in cases versus controls, and replicate this in two independent cohorts. Our follow-up studies find that lower blood DICER1 expression is significantly associated with increased amygdala activation to fearful stimuli, a neural correlate for PTSD. Additionally, a genetic variant in the 3' un-translated region of DICER1, rs10144436, is significantly associated with DICER1 expression and with PTSD&Dep, and the latter is replicated in an independent cohort. Furthermore, genome-wide differential expression survey of miRNAs in blood in PTSD&Dep reveals miRNAs to be significantly downregulated in cases versus controls. Together, our novel data suggest DICER1 plays a role in molecular mechanisms of PTSD&Dep through the DICER1 and the miRNA regulation pathway.
Figures


References
-
- Kessler R. C. Posttraumatic stress disorder: the burden to the individual and to society. J. Clin. Psychiatry 61, 4–12 (2000). - PubMed
-
- Hidalgo R. B. & Davidson J. R. Posttraumatic stress disorder: epidemiology and health-related considerations. J. Clin. Psychiatry 61, 5–13 (2000). - PubMed
-
- Sullivan P. F., Fan C. & Perou C. M. Evaluating the comparability of gene expression in blood and brain. Am. J. Med. Genet. B Neuropsychiatr. Genet. 141b, 261–268 (2006). - PubMed
Publication types
MeSH terms
Substances
Associated data
- Actions
- Actions
Grants and funding
- R56 MH071537/MH/NIMH NIH HHS/United States
- R01 DA022720/DA/NIDA NIH HHS/United States
- IK2 CX000601/CX/CSRD VA/United States
- R01 MH071537/MH/NIMH NIH HHS/United States
- R21 MH098662/MH/NIMH NIH HHS/United States
- P01 GM099568/GM/NIGMS NIH HHS/United States
- R01 MH094757/MH/NIMH NIH HHS/United States
- RC1MH088283/MH/NIMH NIH HHS/United States
- R01 MH096764/MH/NIMH NIH HHS/United States
- F32 MH101976/MH/NIMH NIH HHS/United States
- RC1 MH088283/MH/NIMH NIH HHS/United States
- MH071537/MH/NIMH NIH HHS/United States
- P2C HD050924/HD/NICHD NIH HHS/United States
- MH096764/MH/NIMH NIH HHS/United States
- DA022720/DA/NIDA NIH HHS/United States
LinkOut - more resources
Full Text Sources
Other Literature Sources
Medical
Molecular Biology Databases

