. 2015 Sep 17;525(7569):399-403.
doi: 10.1038/nature14906. Epub 2015 Aug 26.

Integrator mediates the biogenesis of enhancer RNAs

Affiliations

Integrator mediates the biogenesis of enhancer RNAs

Fan Lai et al. Nature. .

Abstract

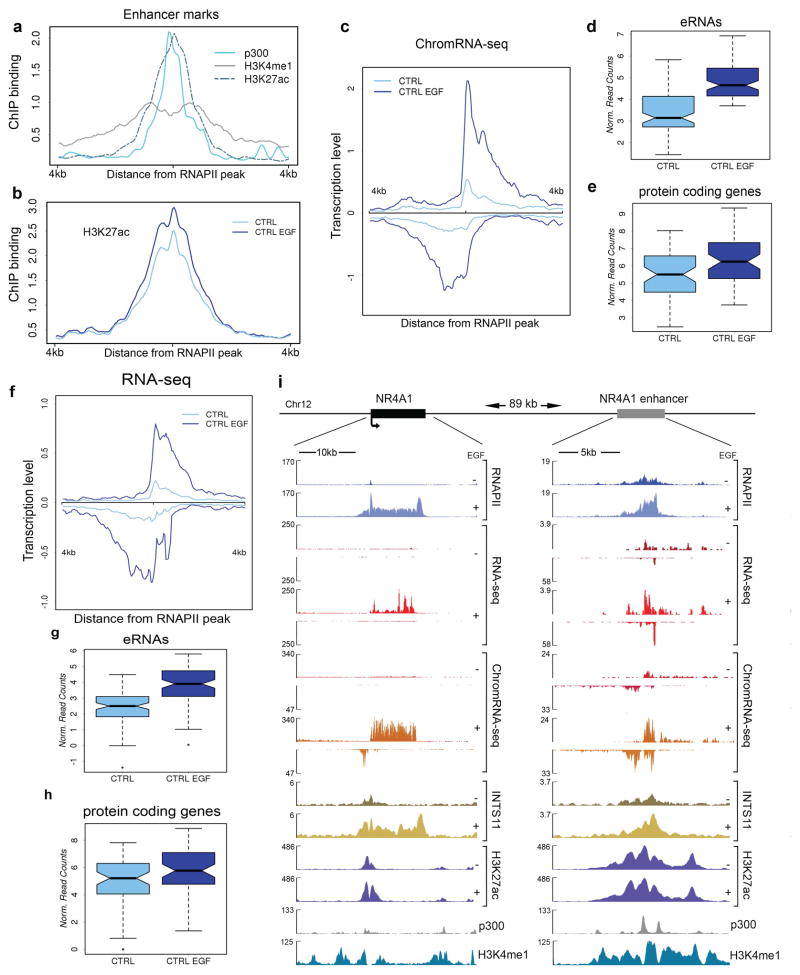
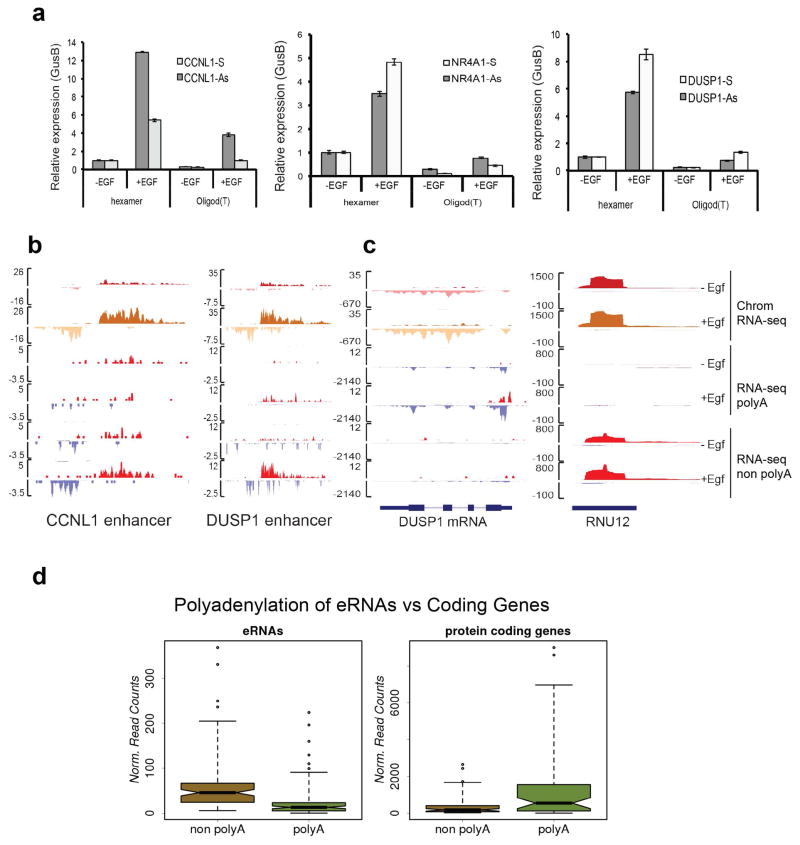
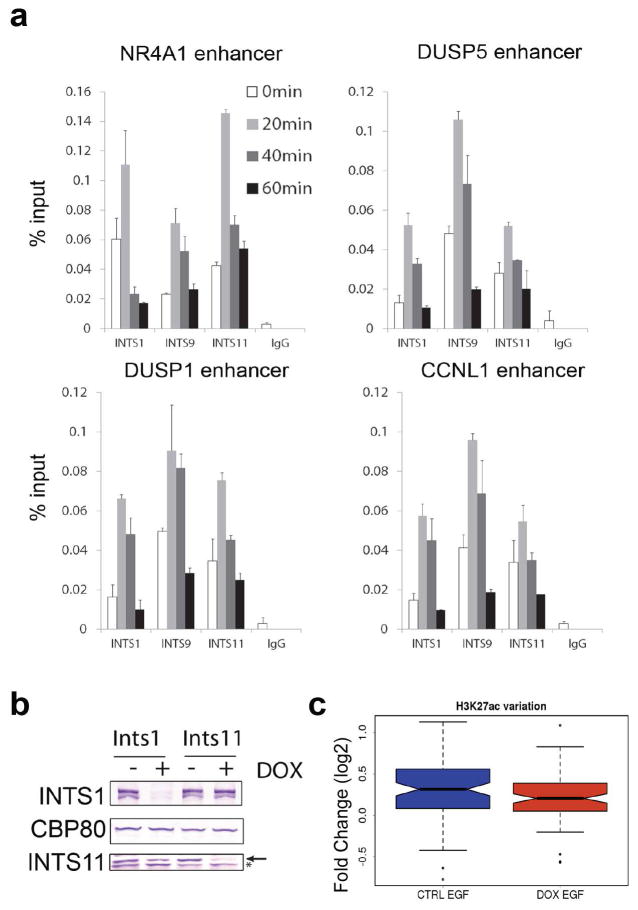
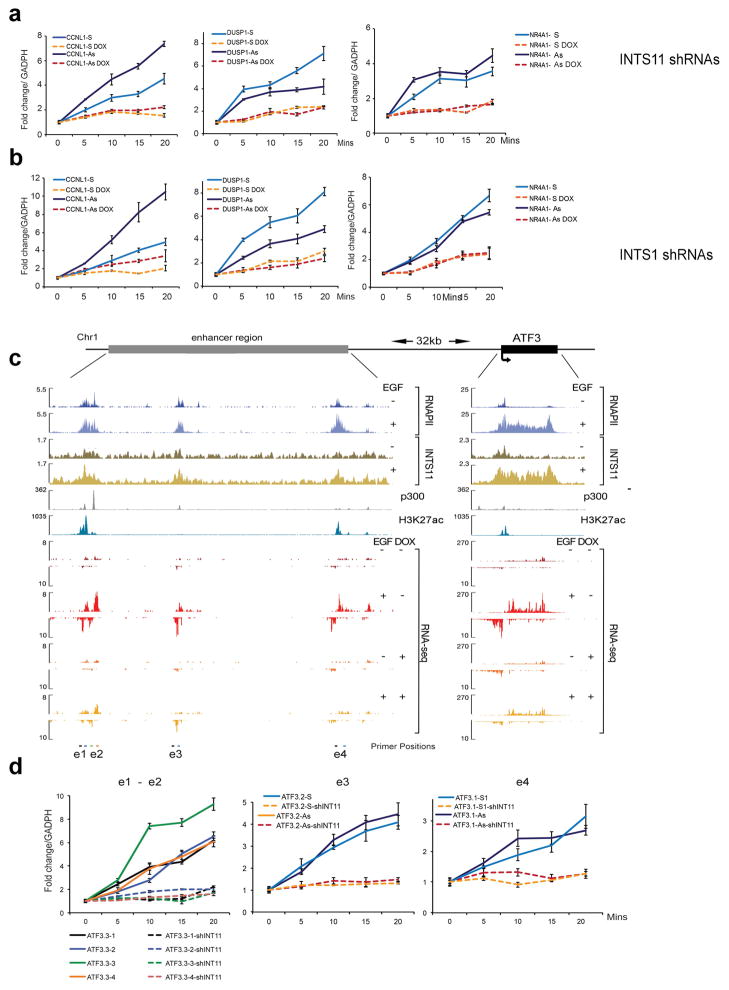
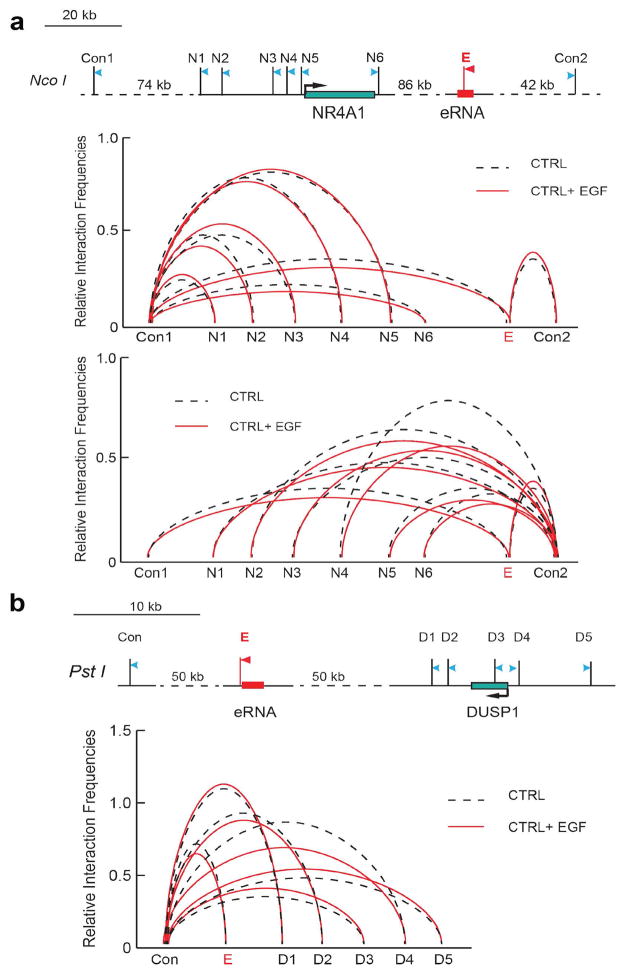
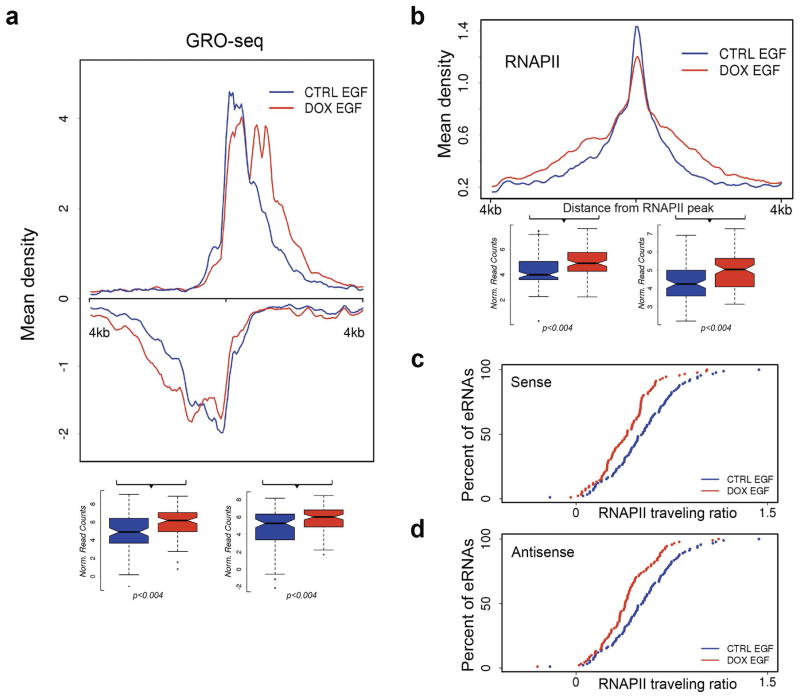
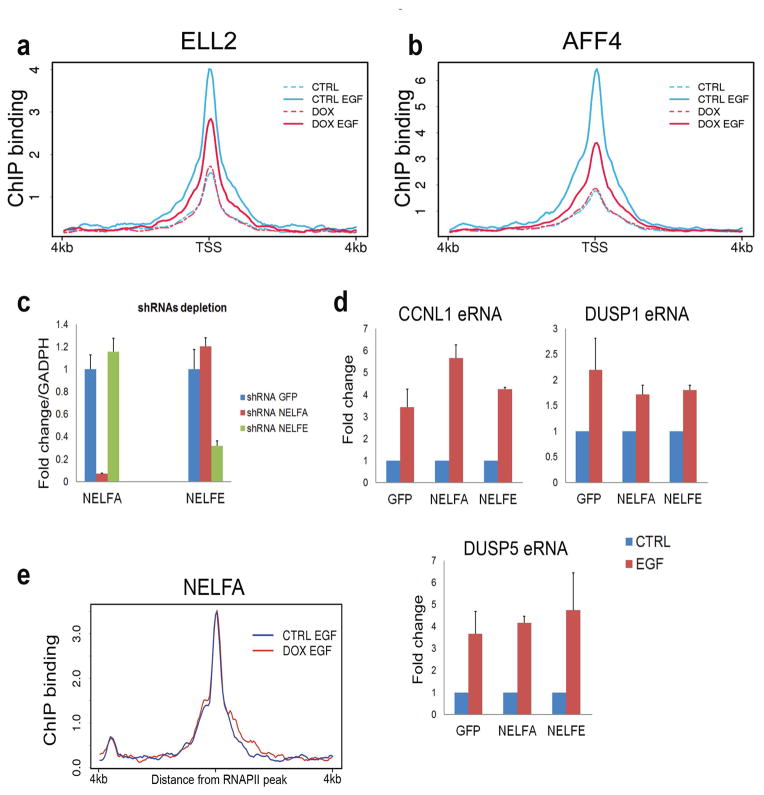
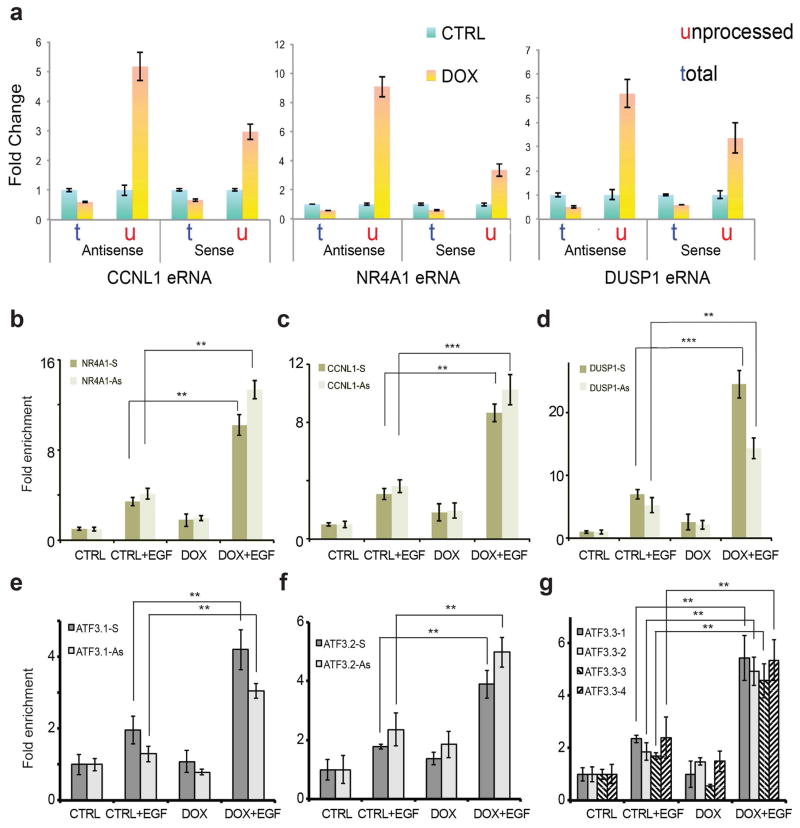
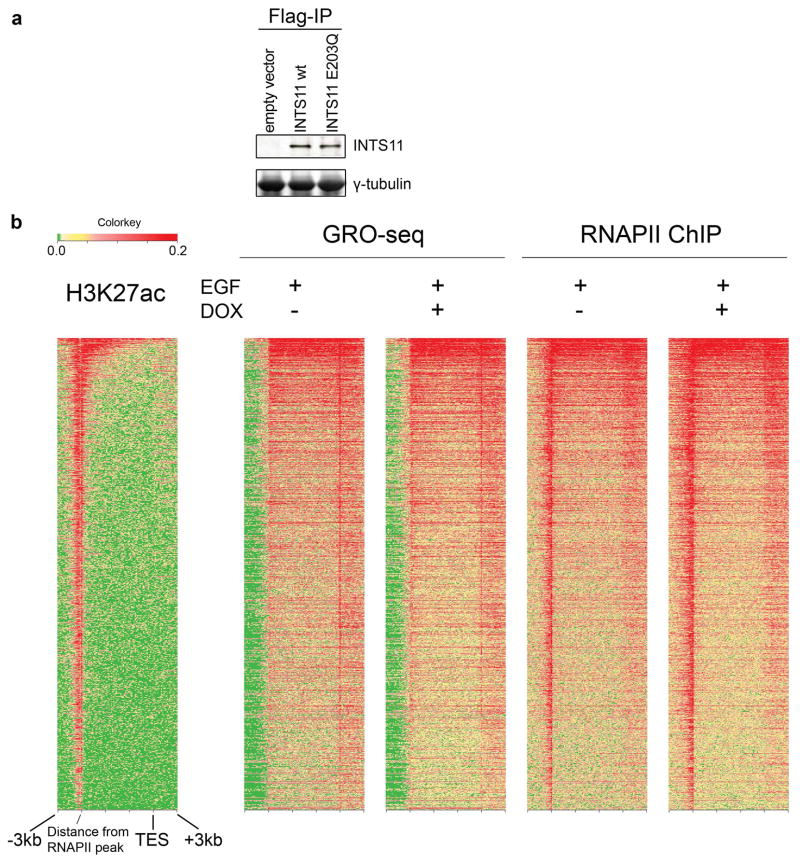
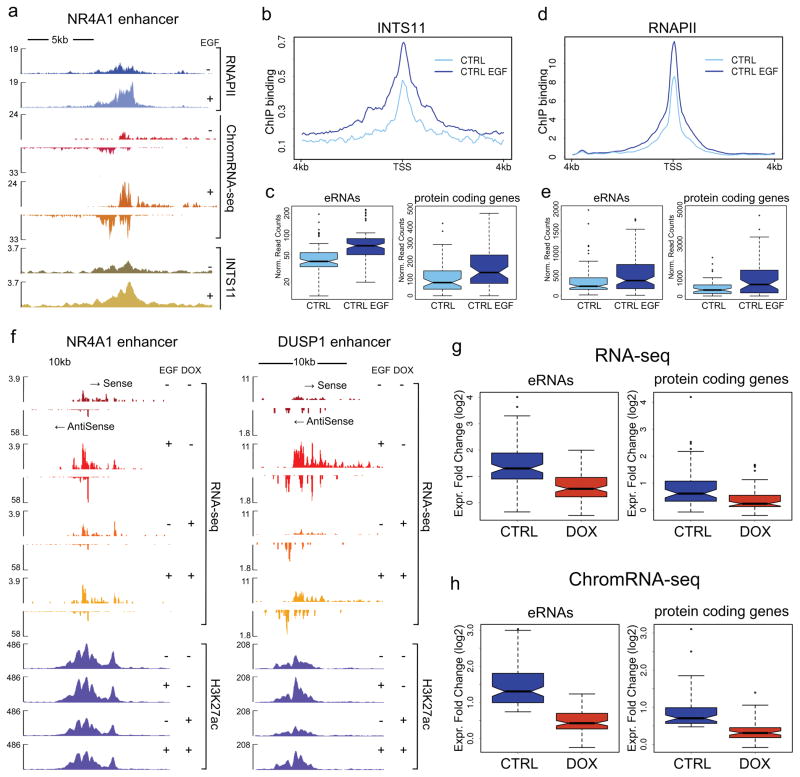
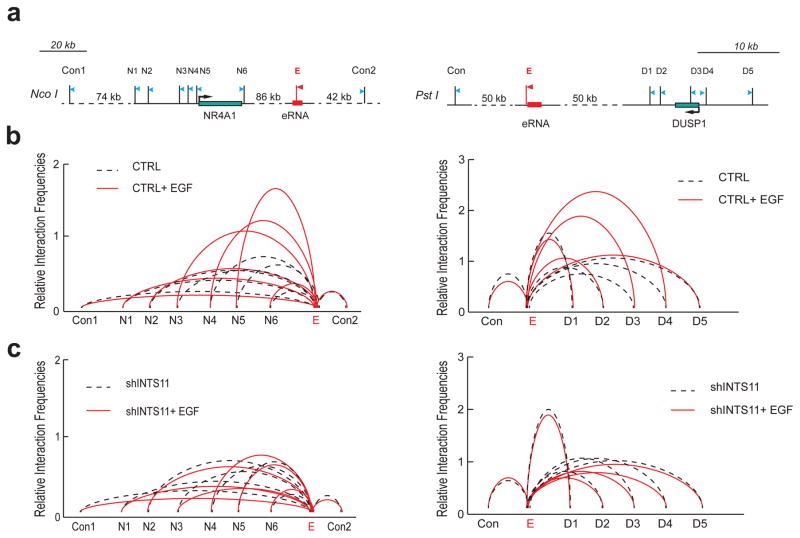
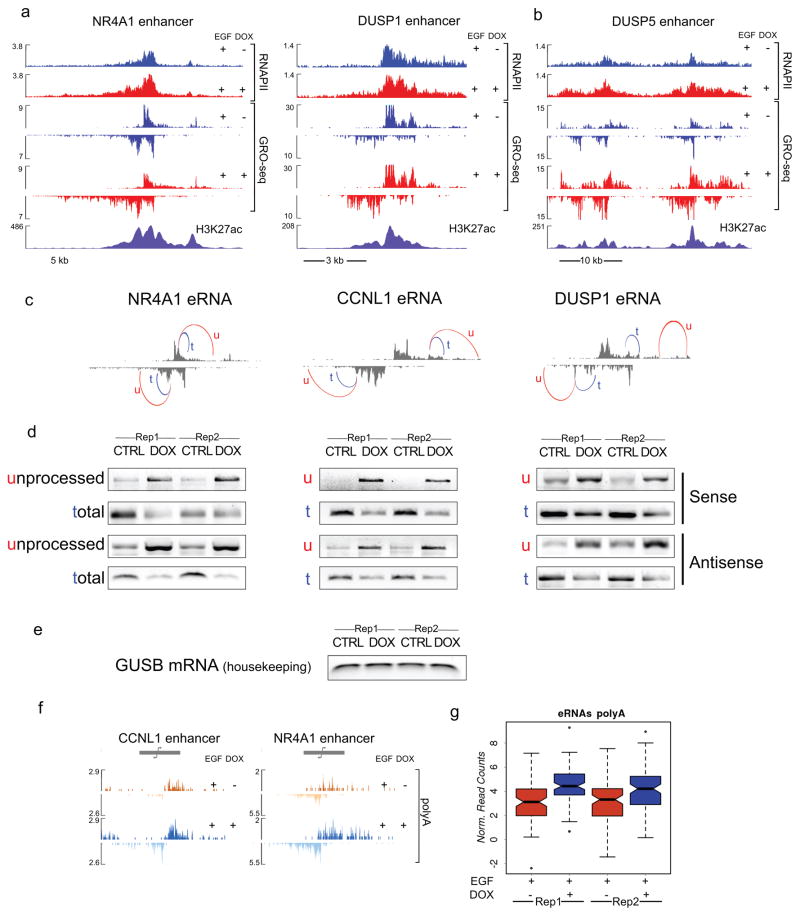
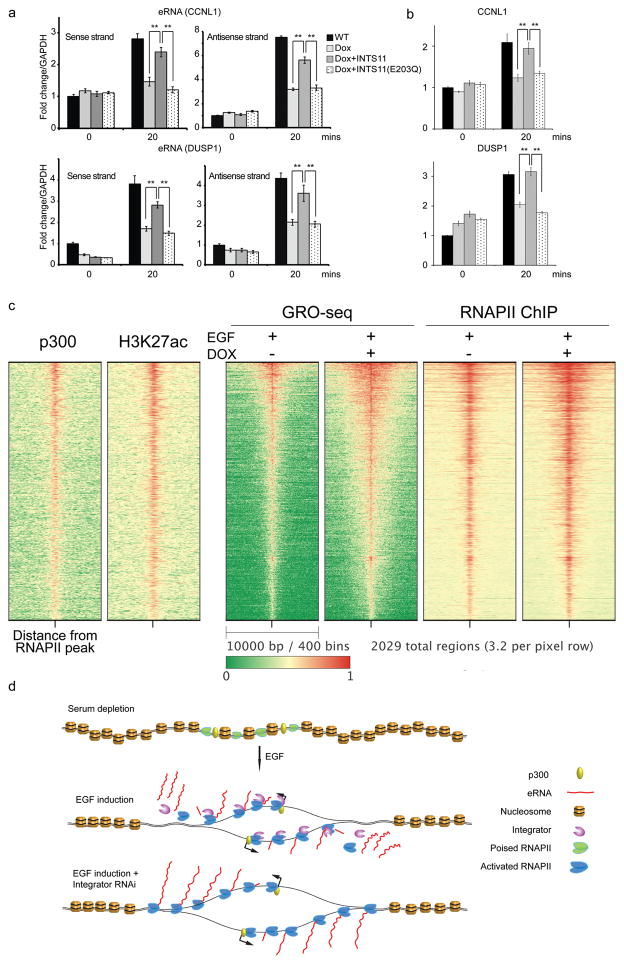
Integrator is a multi-subunit complex stably associated with the carboxy-terminal domain (CTD) of RNA polymerase II (RNAPII). Integrator is endowed with a core catalytic RNA endonuclease activity, which is required for the 3'-end processing of non-polyadenylated, RNAPII-dependent, uridylate-rich, small nuclear RNA genes. Here we examine the requirement of Integrator in the biogenesis of transcripts derived from distal regulatory elements (enhancers) involved in tissue- and temporal-specific regulation of gene expression in metazoans. Integrator is recruited to enhancers and super-enhancers in a stimulus-dependent manner. Functional depletion of Integrator subunits diminishes the signal-dependent induction of enhancer RNAs (eRNAs) and abrogates stimulus-induced enhancer-promoter chromatin looping. Global nuclear run-on and RNAPII profiling reveals a role for Integrator in 3'-end cleavage of eRNA primary transcripts leading to transcriptional termination. In the absence of Integrator, eRNAs remain bound to RNAPII and their primary transcripts accumulate. Notably, the induction of eRNAs and gene expression responsiveness requires the catalytic activity of Integrator complex. We propose a role for Integrator in biogenesis of eRNAs and enhancer function in metazoans.


Conflict of interest statement

The authors declare no competing financial interests.

Figures

Extended data Figure 1
Extended data Figure 1. Identification eRNAs responsive to EGF
a, We identified 91 EGF-responsive enhancer regions in HeLa cells. We annotated extragenic RNAPII sites (see Methods) and used the middle of the RNAPII peak as an anchor to display average profiles of p300, H3K27ac and H3K4me1 (data from the ENCODE project). The profiles represent the mean read density of ChIP-seq data. The 91 loci display a typical enhancer signature, with enrichment of p300 and H3K27ac around the TSS and a broader decoration by H3K4me1. b, Profiles of H3K27ac were obtained from ChIP-seq analysis of HeLa cells before and after 20 minutes of EGF induction. Mean read density was normalized to sequencing depth. c, EGF stimulates bi-directional transcription from 91 enhancer regions. We displayed the mean read density obtained from strand-specific sequencing of the chromatin-bound RNA fraction (ChromRNA-seq). Normalized read density (RPKM) was calculated from RNA-seq data for 91 eRNAs. d, and 57 neighboring protein coding genes. e, that responded to EGF stimulation (FC>1.6) and mapped within 500 kb from an EGF-responsive eRNA. f, Average profiles of ChromRNA-seq data at 91 enhancer loci (mean density of reads, normalized to total read number). g–h, Boxplot of 91 eRNAs before and after treatment with EGF shows the average increase of transcription 20 minutes after stimulation (p<0.001), matched by an increase in the neighboring protein coding genes (p<0.02). i, NR4A1 is activated by EGF in HeLa cells: RNAPII and INTS11 are recruited to the NR4A1 locus after 20 min of stimulation, with concomitant accumulation of reads from RNA-seq and ChromRNA-seq. A neighboring eRNA locus also exhibit increased transcription along with RNAPII and INTS11 recruitment. Sequencing tracks are visualized in BigWig format and aligned to the hg19 assembly of the UCSC Genome Browser.
Extended Data Figure 2
Extended Data Figure 2. EGF-induced eRNAs are predominantly non-polyadenylated
a, We examined transcription at three enhancers adjacent to EGF-responsive genes CCNL1, NR4A1 and DUSP1. Total RNA samples were collected before and after EGF induction. Reverse transcription was performed with random hexamer primer or oligo d(T) primer. Each eRNA strand was analyzed by Real time PCR with specific primers. Error bars represent ± standard error of the mean (SEM, n=3 biological independent experiments). P<0.01 by two-sided t-test. b–c, RNA-seq was performed on the polyadenylated and non-polyadenylated fraction of total RNA. RNA-seq tracks were visualized in BigWig format and aligned to the hg19 assembly of the UCSC Genome Browser. CCNL1 and DUSP1 enhancers were displayed (b) along with a polyadenylated control (DUSP1 protein coding locus) and a non polyadenylated transcript (snRNA U12) (c). All EGF-induced eRNAs and protein coding genes (RefSeq hg19) were examined for their average RPKM throughout the entire locus. d, We compared polyadenylation levels of 225 eRNAs and 150 protein coding genes (2 fold induction upon EGF, RPKM calculated from ChromRNA-seq data previously described. The boxplot shows predominance of nonpolyadenylated transcripts mapping to eRNA loci, as opposed to transcripts encoding for RefSeq genes.
Extended Data Figure 3
Extended Data Figure 3. The Integrator Complex is recruited to enhancers upon EGF stimulation
a, qChIP analysis of Integrator occupancy using INTS11, INTS1 and INST9 antibodies at four eRNA loci. Data were collected during a time course of EGF induction in HeLa cells (0, 20, 40 and 60 minutes). Error bars represent ± standard error of the mean (SEM, n=3 biological independent experiments). P<0.01 by two-sided t-test. b, Depletion of INST1 and INST11 protein levels in tet-inducible HeLa clones. The arrow indicates the INTS11 specific signal, the asterisk shows a non specific band. c, Fold change of H3K27 acetylation (0min/20min EGF) before (CTRL) and after (DOX) depletion of INTS11. Data were calculated from read density of ChIP-seq experiments across EGF-induced enhancers. Depletion of Integrator significantly affects EGF-dependent increase in H3K27ac (p<0.05).
Extended Data Figure 4
Extended Data Figure 4. Depletion of Integrator impairs activation of eRNAs by EGF
a–b, Activation of eRNAs near DUSP1, CCNL1 and NR4A1 genes were assayed by qRT-PCR in three independent experiments, using an INTS11 (a) or a INTS1 (b) inducible shRNA clones. Transcription was followed throughout a 20 min time-course experiment. Each eRNA was amplified with two different sets of specific primers to analyze both strands, dashed lines indicate treatment with doxycycline (DOX) to induce shRNAs. Data at every time point are reported as fold change (EGF/non induced). Error bars represent ± SEM (n=3 biological independent experiments), P<0.01 by two-sided t-test. c, Schematic representation of ATF3 and its super enhancer region located 30kb upstream (top). Snapshots of ChIP-seq and RNA-seq tracks show EGF-dependent recruitment of RNAPII and INTS11 at the ATF3 locus and at several upstream enhancers. Depletion of INTS11 nearly abolished transcription of eRNAs and ATF3 mRNA. d, Real time RT-PCR analysis of the ATF3 super enhancer region upon depletion of INTS11. qPCR analysis was performed before and 5, 10, 15, 20 minutes after EGF treatment with strand specific primer sets (indicated below the RNA-seq tracks in panel c). Error bars represent ± SEM (n=3 biological independent experiments), P<0.01 by two-sided t-test.
Extended Data Figure 5
Extended Data Figure 5. Chromatin conformation capture at Control loci
a, 3C analysis of NR4A1 promoter and control sites. Con1 site lies 74kb upstream of NR4A1 protein coding gene and Con2 site is located 42kb downstream of enhancer site. There are no looping events between either control sites with the NR4A1 promoter region after EGF induction. b, Similarly, no looping events were detected between the promoter of DUSP1 and a downstream control site (Con). All data were averaged from three independent experiments, p<0.01 by two-sided t-test.
Extended Data Figure 6
Extended Data Figure 6. Integrator plays a role in eRNA termination
a, Mean density profiles of GRO-seq data at 91 EGF-induced enhancers. Data are presented as strand-specific mean read density, centered at the middle of the RNAPII peak and normalized to sequencing depth. The underlying box plots were used to quantify the enrichment of GRO-seq reads at the 3′ end of both eRNA transcripts (2kb window, centered 1kb downstream of the RNAPII peak). b, RNAPII profiling at 91 enhancers after INTS11 depletion shows accumulation of ChIP-seq reads towards the 3′ end. Data are presented as mean read density, centered at the middle of the RNAPII peak and normalized to sequencing depth. Box plots represent the enrichment of RNAPII reads of both eRNA transcripts (2kb window, centered 1kb downstream of the RNAPII peak). RNAPII significantly accumulated (p<0.004) after depletion of INTS11. c–d, RNAPII traveling ratio at enhancers was measured as the ratio between RNAPII density close to the transcription start site (the surrounding 300bp) and 3kb downstream. Given the bidirectional nature of transcription at enhancers, traveling ratio was calculated for both sense (c) and antisense (d) transcripts.
Extended Data Figure 7
Extended Data Figure 7. Analysis of super elongation complex at enhancers
a–b, Metagene analysis on 91 eRNA loci shows the effect of EGF stimulation and INTS11 depletion on the recruitment of the ELL2 (a) and AFF4 (b) subunits of the Super Elongation Complex (SEC). SEC was recruited to enhancers upon EGF stimulation. Depletion of Integrator somewhat decreases AFF4 and ELL2 recruitment. Data were visualized as mean read density, normalized to sequencing depth, across 8kb surrounding the center of enhancers. c, To investigate the role of the Negative Elongation Factor (NELF) in induction of eRNAs we infected HeLa cells with lentiviral shRNAs against NELFA, NELFE and a control GFP. Quantitative RT-PCR analysis shows the extent of NELF depletion 72h after infection. Error bars represent ± SEM (n=3 biological independent experiments), P<0.01 by two-sided t-test. d, Depletion of two different NELF subunits does not significantly impact activation of EGF-responsive eRNAs. Data represent fold change of induction (EGF/not induced) after 20 minutes of stimulation and were normalized against GUSB expression. Error bars represent ± SEM (n=3 biological independent experiments), P<0.01 by two-sided t-test. e, ChIP-seq analysis of NELFA before and after depletion of INTS11. Metagene analysis shown mean read density (normalized to sequencing depth) across 91 eRNAs. NELF occupancy at enhancers was not affected by depletion of Integrator.
Extended Data Figure 8
Extended Data Figure 8. Integrator depletion causes accumulation of unprocessed eRNAs and prevents release of RNAPII
a, Termination of eRNAs was examined with quantitative RT-PCR. Primer pairs were designed to amplify a portion of the enhancer transcript detected in normal condition (t, total) or a longer template further extending into the 3′ of the enhancer region (u, unprocessed). Q-PCR analysis was performed before (CTRL) and after (DOX) depletion of INTS11 at three eRNAs (sense and antisense strand), after stimulation with EGF. In the absence of INTS11, we observed accumulation of unprocessed eRNA, suggestive of a termination defect. Error bars represent ± SEM (n=3 biological independent experiments), P<0.01 by two-sided t-test. Release of eRNA transcripts from RNA polymerase was investigated by means of RNAPII immunoprecipitation following UV-cross link (UV-RIP). b–d, After RNAPII immuno-precipitation, eRNAs near DUSP1, CCNL1 and NR4A1 genes were assayed by qRT-PCR and showed increased association with RNAPII in the absence of Integrator. Each eRNA was detected by two different sets of specific primers (Sense and Antisense). Error bars represent ± SEM (n=3 biological independent experiments). *P<0.01, **P<0.01, ***P<0.001 by two-sided t-test. e–g, RNAPII UV-RIP analysis was also performed on several eRNAs from the ATF3 super-enhancer. qRT-PCR on the RNA recovered after immunoprecipitation shows increased association between RNAPII and eRNAs in the absence of Integrator. Each eRNA was detected by two different sets of specific primers (Sense and Antisense). Error bars represent ± SEM (n=3 three independent experiments). **P<0.01 by two-sided t-test.
Extended Data Figure 9
Extended Data Figure 9. Distribution of RNAPII and nascent RNAs across protein coding genes
a, Expression level of exogenous INTS11 wild type (wt) and its catalytic mutant (E203Q). Nuclear extracts were subjected to Flag immunoprecipitation and probed with a polyclonal antibody raised against the C-terminus of INTS11. b, Heatmap of nascent RNA (GRO-seq) and RNAPII ChIP-seq across the 2,000 most active genes in HeLa cells. Gene loci were analyzed for their entire gene body, with 3 additional kilobases on both ends. H3K27ac data from ENCODE is shown on the left, genes are ranked according to the intensity of RNAPII signal. Depletion of Integrator does not appear to affect termination at protein coding genes.
Figure 1
Figure 1. Integrator mediates induction of eRNAs
a, EGF induction of an enhancer in the vicinity of the NR4A1 gene (see Extended Data Fig. 1i). RNAPII and INTS11 are recruited to the enhancer after 20 min of stimulation and eRNAs are transcribed bi-directionally from the locus (as revealed by deep sequencing of chromatin-associated RNA, ChromRNA-seq). b, Average profile of Integrator recruitment to 91 EGF-responsive enhancers. c, Increased Integrator occupancy at enhancers and their corresponding protein coding genes (mean density was calculated as follows: 6kb surrounding the peak of RNAPII for eRNAs; from −0.5kb to + 2.5kb for coding genes; p<0.001). d, Average profile of RNAPII upon EGF treatment at enhancers. e, Increased RNAPII occupancy following EGF stimulation at enhancers and their corresponding protein coding genes (p<0.005). f, Inducible knockdown of INTS11 (DOX) dramatically reduces steady state levels of eRNAs (as measured by total RNA-seq). Data were obtained using a tet-inducible shRNA system, stably transduced in HeLa cells. Acetylation of H3K27 is also shown. g–h, Average expression levels of 91 eRNAs and their neighboring (<500kb) 57 protein coding genes indicate a significant impairment of activation. Box plots represent the expression fold change (log2) before and after EGF treatment in normal conditions (CTRL) and upon depletion of Integrator (DOX) (t-test, p<0.0005 for all panels). Fold change of RPKM values was calculated from RNA-seq (f) and ChromRNA-seq (g) data.
Figure 2
Figure 2. Integrator is required for enhancer-promoter interaction
a, Diagrams of NR4A1 (left) and DUSP1 (right) genomic regions with their respective enhancers (shown in red). The arrows depict the position of primers for detection of chromatin looping and the stick bars indicate enzyme digestion sites (named N1-6 and D1-5). E refers to the anchor primer at the enhancer sites, control sites are also indicated. b, Looping events between the promoter region of NR4A1 and its enhancer were detected at N3, N4 and N5 sites after EGF induction (left). A similar interaction was also captured between sites D3 and D4 of DUSP1 promoter and its downstream enhancer after EGF induction (right). c, Knockdown of Integrator abolished chromosomal looping events at both NR4A1 and DUSP1 sites. The interaction frequency between the anchoring points and the distal fragments were determined by Real-time PCR and normalized to BAC templates. All sites were assayed in three independent experiments (p<0.01, two-sided t-test). Control anchors are displayed in Extended Data Fig. 5.
Figure 3
Figure 3. Integrator plays a role in termination of eRNAs
a, RNAPII dynamics was analyzed by ChIP-Seq and GRO-Seq at the enhancer regions adjacent to NR4A1, DUSP1 and b, at the super-enhancer upstream of DUSP5. c, 3′-end cleavage of eRNAs was examined with semi-quantitative PCR. Primer pairs were designed to amplify a portion of the enhancer transcript as detected in the control GRO-seq experiment (t, total) or a longer template further extending into the 3′ of the enhancer region (u, unprocessed). d, PCR analysis was performed in 2 independent replicates, before (CTRL) and after (DOX) depletion of INTS11 at three eRNAs (sense and antisense strand). e, The housekeeping gene GUSB was used as a cDNA loading control. f, Polyadenylation of eRNAs increases after depletion of Integrator at DUSP1 and CCNL1 enhancer loci. The polyadenylated fraction of RNA from whole cell lysates was sequenced after EGF stimulation, before and after depletion of INTS11 (DOX). g, Box plot shows significant increase in polyadenylated RNA reads (p<0.001) across the entire set of EGF responsive enhancers.
Figure 4
Figure 4. Integrator plays a global role in enhancer regulation
a, Ectopic expression of wild type INTS11, and not its catalytic mutant (E203Q) following Integrator depletion can rescue eRNA induction by EGF. b, A similar rescue was observed for wild type INTS11 on the target protein coding genes. Real time PCR analysis was performed on CCNL1 and DUSP1 eRNAs and their corresponding mRNAs before and after EGF stimulation. Each eRNA was assayed with two sets of primers. Error bars represent ± SEM (n=3 biological independent experiments), **P<0.01 by two-sided t-test. c, The heatmap showcases 2,029 enhancer regions identified using RNAPII extragenic loci enriched in H3K27 acetylation (see Extended Methods). Enhancers were centered at the middle of the RNAPII peak and ranked by transcription activity (GRO-seq). The distribution of p300 and H3K27ac are consistent with a group of active enhancers. Upon Integrator depletion nascent RNA reads and RNAPII profiles spread beyond the normal 3′ end of eRNAs. d, Model for the role of Integrator at eRNAs. Stimulation of serum-starved cells with EGF triggers recruitment of RNAPII and Integrator to enhancer sites and induces bi-directional transcription of non-polyadenylated eRNAs. Upon EGF stimulation Integrator navigates the enhancers along with RNAPII to promote endonucleolytic cleavage of nascent transcripts leading to release of the mature eRNAs. Depletion of Integrator elicits a cleavage defect leading to faulty termination, which results in extended eRNA transcripts and accumulation of RNAPII.

References

    1. Baillat D, et al. Integrator, a multiprotein mediator of small nuclear RNA processing, associates with the C-terminal repeat of RNA polymerase II. Cell. 2005;123:265–276. doi: 10.1016/j.cell.2005.08.019. - DOI - PubMed
    1. Wang KC, et al. A long noncoding RNA maintains active chromatin to coordinate homeotic gene expression. Nature. 2011;472:120–124. doi: 10.1038/nature09819. - DOI - PMC - PubMed
    1. Orom UA, et al. Long noncoding RNAs with enhancer-like function in human cells. Cell. 2010;143:46–58. doi: 10.1016/j.cell.2010.09.001. - DOI - PMC - PubMed
    1. De Santa F, et al. A large fraction of extragenic RNA pol II transcription sites overlap enhancers. PLoS biology. 2010;8:e1000384. doi: 10.1371/journal.pbio.1000384. - DOI - PMC - PubMed
    1. Kim TK, et al. Widespread transcription at neuronal activity-regulated enhancers. Nature. 2010;465:182–187. doi: 10.1038/nature09033. - DOI - PMC - PubMed

Publication types

MeSH terms

Associated data