. 2015 Sep 8:6:8198.
doi: 10.1038/ncomms9198.

Integrin-linked kinase regulates the niche of quiescent epidermal stem cells

Affiliations

Integrin-linked kinase regulates the niche of quiescent epidermal stem cells

Jessica Morgner et al. Nat Commun. .

Abstract

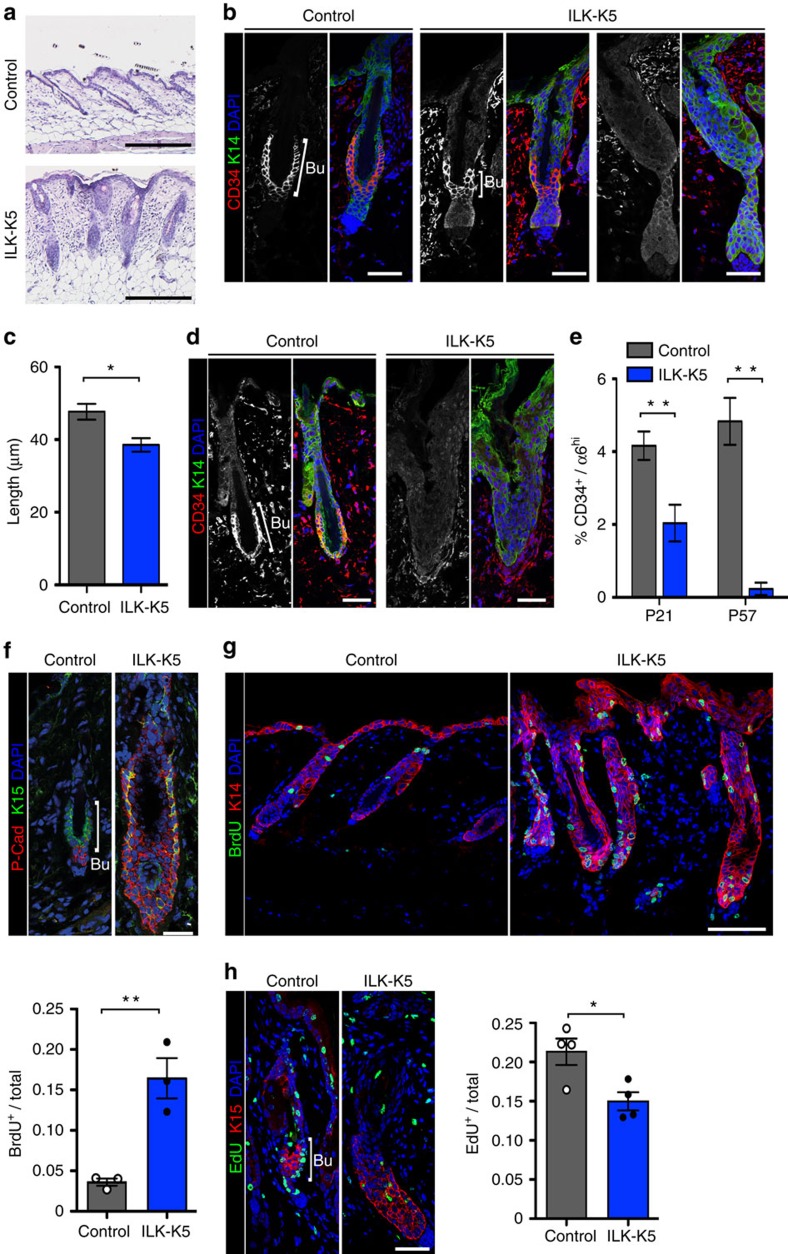
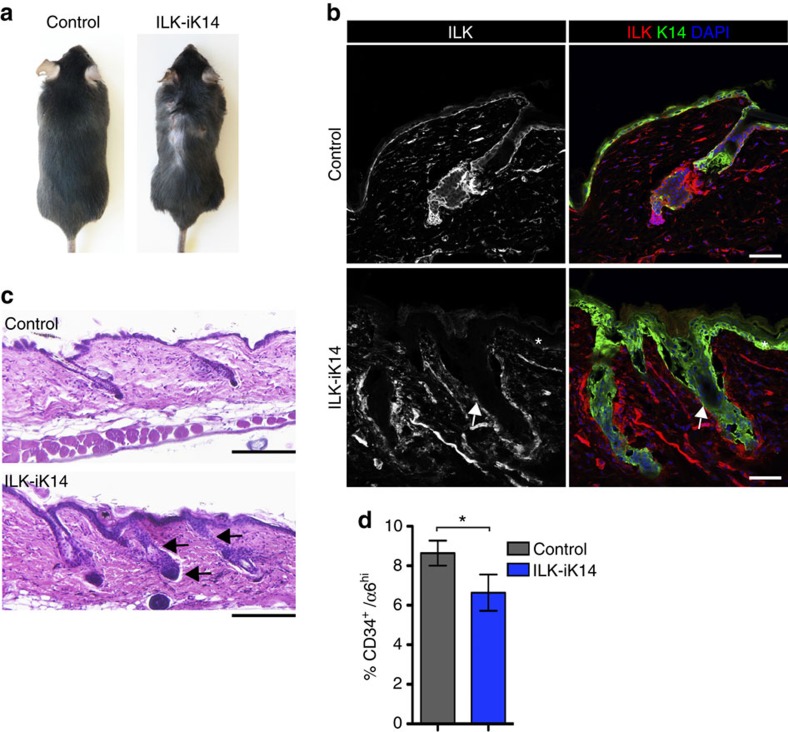
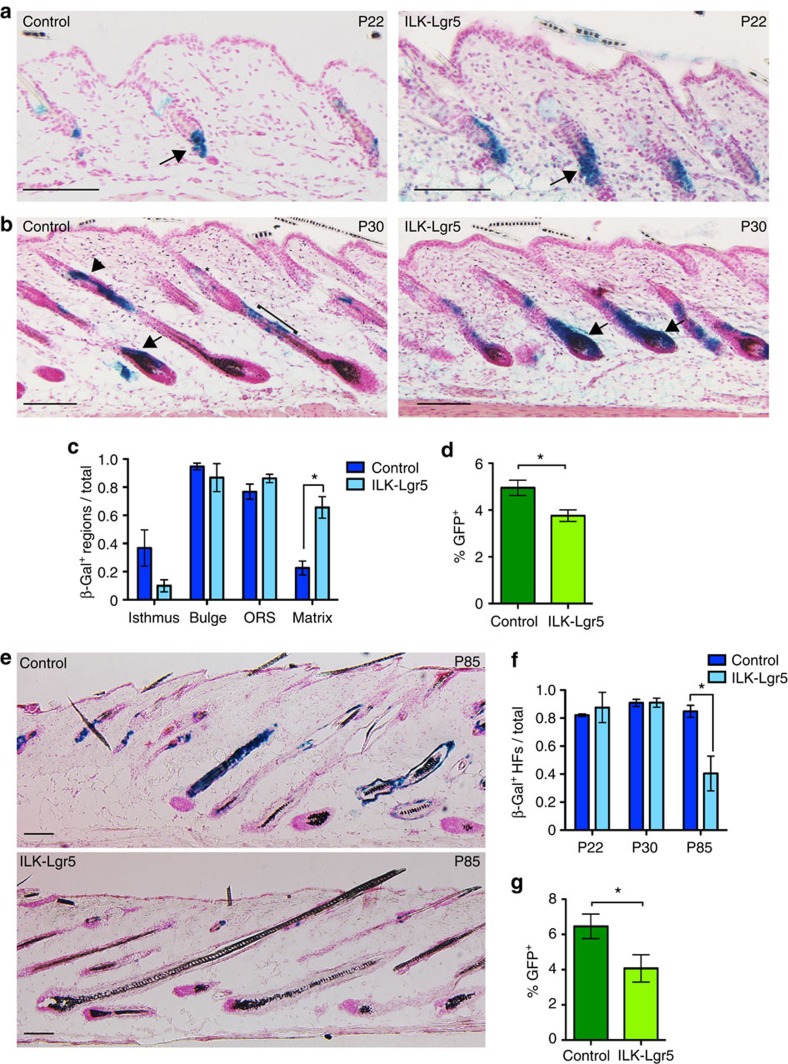
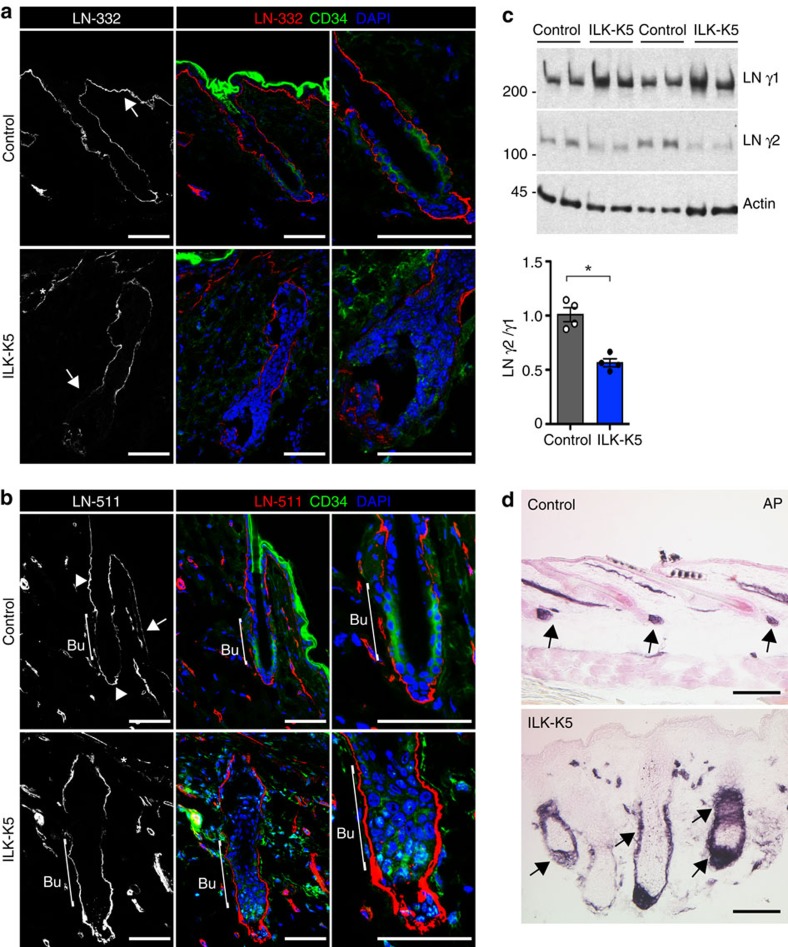
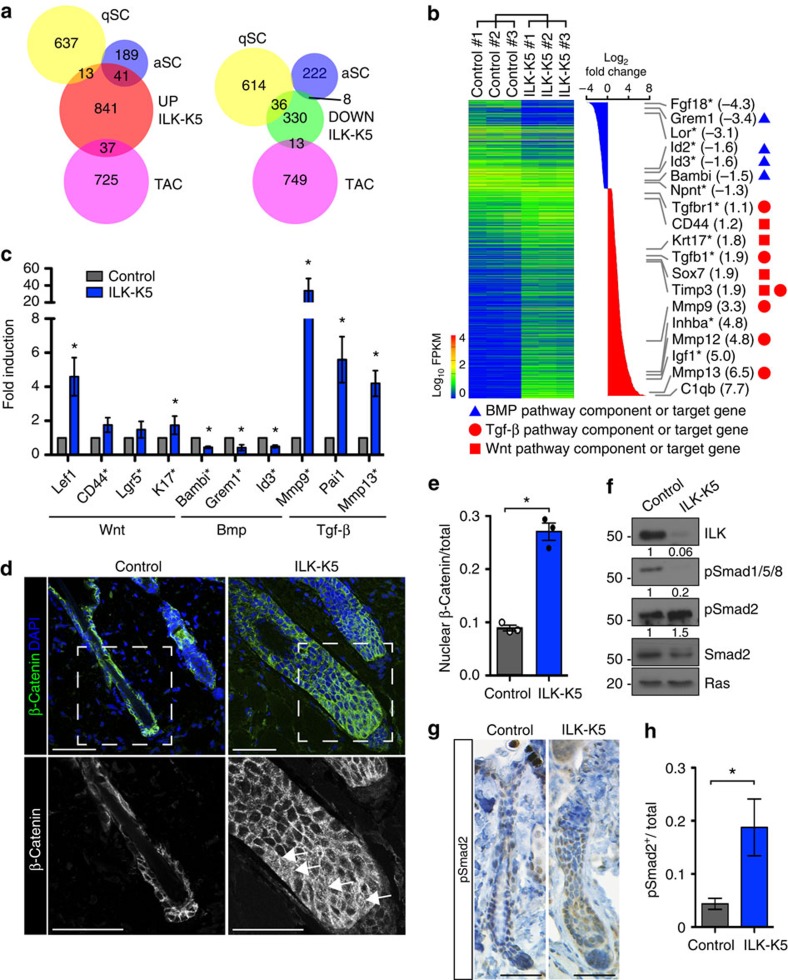
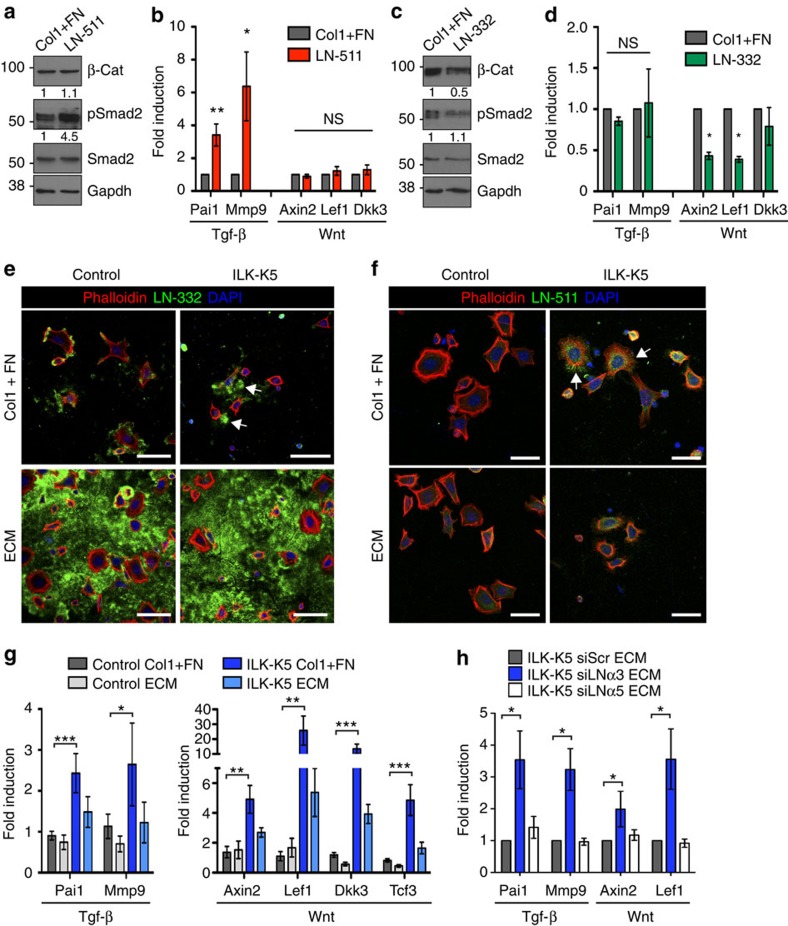
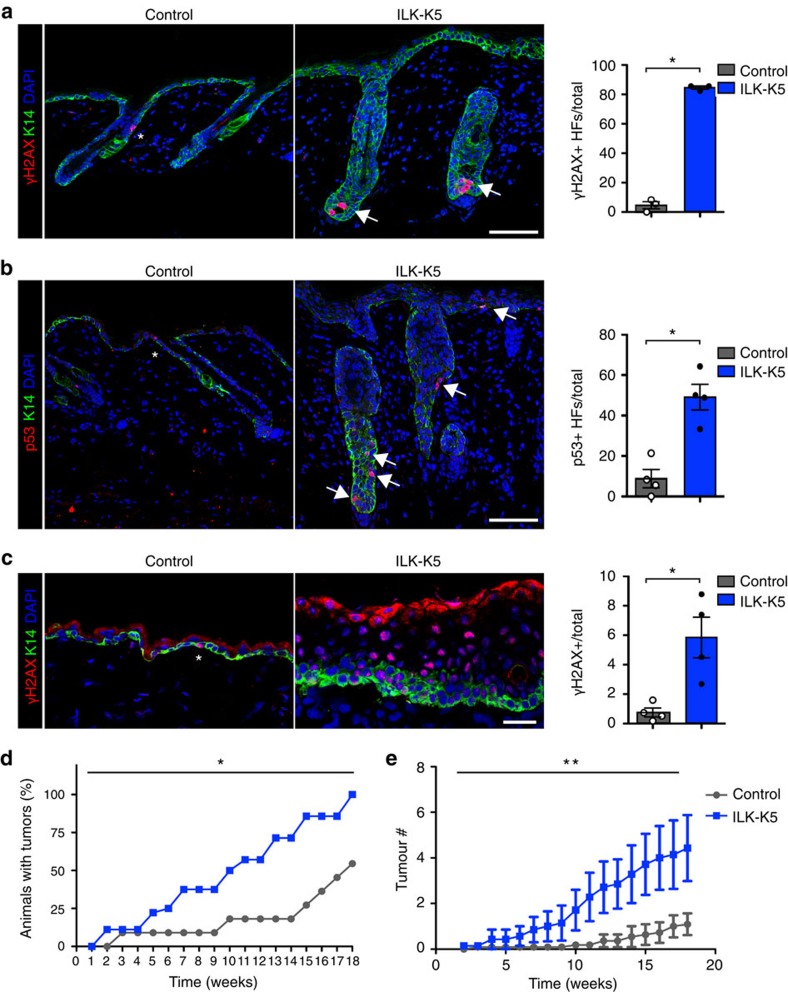
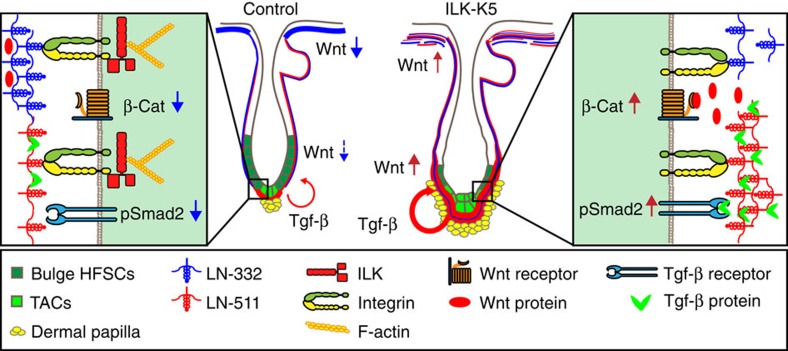
Stem cells reside in specialized niches that are critical for their function. Quiescent hair follicle stem cells (HFSCs) are confined within the bulge niche, but how the molecular composition of the niche regulates stem cell behaviour is poorly understood. Here we show that integrin-linked kinase (ILK) is a key regulator of the bulge extracellular matrix microenvironment, thereby governing the activation and maintenance of HFSCs. ILK mediates deposition of inverse laminin (LN)-332 and LN-511 gradients within the basement membrane (BM) wrapping the hair follicles. The precise BM composition tunes activities of Wnt and transforming growth factor-β pathways and subsequently regulates HFSC activation. Notably, reconstituting an optimal LN microenvironment restores the altered signalling in ILK-deficient cells. Aberrant stem cell activation in ILK-deficient epidermis leads to increased replicative stress, predisposing the tissue to carcinogenesis. Overall, our findings uncover a critical role for the BM niche in regulating stem cell activation and thereby skin homeostasis.


Figures

Figure 1
Figure 1. Deletion of ILK leads to progressive loss of quiescent bulge SCs.
(a) Haematoxylin/eosin staining of P21 skin. Compared with control HFs that display typical telogen morphology, ILK-K5 HFs are thick and more elongated, extending to the subcutis. Scale bar, 200 μm. (b) Immunofluorescence staining for the bulge SC marker CD34 (red) and EPC marker K14 (green) from P21 skin. CD34 staining within the bulge (Bu) is decreased or absent (right panel) in ILK-K5 HFs. Scale bars, 30 μm. (c) Quantification of bulge length from CD34 stainings at P21. Only HFs where CD34 staining was clearly present were measured (mean±s.e.m.; n=3; *P=0.05, Mann–Whitney). (d) CD34 staining from P57 skin shows absence of CD34-positive bulge SCs in ILK-K5 HFs. Scale bars, 30 μm. (e) FACS analysis of CD34+/α6 integrinhi bulge SCs shows progressive reduction of these cells in ILK-K5 skin (mean±s.e.m.; n=8; **P=0.0042 for P21; n=5; **P=0.0079 for P57; Mann–Whitney). (f) Immunofluorescence analysis of the HF progenitor marker K15 (green) and the TAC marker P-Cadherin (P-Cad; red) in P21 HFs shows expansion of both markers and mixing of the K15 and P-cad-positive compartments. Scale bars, 30 μm. (g) Detection of BrdU-positive cells within HFs of P21 mice after a 1 h BrdU pulse shows increased levels of BrdU-positive cells in ILK-K5 HFs. Scale bars, 50 μm. Values in quantification represent mean±s.e.m. of BrdU-positive cells per total HF cells (n=3; **P=0.0036, Mann–Whitney). (h) Analysis of EdU-positive LRCs within HFs of P21 mice after 10 days of EdU chase. Immunostaining shows decreased presence of LRCs in ILK-K5 bulge (Bu) SCs. Scale bars, 30 μm. Values in quantification represent mean±s.e.m. of EdU-positive cells per total cells in HFs (n=4; *P=0.05, Mann–Whitney). DAPI, 4,6-diamidino-2-phenylindole.
Figure 2
Figure 2. ILK is required to maintain bulge SCs independent of morphogenesis.
(a) Macroscopic inspection of ILK-iK14 mice after 8 months of doxycycline feeding reveals hair loss and blister-induced wounding. (b) Immunofluorescence staining for ILK (red) and K14 (green). ILK staining is not detected within the IFE (asterisk) or HFs (arrow) of ILK-iK14 mice. Scale bars, 50 μm. (c) Haematoxylin/eosin staining shows telogen HF morphology in control skin, whereas HFs in ILK-iK14 are enlarged with thickening of both the infundibulum and the outer root sheath (arrows). Scale bar, 200 μm. (d) FACS analysis of CD34+/α6 integrinhi bulge SCs shows reduction of these cells in ILK-iK14 skin (mean±s.e.m.; n=5; *P=0.0313, Wilcoxon matched-pairs test). DAPI, 4,6-diamidino-2-phenylindole.
Figure 3
Figure 3. ILK deficiency leads to loss of quiescent SCs through enhanced differentiation.
(a) Lineage-tracing analysis of β-galactosidase-positive Lgr5+ SC progeny of control and ILK-Lgr5Cre mice in P22 skin, directly after 5 consecutive days of tamoxifen application. β-galactosidase-positive Lgr5 progeny are seen in the bulge and secondary germ regions of HFs (arrows) both in controls and ILK-Lgr5Cre mice. Scale bars, 100 μm. (b) After 1 week, (P30) β-galactosidase staining shows Lgr5 progeny in the isthmus (asterisk), bulge (arrowhead), outer root sheath (ORS; bracket) and matrix (arrow) regions in HFs of control skin, whereas in ILK-Lgr5Cre skin the strongest staining is restricted to the matrix of HFs (arrows). Scale bars, 100 μm. (c) Quantification of the proportion of P30 HFs that contain β-galactosidase-positive cells within the regions indicated (mean±s.e.m.; n=4; *P=0.0159, Mann–Whitney). (d) FACS analysis of GFP+ Lgr5-expressing cells shows a reduction in this cell population in P30 ILK-Lgr5Cre mice (mean±s.e.m.; n=7; *P=0.0013, Student's t-test). (e) Lineage tracing of Lgr5 progeny at P85 from control and ILK-Lgr5Cre mice shows positive cells throughout HFs of controls, whereas ILK-deleted mice show strongly reduced staining. Scale bars, 100 μm. (f) Quantification of the distribution of β-galactosidase staining within P22, P30 and P85 HFs. ILK-Lgr5Cre mice show reduced β-galactosidase staining at P85 (mean±s.e.m.; n=4; *P=0.0286, Mann–Whitney). (g) FACS analysis of GFP+ Lgr5-expressing cells shows a reduction in this cell population in P85 ILK-Lgr5Cre mice (mean±s.e.m.; n=4; *P=0.0381, Mann–Whitney).
Figure 4
Figure 4. ILK is required to remodel the ECM around the bulge SC niche.
(a) Immunofluorescence staining for LN-332 (red) and CD34 (green) from P21 HFs. LN-332 staining shows higher intensity beneath IFE (arrow) than around HFs in control skin (upper panel). Note fragmentation of LN-332 staining along the IFE (asterisk) and decreased LN-332 around the lower part of the HF, including the HG (arrow) in ILK-K5 skin (lower panel). Scale bars, 50 μm. (b) Immunofluorescence staining for LN-511 (red) and CD34 (green) from P21 HFs. LN-511 staining shows highest intensity at the isthmus region and around HG (arrowheads). Only faint staining is observed beneath the IFE (arrow) and around bulge (bracket) in control skin (upper panel). Note fragmentation of LN-511 staining along the IFE (asterisk) and high intensity around bulge and HG (bracket) in ILK-K5 skin (lower panel). Scale bars, 50 μm. (c) Western blot analysis of LN γ1 and γ2 chains in skin extracts. Actin is used as a loading control. ILK-K5 skin shows increased levels of γ1 and decreased levels of γ2, resulting in a twofold decrease in γ2 to γ1 ratio. Lower panel shows quantifications of mean band intensities (mean±s.d.; n=4; *P=0.0286, Mann–Whitney). For full scans of western blots, see Supplementary Fig. 7. (d) Alkaline phosphatase (AP) staining to detect dermal papilla (DP) cells in P21 skin. In control skin, the DP is found attached to the base of each HF (arrows; upper panel). In ILK-K5 skin AP-positive cell population is increased and surrounds the entire lower region of the HFs (arrows; lower panel). Scale bars, 200 μm. DAPI, 4,6-diamidino-2-phenylindole.
Figure 5
Figure 5. Deregulation of key SC fate-determining pathways upon deletion of ILK.
(a) Schematic representation of RNA-seq profiling of transcripts up- or downregulated (padj<0.05) in purified populations of ILK-K5 bulge SCs compared with controls (‘UP ILK-K5' and ‘DOWN ILK-K5', respectively), compared with published gene expression signatures of quiescent bulge SCs (qSCs), activated bulge SCs (aSCs) and TACs. Note overlap of upregulated genes with aSC and TAC signatures, and overlap of downregulated genes with qSC signature. (b) Summary of transcriptional profiling of purified bulge SCs from ILK-K5 and control skin. Significantly regulated genes are listed on the right side. Note the genes involved in BMP (blue triangle), Tgf-β (red circle) and Wnt (red square) signalling. Other genes implicated in HFSC biology are marked with an asterisk. (c) qRT–PCR validation of RNA-seq data from independently derived bulge SC RNA samples. Note upregulation of Wnt and Tgf-β pathway target genes and downregulation of BMP pathway target genes. Genes that were found significantly regulated in the RNA-seq data are marked with an asterisk (mean±s.e.m.; n=4; *P=0.0211, Mann–Whitney). (d) Immunofluorescence staining for β-Catenin (in green) from P21 HFs. Lower panel represents blow up of area marked with a white rectangle. Note increased nuclear localization of β-Catenin in ILK-K5 HFs (arrows). Scale bars, 50 μm. (e) Quantification of nuclear β-Catenin staining (mean±s.e.m.; n=3; *P=0.05, Mann–Whitney). (f) Western blot analysis from P21 epidermal lysates shows increased phosphorylation of Smad2 and decreased phosphorylation of Smad1/5/8 in ILK-K5 skin. Quantifications represent mean band intensities from three independent experiments. For full scans of western blots, see Supplementary Fig. 7. (g) Immunohistochemical staining for pSmad2 from P21 HFs. Note increased pSmad2 staining (in brown) in ILK-K5 HFs. Scale bars, 30 μm. (h) Quantification of pSmad2 staining (mean±s.e.m.; n=5; *P=0.0297, Student's t-test). DAPI, 4,6-diamidino-2-phenylindole; ANOVA, analysis of variance.
Figure 6
Figure 6. The composition of the BM regulates SC quiescence and activation.
(a) Western blot analysis of freshly isolated epidermal progenitor cells (EPCs) plated on LN-511 or a collagen I/fibronectin mixture (Col1+FN) as control. Cells on LN-511 show increased Smad2 phosphorylation, whereas β-Catenin (β-Cat) is unchanged. Quantifications represent mean band intensities from three independent experiments. (b) RT–qPCR analysis of Wnt/β-Catenin and Tgf-β target gene expression shows selective upregulation of Tgf-β target genes in cells adhering to LN-511 (mean±s.e.m.; n=5; *P=0.0312 **P=0.0075, Mann–Whitney). (c) Western blot analysis of EPCs plated on LN-332 or Col1+FN as control. Cells on LN-332 show decreased β-Catenin levels, whereas Smad2 phosphorylation in unchanged. Quantifications represent mean band intensities from three independent experiments. (d) Analysis of Wnt and Tgf-β pathway target gene expression shows selective downregulation of Wnt/β-catenin target genes in cells adhering to LN-332 (mean±s.e.m.; n=4; *P=0.0211, Mann–Whitney). (e) Immunofluorescence analyses of EPCs adhering to Col1+FN (upper panel) or preassembled ECM (lower panel). Control cells deposit LN-332 matrix on which they adhere to (in green), whereas EPCs from ILK-K5 skin deposit LN-332 aggregates (arrows). Preassembled ECM contains large amounts of LN-332 that supports adhesion in both control and ILK-K5 EPCs (lower panels). Phalloidin (red) was used to counterstain adhering cells. Scale bars, 35 μm. (f) Immunofluorescence analyses of EPCs plated on Col1+FN (upper panel) or preformed ECM (lower panel). On Col1+FN, control cells deposit very low levels of LN-511 (in green), whereas ILK-K5 EPCs deposit larger amounts (arrows). Preassembled ECM contains very low levels of LN-511 (lower panels). Phalloidin (red) was used to counterstain adhering cells. Scale bars, 25 μm. (g) Adhesion of EPCs from ILK-K5 skin on preassembled wild-type ECM restores Wnt and Tgf-β pathway target gene expression to the level of control cells (mean±s.e.m.; n=7; ***P<0.0003, **P<0.0048, *P=0.0437, analysis of variance (ANOVA)/Bonferroni). (h) ECM where LN-332 has been depleted (siLNα3) fails to downregulate Wnt and Tgf-β pathway target gene expression in ILK-K5 EPCs, whereas depletion of LN-511 (siLNα5) has no effect (mean±s.e.m.; n=3; *P<0.05, ANOVA/Bonferroni). For full scans of all western blots, see Supplementary Fig. 7. DAPI, 4,6-diamidino-2-phenylindole; NS, not significant.
Figure 7
Figure 7. SC activation promotes replicative stress and skin carcinogenesis.
(a) Immmunofluorescence staining for γH2AX (red) and K14 (green) from P21 skin. Control mice rarely show γH2AX-positive cells (asterisk), whereas ILK-K5 HFs show clusters of cells with pan-nuclear γH2AX within HFs (arrows). Scale bars, 50 μm. Right panel shows quantification of HFs containing more than two γH2AX-positive cells (mean±s.e.m.; n=3; *P=0.0383, Mann–Whitney). (b) Staining for p53 (red) and K14 (green) from P21 skin. In contrast to control mice that show only solitary p53-positive cells (asterisk), ILK-K5 mice frequently show p53-positive cells within HFs and IFE (arrows). Scale bars, 50 μm. Right panel shows quantification of HFs containing more than two p53-positive cells (mean±s.e.m.; n=4; *P=0.0286, Mann–Whitney). (c) Staining for γH2AX (red) and K14 (green) from P57 skin. Control mice show only solitary γH2AX-positive cells (asterisk) within the IFE, whereas ILK-K5 IFE shows abundant pan-nuclear γH2AX staining. Scale bars, 50 μm. Right panel shows quantification of γH2AX-positive cells per total cells within the IFE (mean±s.e.m.; n=4; *P=0.0286, Mann–Whitney). (d) Tumour incidence of control and ILK-K5 mice treated twice with DMBA followed by 18 weeks of biweekly TPA treatment. ILK-K5 mice show increased tumour incidence (n=11/11; *P=0.0209, χ2-test). (e) Tumour multiplicity in affected control and ILK-K5 mice during 18 weeks of biweekly TPA treatment. ILK-K5 mice show increased tumour multiplicity (mean±s.e.m.; n=11/11; **P<0.01, two-way analysis of variance). DAPI, 4,6-diamidino-2-phenylindole.
Figure 8
Figure 8. Model of ILK-mediated signalling in the epidermis and HFs.
LN-332 (in blue) and LN-511 (in red) form inverse gradients within the epidermal basement membrane. LN-332 is abundant beneath the interfollicular epidermis, whereas LN-511 is most abundant at the lower part of the hair follicle, surrounding the transit-amplifying cells (TACs). LN-332 suppresses Wnt signalling, whereas LN-511 promotes Tgf-β signalling. Deletion of ILK leads to fragmentation of the LN-332-BM beneath the IFE and around the lower part of the HF, whereas LN-511 levels around the hair follicle increase, possibly due to compensatory deposition by the DP cells. This relative increase in LN-511 levels leads to increased Wnt and Tgf-β signalling, resulting in aberrant bulge SC activation and their subsequent depletion due to enhanced differentiation.

References

    1. Scadden D. T. Nice neighborhood: emerging concepts of the stem cell niche. Cell 157, 41–50 (2014). - PMC - PubMed
    1. Blanpain C. & Fuchs E. Epidermal homeostasis: a balancing act of stem cells in the skin. Nat. Rev. Mol. Cell Biol. 10, 207–217 (2009). - PMC - PubMed
    1. Muller-Rover S. et al. A comprehensive guide for the accurate classification of murine hair follicles in distinct hair cycle stages. J. Invest. Dermatol. 117, 3–15 (2001). - PubMed
    1. Hsu Y. C. & Fuchs E. A family business: stem cell progeny join the niche to regulate homeostasis. Nat. Rev. Mol. Cell Biol. 13, 103–114 (2012). - PMC - PubMed
    1. Watt F. M. & Fujiwara H. Cell-extracellular matrix interactions in normal and diseased skin. Cold Spring Harb. Perspect. Biol. 3, (2011). - PMC - PubMed

Publication types

MeSH terms

Associated data