. 2015 Oct 7:6:8472.
doi: 10.1038/ncomms9472.

Mesenchymal stem cells use extracellular vesicles to outsource mitophagy and shuttle microRNAs

Affiliations

Mesenchymal stem cells use extracellular vesicles to outsource mitophagy and shuttle microRNAs

Donald G Phinney et al. Nat Commun. .

Abstract

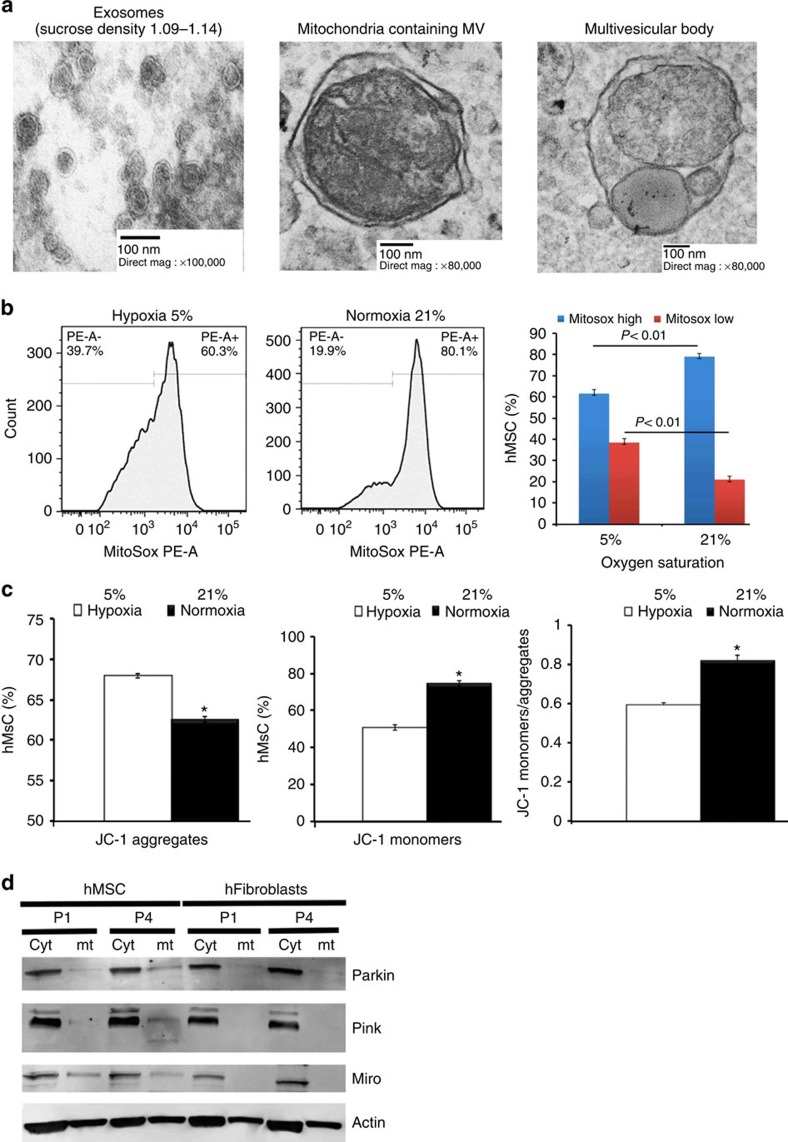
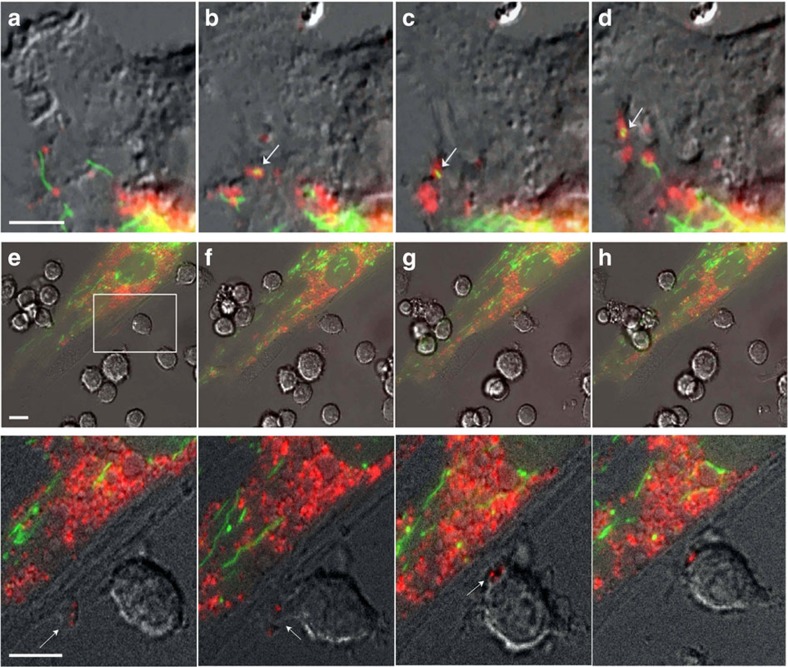
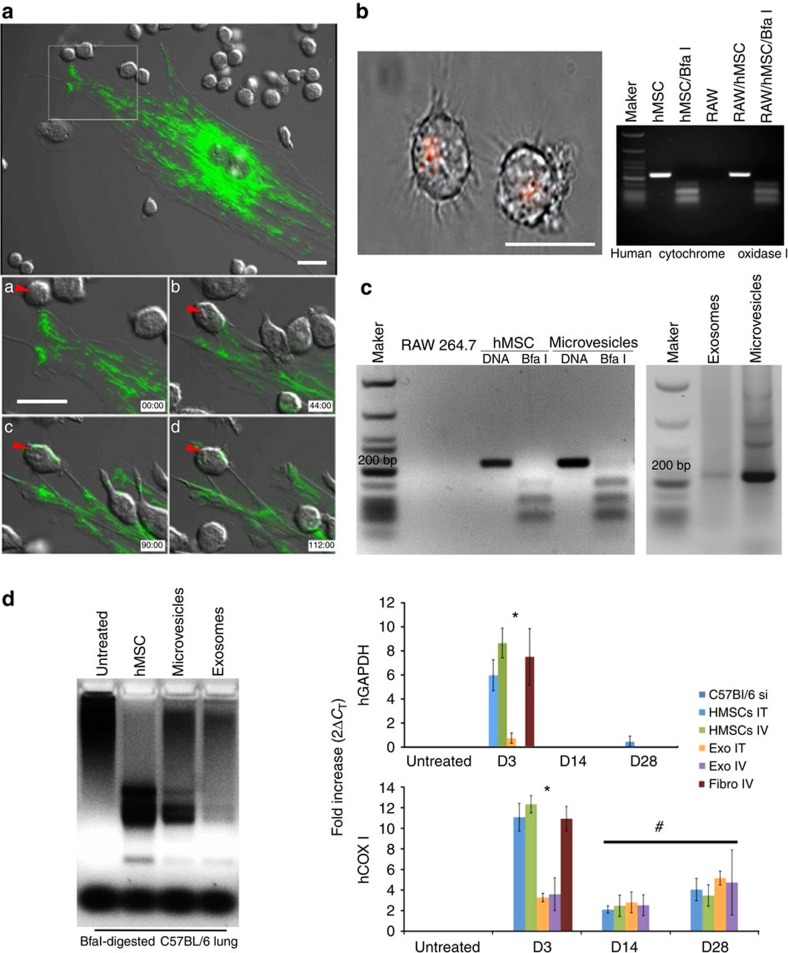
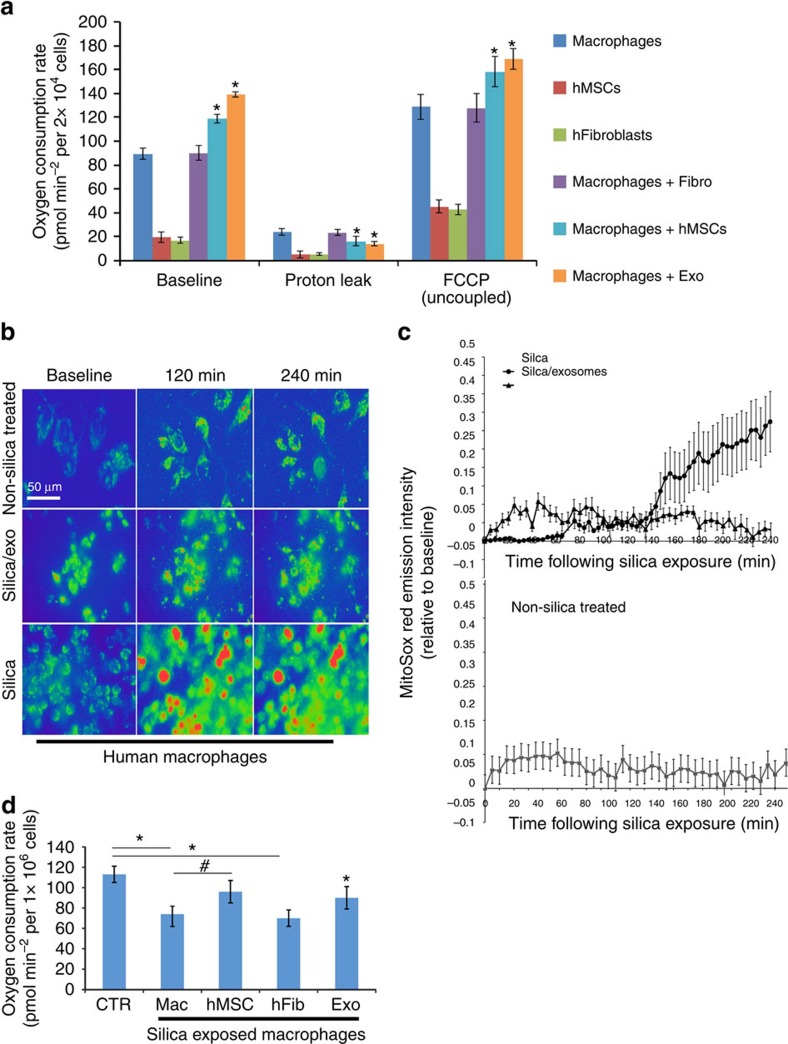
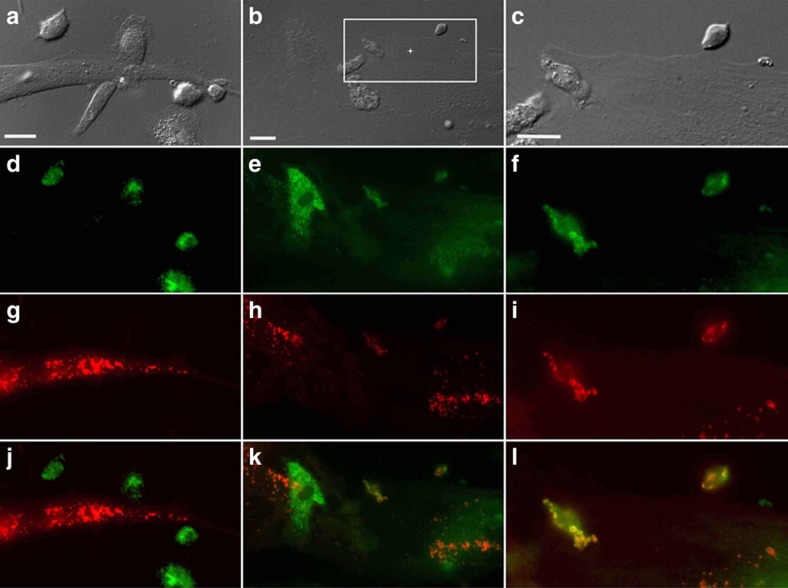
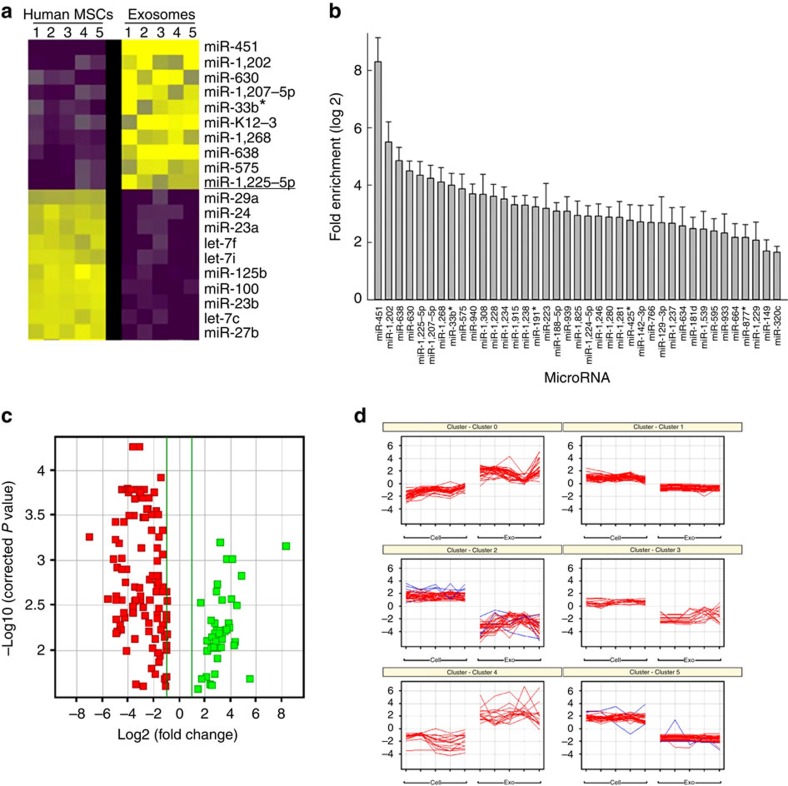
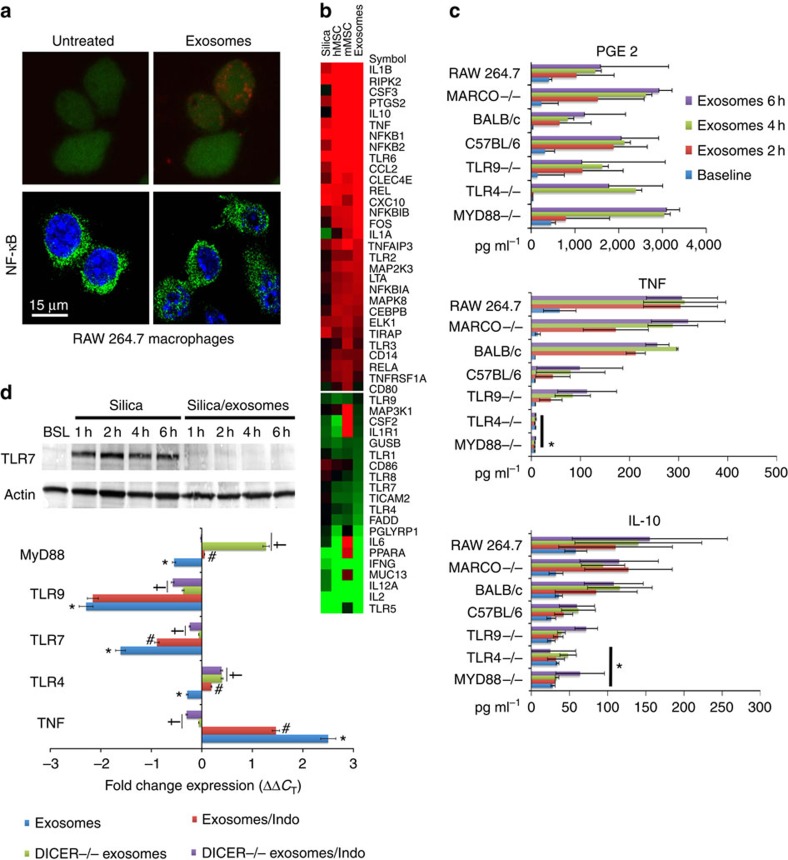
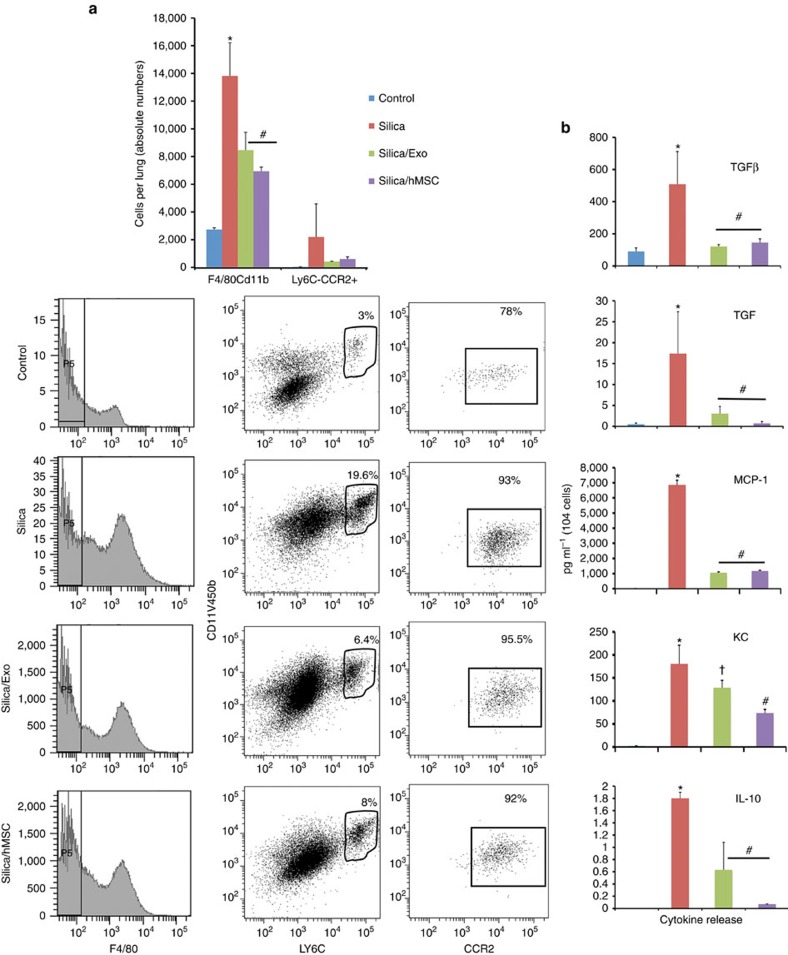
Mesenchymal stem cells (MSCs) and macrophages are fundamental components of the stem cell niche and function coordinately to regulate haematopoietic stem cell self-renewal and mobilization. Recent studies indicate that mitophagy and healthy mitochondrial function are critical to the survival of stem cells, but how these processes are regulated in MSCs is unknown. Here we show that MSCs manage intracellular oxidative stress by targeting depolarized mitochondria to the plasma membrane via arrestin domain-containing protein 1-mediated microvesicles. The vesicles are then engulfed and re-utilized via a process involving fusion by macrophages, resulting in enhanced bioenergetics. Furthermore, we show that MSCs simultaneously shed micro RNA-containing exosomes that inhibit macrophage activation by suppressing Toll-like receptor signalling, thereby de-sensitizing macrophages to the ingested mitochondria. Collectively, these studies mechanistically link mitophagy and MSC survival with macrophage function, thereby providing a physiologically relevant context for the innate immunomodulatory activity of MSCs.


Figures

Figure 1
Figure 1. MSC-derived MVs contain depolarized mitochondria.
(a) Left panel, electron microscopy of vesicles isolated from sucrose densities of 1.11 and 1.14 g ml−1 and purified using differential ultracentrifugation (100,000g per 18 h) reveal a typical exosome morphology. Middle panel, MVs over 100 nm in size recovered from human MSC-conditioned medium following low-speed (10,000 g per 1 h) centrifugation contain structures conforming to the morphology of mitochondria. Right panel, MVs contain closely packed-vesicles and entire mitochondria (multivesicular body (MVB)) representing autophagosomes. (b) Left panel, flow cytometric analysis of MitoSOX Red-stained human MSCs expanded in 5 or 21% oxygen for 7 days. Right panel, quantification of the flow cytometric data. Plotted values (mean±s.e.m.) represent four replicates for each sample using three distinct replicate cultures from each experimental group. (c) Mitochondrial membrane potential of human MSCs from b determined using JC-1 staining. Expansion in 21% oxygen results in partial depolarization of mitochondria as evidenced by accumulation of JC-1 monomers (*P<0.005, Student's-t test versus MSCs in 5% oxygen). (d) Western blot analysis (Supplementary Fig. 1) of cytoplasmic or mitochondrial extracts prepared from human MSCs expanded in 21% oxygen for the indicated passage numbers (P1 or P4) reveals Parkin mitochondrial translocation and Pink1 kinase activation in human MSCs but not human dermal fibroblasts. Data are representative of a single experiment repeated five times.
Figure 2
Figure 2. MSC outsource mitophagy to macrophages.
(ad) Differential interference contrast (DIC) fluorescence overlay of live human MSCs expressing fluorescent proteins that target mitochondria (green) and phagosomes (red) shows mitochondria being loaded into phagosomes (arrows), which are then shuttled to the plasma membrane for extrusion (also see Supplementary Movie 1). (eh) Inset shows a representative macrophage interacting with a human MSC. This interaction is shown as a time sequence (5 min intervals) in the lower images and in Supplementary Movie 3. The inset demarcates the area in the human MSC plasma membrane where the membrane blebs outwards and accumulates vesicles. Macrophages nibble the surface of human MSCs and uptake mitochondrial laden phagosomes from blebs budding (arrows) from the plasma membrane of the human MSCs. Scale bars, 10 μ.
Figure 3
Figure 3. MSC transfer mitochondria to macrophages and lung tissues.
(a) Top panel is DIC fluorescent overlay at time 0 of primary human MSCs infected with Organelle Lights to label mitochondria (green) and co-cultured with mouse (RAW 264.7) macrophages. Lower panels, time sequence at 45 min intervals showing transfer of green-labelled mitochondria from the a MSC to a macrophage (red arrow, see Supplementary Movie 4 for transfer of mitochondria in filamentous form, and Supplementary Movie 5 in which GFP signal is compensated to allow the tracking of the transferred mitochondria into macrophages). (b) Left panel, photomicrograph of FACS-sorted mouse macrophages that were co-cultured with mitochondria-labelled (RFP) human MSCs clearly show retention of RFP label. Right panel, electrophoretic pattern of human COX I PCR product treated with or without Bfa1 after amplification from the indicated cell sources. (c) MSC-derived exosomes and MVs express the Bfa1-sensitive 228-bp COX I mtDNA PCR product detected in human MSCs (b). (d) Left panel, electrophoretic pattern of Bfa1-digested human COX1 PCR product amplified from mouse lung DNA isolated 14 days after the intravenous administration of human MSCs, human MSC-derived MVs or exosomes. Right panel, human GAPDH and human COX1 relative expression levels quantified by RT–PCR in mouse lung (3–28 days) after a single (intratracheal (IT) or intravenous (IV)) injection of human MSCs, human MSC-derived exosomes or human fibroblasts. *P<0.001, #P<0.001 by ANOVA compared with untreated mouse lung. Plotted values (mean±s.e.m.) are from experiments repeated four times. Scale bars, 20 μ.
Figure 4
Figure 4. MSCs enhance macrophage bioenergetics.
(a) Mitochondrial respiration of human macrophages, human MSCs or human fibroblasts was measured as OCR using the XF technology. Macrophages were co-cultured with or without human MSCs or fibroblasts (1:10 ratio) or treated with human MSC-derived exosomes (40 μg per protein) in the presence or absence of Oligomycin A and FCCP to differentiate ATP-linked respiration from the proton leak. Plotted data (mean±s.e.m.) were performed using six replicates per sample and repeated three times. (b) Pseudocoloured photomicrographs (0–240 min) of MitoSOX Red-stained macrophages that were non-stimulated (upper panel), or treated with silica (20 μg cm−2, lower panel) or silica plus human MSC-derived exosomes (added 10 min after silica, middle panel). Scale bars, 50 μ. (c) Time course of MitoSOX Red emission by human macrophages treated as in b. Figure is representative of five exposures (nine stages positions per test and 6 cells per stage). (d) OCR as in a of silica-exposed macrophages treated with or without human MSCs, human MSC-derived exosomes or human fibroblasts. Plotted values (mean±s.e.m.) are from experiments repeated three times, *P<0.05 as compared to control, #P<0.05 as compared to silica treated macrophages, as determined by Student's t-test.
Figure 5
Figure 5. Mitochondrial transfer from human MSCs is followed by fusion inside macrophages.
Human MSCs and human macrophages (1 × 10⁵) were infected separately with Organelle Lights to label human MSC mitochondria (red) and macrophage mitochondria (green). Twenty-four hours following infection, macrophages were harvested and co-incubated with the human MSCs for 2 h. Images were collected using an inverted Nikon TiE fluorescent microscope equipped with a × 60 oil immersion optic and NIS Elements Software. Organelle Lights were excited using a Lumencor diode-pumped light engine and detected using an ORCA-Flash4.0 sCMOS camera. (a,b) DIC images of two separate fields within the same dish. (c) A zoomed image of the outlined section within b (scale bars, 20 μ). The fluorescence-based images for each field appear in the panels below the DIC images, with df showing macrophage mitochondria (green); gi showing human MSC mitochondria (red); and jl showing the overlay with yellow indicative of colocalization of human MSC and macrophage mitochondria. Not every macrophage was shown to take up human MSC mitochondria (a,d,g, j).
Figure 6
Figure 6. RNA expression profile in human MSCs and their exosomes.
(a) Heatmap illustrating the 10 microRNAs most highly enriched in human MSCs versus their corresponding exosomes. Every row represents a microRNA and every column a cell or exosome, and yellow and purple represent increased or decreased expression, respectively. (b) Plotted values represent the means log 2 fold enrichment of exosomal versus human MSC microRNAs (n=5 microarrays of different MSCs cell lines; P<0.05, ANOVA followed by Holm–Sidak post hoc pairwise comparisons). (c) Data in b show distribution of differentially expressed microRNAs between samples based on the –log base 10 significant P value (<0.05) and with a relative fold change of >2 (in log base 2). Green and red squares represent increasingly and decreasingly expressed microRNAs, respectively, in exosomes versus human MSCs. (d) Computational analysis of human MSCs and exosomes from five donors demonstrates that microRNAs isolated in exosomes cluster among different donors.
Figure 7
Figure 7. MSC-derived MVs inhibit TLR signalling in macrophages.
(a) Upper panels, confocal microscopy showing intracellular localization of Cy5-labelled exosomes within macrophages 18 min post administration. Lower panel, nuclear localization of NF-κB in macrophages 2 h post administration of exosomes. Scale bars, 15 μ. (b) Partial heatmap illustrating mRNA levels of 84 TLR-associated transcripts in macrophages at 8 h post treatment with silica (20 mg cm−2), human or mouse MSCs (1:10 ratio) or human MSC-derived exosomes (40 μg protein). Transcript order is highest (top) to lowest (bottom), and each row represents a gene and each column a specific treatment. Red and green illustrates increased or decreased gene expression, respectively. Experiments were repeated four times. (c) Effect of exosome treatment on PGE2, TNF and IL-10 secretion in macrophages from the indicated mouse strains. Plotted data (mean±s.e.m.) were from experiments repeated five times. *P<0.05 compared with C57BL/6J or BALB/CJ macrophages as determined by ANOVA). (d) Upper panel, western blot illustrating the time-dependent effect of silica or human MSC-derived exosomes on expression of TLR7 in macrophages. Lower panel, fold change in expression of the indicated transcripts in macrophages RT–PCR demonstrating the negative regulation of exosomes on macrophage expression of TLR genes. Plotted data (mean±s.e.m.) are from experiments repeated four times. *P<0.05 compared with baseline. #P<0.05 compared with native exosomes by Student' t-test. †P<0.05 compared with the effect of native exosomes and indomethacin (Indo) treated by Student's t-test.
Figure 8
Figure 8. Human MSCs and their exosomes prevent the accumulation of Ly6Chi monocytes in the lungs of silica-exposed mice.
(a) Upper panel, absolute number of F4/80/CD11b- and Ly6C/CCR2-expressing cells in lung tissue of mice 72 h post administration of saline (50 μl), silica (0.2 g kg−1) or silica plus human MSC-derived exosomes (∼3 × 10¹¹ exosomes containing 40 μg protein). *P<0.05 compared with saline by t-test). Lower panel, representative histograms of flow cytometric data analysed in a showing the phenotype and frequency of cells recovered from lung tissue after enzymatic digestion. (b) Mulitplex ELISA of inflammatory (TNF, MCP1 and KC) and fibrotic (TGFβ and IL-10) mediators secreted by cultured F4/80/CD11b/ and Ly6C/CCR2 cells from a. Plotted values (mean±s.e.m.) are from experiments using N=5 animals per group and repeated three times. *P<0.05 compared with saline, #P<0.001 compared with silica-treated monocytes by ANOVA.
Figure 9
Figure 9. Human MSCs and their exosomes ameliorate experimental silicosis.
(a) Photomicrographs of lung sections stained with haematoxylin and eosine from mice 28 days after intratracheal administration of silica (0.2 g kg−1) alone or followed 3 days later with an intravenous injection of human MSCs, human MSC-derived exosomes (∼3 × 10¹¹ exosomes containing 40 μg protein) or human fibroblasts (scale bars, 500 μ). (b) Upper panel, photomicrographs of Diff-Quick-stained cytospins of BAL from mice in a. Lower panel, differential cell counts showing counts of total cells (left) and percentage of macrophages, lymphocytes, neutrophils and eosinophils (right panels). *P<0.05 compared with control, †P<0.05 compared with fibroblasts treated mice by Student's t-test. (c) Hydroxyproline content of lung tissue from animals treated as in a. *P<0.001 compared with saline by Student's t-test. †P<0.05 compared with silica, human MSC or fibroblast by ANOVA. (d) Quantification of mouse TNF, IL-6, IL-10 and Col1α1 levels in lung tissue from mice in a at 14 and 28 d post treatment. Plotted values (mean±s.e.m.) are representative of experiments using 15 animals per group and repeated three times. *P<0.001 compared with saline by Student's t-test, †P<0.05 compared with silica by ANOVA.

References

    1. Caplan A. I. & Correa D. The MSC: an injury drugstore. Cell Stem Cell 9, 11–15 (2011) . - PMC - PubMed
    1. Pittenger M. Sleuthing the source of regeneration by MSCs. Cell Stem Cell 5, 8–10 (2009) . - PubMed
    1. Ortiz L. A. et al.. Interleukin 1 receptor antagonist mediates the antiinflammatory and antifibrotic effect of mesenchymal stem cells during lung injury. Proc. Natl Acad. Sci. USA 104, 11002–11007 (2007) . - PMC - PubMed
    1. Lee J. W., Fang X. H., Gupta N., Serikov V. & Matthay M. A. Allogeneic human mesenchymal stem cells for treatment of E. coli endotoxin-induced acute lung injury in the ex vivo perfused human lung. Proc. Natl Acad. Sci. USA 106, 16357–16362 (2009) . - PMC - PubMed
    1. Timmers L. et al.. Reduction of myocardial infarct size by human mesenchymal stem cell conditioned medium. Stem Cell Res. 1, 129–137 (2007) . - PubMed

Publication types

MeSH terms

Associated data