. 2015 Sep 24;163(1):160-73.
doi: 10.1016/j.cell.2015.09.001.

Nuclear FAK controls chemokine transcription, Tregs, and evasion of anti-tumor immunity

Affiliations

Nuclear FAK controls chemokine transcription, Tregs, and evasion of anti-tumor immunity

Alan Serrels et al. Cell. .

Abstract

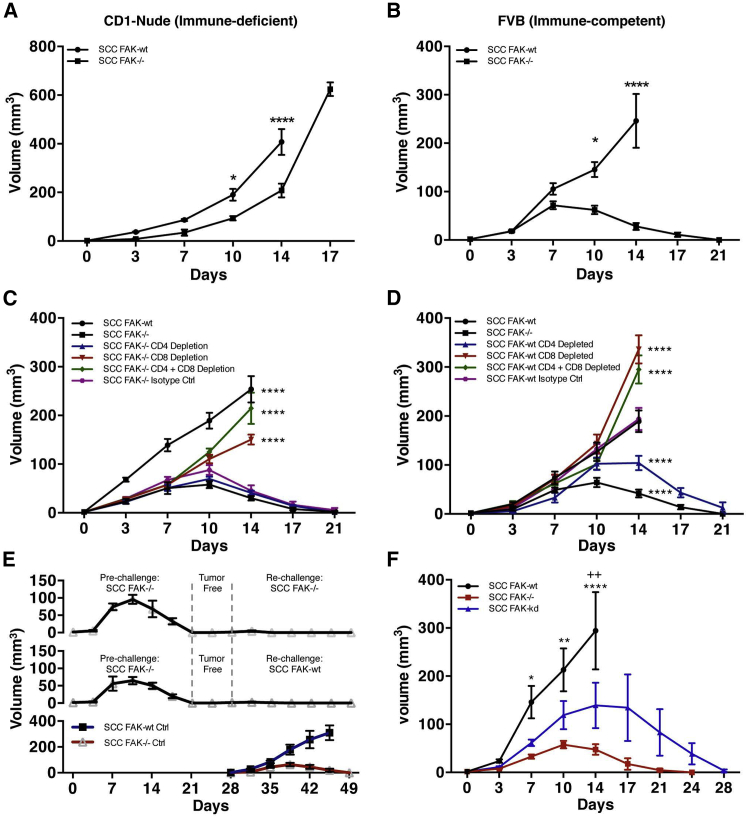
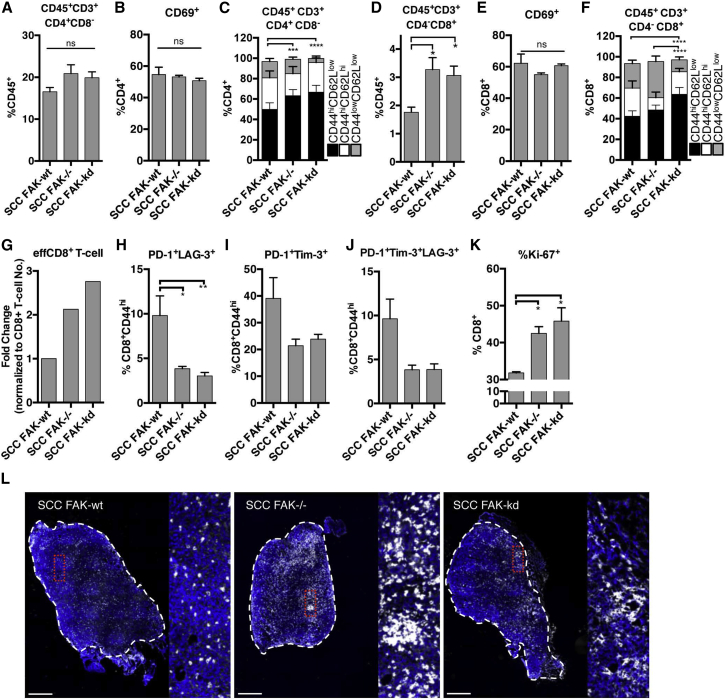
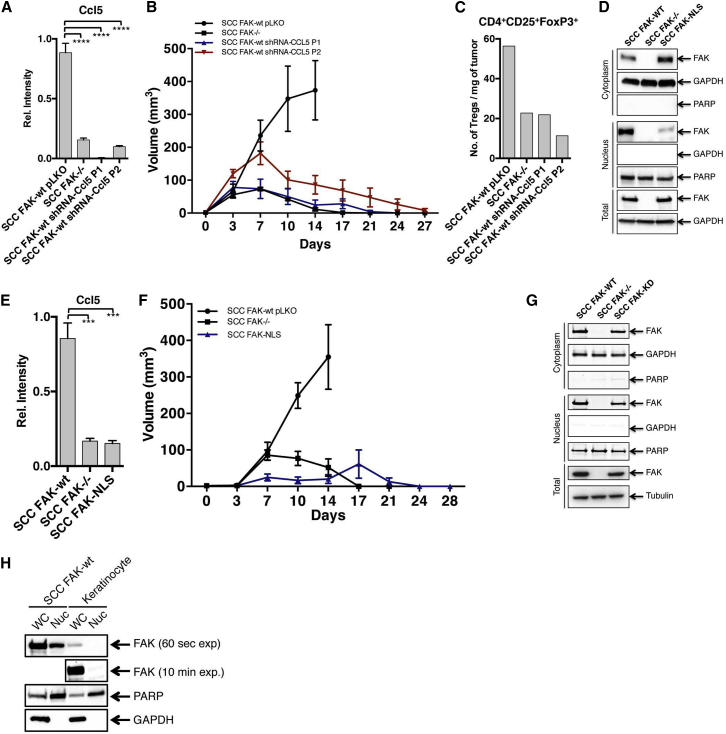
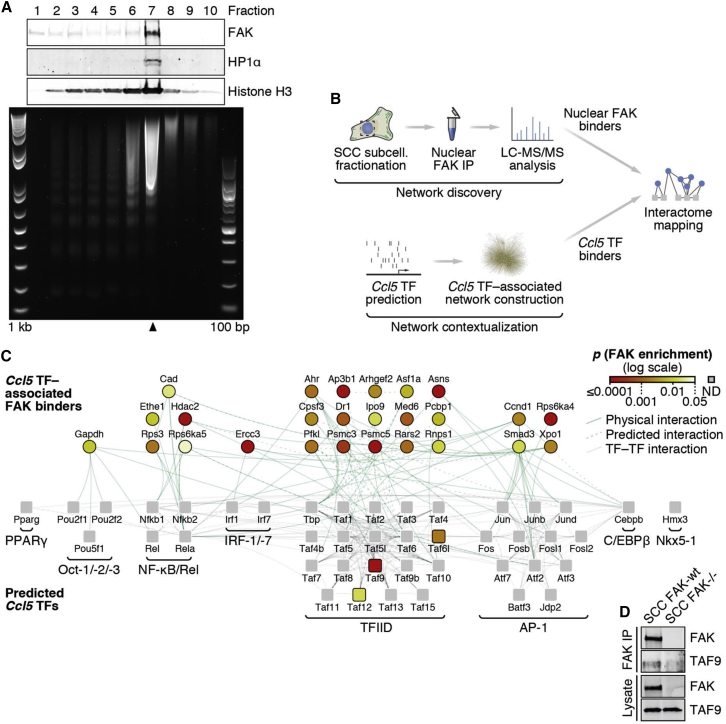
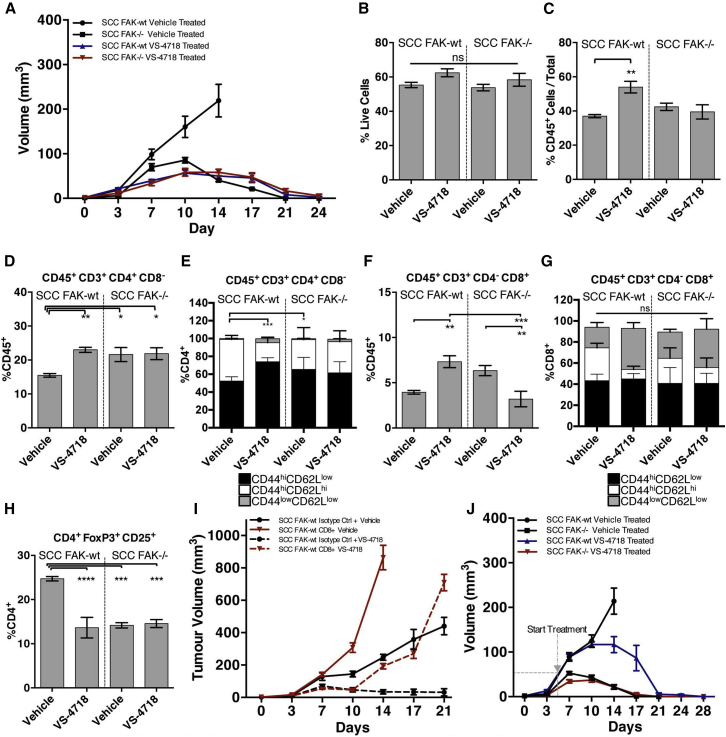
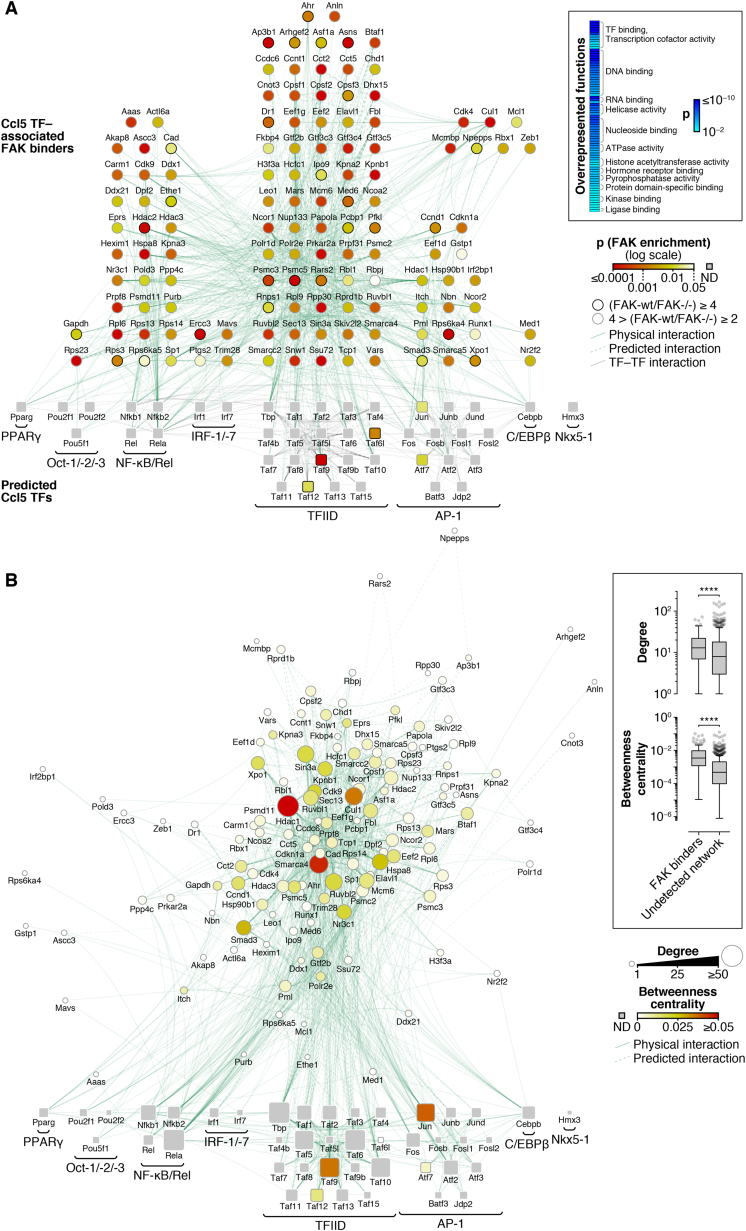
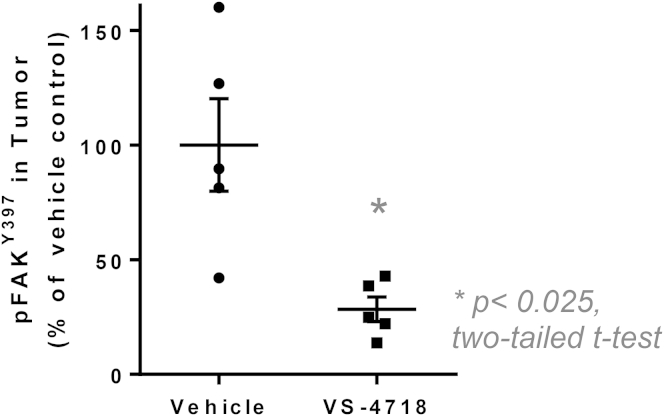
Focal adhesion kinase (FAK) promotes anti-tumor immune evasion. Specifically, the kinase activity of nuclear-targeted FAK in squamous cell carcinoma (SCC) cells drives exhaustion of CD8(+) T cells and recruitment of regulatory T cells (Tregs) in the tumor microenvironment by regulating chemokine/cytokine and ligand-receptor networks, including via transcription of Ccl5, which is crucial. These changes inhibit antigen-primed cytotoxic CD8(+) T cell activity, permitting growth of FAK-expressing tumors. Mechanistically, nuclear FAK is associated with chromatin and exists in complex with transcription factors and their upstream regulators that control Ccl5 expression. Furthermore, FAK's immuno-modulatory nuclear activities may be specific to cancerous squamous epithelial cells, as normal keratinocytes do not have nuclear FAK. Finally, we show that a small-molecule FAK kinase inhibitor, VS-4718, which is currently in clinical development, also drives depletion of Tregs and promotes a CD8(+) T cell-mediated anti-tumor response. Therefore, FAK inhibitors may trigger immune-mediated tumor regression, providing previously unrecognized therapeutic opportunities.


Figures

None
Graphical abstract
Figure 1
Figure 1
Loss of FAK or FAK Kinase Activity Results in CD8+ T Cell-Dependent SCC Tumor Clearance (A and B) SCC FAK-WT and SCC FAK−/− subcutaneous tumor growth in immune-deficient CD-1 nude mice (A) and immune-competent FVB mice (B). (C and D) SCC FAK−/− (C) and SCC FAK-WT (D) tumor growth in FVB mice treated with T-cell-depleting antibodies. (E) Secondary tumor re-challenge with SCC FAK−/− (top) and SCC FAK-WT (middle) cells following a pre-challenge with SCC FAK−/− cells and a 7-day tumor-free period. Subcutaneous growth of SCC FAK-WT and SCC FAK−/− tumors injected at day 28 without pre-challenge (bottom). (F) Tumor growth in FVB mice following subcutaneous injection of SCC FAK-WT, SCC FAK−/−, and SCC FAK-KD cells. p < 0.05, ∗∗p or ++p < 0.01, ∗∗∗∗p < 0.0001; Sidak-corrected two-way ANOVA (A and B) or Tukey-corrected two-way ANOVA (C, versus SCC FAK−/−; D, versus SCC FAK-WT; F, , versus SCC FAK−/− and +, versus SCC FAK-KD). Data are represented as mean ± SEM; n = 5–6 tumors.
Figure 2
Figure 2
FAK-Depleted Tumors Exhibit a Heightened CD8+ T Cell Response (A) FACS quantification of total intra-tumoral CD4+ T cells. (B) FACS quantification of CD69+ cells as a percentage of CD4+ T cells. (C) FACS quantification of CD4+CD44hiCD62Llow, CD4+CD44hiCD62Lhi, CD4+CD44lowCD62Llow T cell subpopulations. (D) FACS quantification of total intra-tumoral CD8+ T cells. (E) FACS quantification of CD69+ cells as a percentage of CD8+ T cells. (F) Quantification of CD8+CD44hiCD62Llow, CD8+CD44hiCD62Lhi, CD8+CD44lowCD62Llow T cell subpopulations. (G) Changes in effector (CD8+CD44hiCD62Llow) CD8+ T cells normalized to total CD8+ T cell proportions. (H) FACS quantification of PD-1+LAG-3+ T cells as a percentage of CD8+CD44hi tumor-infiltrating T cells. n = 6 tumors. (I) FACS quantification of PD-1+Tim-3+ T cells as a percentage of CD8+CD44hi tumor-infiltrating T cells. n = 3 tumors. (J) FACS quantification of PD-1+Tim-3+LAG-3+ T cells as a percentage of CD8+CD44hi tumor-infiltrating T cells. n = 3 tumors. (K) FACS quantification of Ki-67+ cells as a percentage of tumor-infiltrating CD8+ T cells. n = 3 tumors. (L) Representative histological staining of CD8 in frozen sections from SCC FAK-WT, SCC FAK−/−, and SCC FAK-KD tumors. Dashed white lines demark tumor boundary. Scale bars, 500 μm. p < 0.05, ∗∗p < 0.01, ∗∗∗p < 0.001, ∗∗∗∗p < 0.0001; ns, not significant; Tukey-corrected one-way ANOVA (C and F, CD44hiCD62Llow only). Data are represented as mean ± SEM; n = 5 tumors unless stated.
Figure 3
Figure 3
FAK Regulates the Immuno-Suppressive Microenvironment (A) FACS quantification of Ly6Chi and Ly6Clow macrophage populations expressed as a percentage of tumor-infiltrating CD45+ leukocytes. (B) FACS quantification of Ly6ChiGr1low (M-MDSC) and Ly6CintGr1hi (G-MDSC) populations expressed as a percentage of tumor-infiltrating CD45+ leukocytes. (C) Quantification of CD4+CD25+FoxP3+ Tregs expressed as a percentage of tumor-infiltrating CD4+ T cells. (D) CD8+ T cell-to-Treg ratio calculated using mean values from Figures 2D and 3C. (E) SCC FAK-WT tumor growth in FVB mice treated with anti-CD25 depleting antibody. n = 6 tumors. or +p < 0.05, ++p < 0.01, ∗∗∗p < 0.001, ∗∗∗∗ or ++++p < 0.0001; Tukey-corrected one-way ANOVA (A, , Ly6Chi; +, Ly6Clow). Data are represented as mean ± SEM; n = 5 tumors unless stated.
Figure 4
Figure 4
FAK Regulates Transcription of Cytokines Implicated in Treg Recruitment and Expansion (A) Transcriptomic profiling of SCC FAK-WT and SCC FAK−/− cells. (B) Functional enrichment analysis of genes upregulated in SCC FAK-WT cells (bottom gray bar in A). Overrepresented biological processes are displayed as a heatmap (log10-transformed color scale) (top); asterisks indicate presence of cytokine-related genes. Overrepresented gene families are displayed as a bar chart (bottom). p < 0.05; Benjamini–Hochberg-corrected hypergeometric tests. (C) qRT-PCR array analysis of cytokine and chemokine expression in SCC FAK-WT and SCC FAK−/− cells. Gray bar indicates cluster of genes upregulated in SCC FAK-WT cells; cytokine and chemokine gene names are listed. Green arrowheads indicate reported roles in Treg recruitment; red arrowhead indicates reported role in peripheral Treg induction. (D) qRT-PCR array analysis of chemokine and receptor expression in tumor- and thymus-derived Tregs. Gray bar indicates cluster of genes upregulated in tumor-derived Tregs; receptor gene names are listed. (E) Interaction network analysis of chemokine ligand gene expression detected in SCC cells (circles, left) and corresponding receptor gene expression detected in Tregs (squares, right). Genes are ordered vertically by fold change. Light gray lines connect receptor-ligand pairs; green lines indicate pairs upregulated at least 2-fold in SCC FAK-WT cells and tumor-derived Tregs. (F) qRT-PCR analysis of selected cytokine and chemokine gene expression in SCC cells. ∗∗∗p < 0.001, ∗∗∗∗p < 0.0001; Tukey-corrected one-way ANOVA. Data are represented as mean ± SEM.
Figure 5
Figure 5
Nuclear FAK Regulates Transcription of Ccl5, which Is Required for Treg Recruitment and Tumor Growth (A) qRT-PCR analysis of Ccl5 gene expression knockdown in SCC FAK-WT cells stably expressing two independent shRNA constructs targeting Ccl5 (P1 and P2). (B) SCC FAK-WT shRNA-Ccl5 tumor growth in FVB mice. n = 6 tumors. (C) FACS quantitation of tumor-infiltrating Treg numbers from SCC FAK-WT shRNA-Ccl5 tumors. Data represent a single value from six pooled tumors. (D) Western blotting of cytoplasmic, nuclear, and total protein fractions from SCC FAK-WT, SCC FAK−/−, and SCC FAK-NLS cells. (E) qRT-PCR analysis of Ccl5 gene expression in SCC FAK-NLS cells. (F) Tumor growth of SCC FAK-NLS cells in FVB mice. (G) Western blotting of cytoplasmic, nuclear, and total protein fractions from SCC FAK-WT, SCC FAK−/−, and SCC FAK-KD cells. (H) Western blotting of whole-cell (WC) and nuclear (Nuc) protein fractions from SCC FAK-WT cells and primary skin keratinocytes. 60 s exposure time is shown for all samples; additional 10 min exposure time is shown for FAK in keratinocyte samples. GAPDH, cytoplasmic; PARP, nuclear. ∗∗∗p < 0.001, ∗∗∗∗p < 0.0001; Tukey-corrected one-way ANOVA. Data are represented as mean ± SEM unless stated.
Figure 6
Figure 6
Nuclear FAK Interacts with Regulators of Ccl5 Transcription (A) Sucrose fractionation of soluble chromatin prepared from SCC FAK-WT cell nuclei. Protein preparations recovered from each fraction were analyzed by western blotting (top). DNA recovered from each fraction was analyzed by agarose gel electrophoresis (bottom, 1 kilobase [kb] and 100 base pair [bp] ladders shown). Fraction 7 (black arrowhead) represents the chromatin-containing fraction. (B) Schematic detailing the workflow used for proteomic analysis of the nuclear FAK interactome in the context of Ccl5 transcription factors (TFs). (C) Interaction network analysis of proteins that bind FAK in the nucleus of SCC cells. Predicted Ccl5 TFs (squares, bottom) and respective TF binders (circles, top) enriched by at least 4-fold in nuclear FAK immunoprecipitations (SCC FAK-WT over SCC FAK−/− controls; p < 0.05) are shown (stringent network). Ccl5 TFs not detected (ND) are shown as gray squares. TF complexes or groups are indicated; proteins are labeled with gene names for clarity. TF binders are aligned above TF groups with which there are the greatest number of reported interactions. For full network, see Figure S6; for protein interaction list, see Table S1. (D) Isolation of the TFIID component TAF9 by FAK immunoprecipitation (IP) from SCC FAK-WT cell nuclear extracts.
Figure 7
Figure 7
The FAK Kinase Inhibitor VS-4718 Leads to Immune-Mediated SCC Clearance (A) SCC FAK-WT and SCC FAK−/− tumor growth in FVB mice treated with either vehicle or VS-4718. Treatment started 24 hr pre-tumor cell inoculation and continued for the duration of the experiment. (B) FACS analysis of cell viability from disaggregated tumors treated with either vehicle or VS-4718. (C) FACS analysis of vehicle- or VS-4718-treated tumor-infiltrating leukocytes expressed as a percentage of viable CD45+ cells relative to the total number of single cells. (D) FACS analysis of tumor-infiltrating CD4+ T cells from vehicle- or VS-4718-treated tumors. (E) FACS sub-categorization of tumor-infiltrating CD4+ T cells into CD45+CD3+CD4+CD8CD44hiCD62Llow, CD45+CD3+CD4+CD8CD44hiCD62Lhi, and CD45+CD3+CD4+CD8CD44lowCD62Llow populations. (F) FACS analysis of tumor-infiltrating CD8+ T cells from vehicle- or VS-4718-treated tumors. (G) FACS sub-categorization of tumor-infiltrating CD8+ T cells into CD45+CD3+CD4CD8+CD44hiCD62Llow, CD45+CD3+CD4CD8+CD44hiCD62Lhi, and CD45+CD3+CD4CD8+CD44lowCD62Llow populations. (H) FACS analysis of tumor-infiltrating CD4+CD25+FoxP3+ Tregs expressed as a percentage of tumor-infiltrating CD4+ T cells. (I) SCC FAK-WT tumor growth in FVB mice treated with either vehicle or VS-4718 and either isotype control or CD8-depleting antibodies. (J) SCC FAK-WT and SCC FAK−/− tumor growth in FVB mice treated with either vehicle or VS-4718. Treatment started 5 days post-tumor cell inoculation (gray dashed line) and continued for the duration of the experiment. p < 0.05, ∗∗p < 0.01, ∗∗∗p < 0.001, ∗∗∗∗p < 0.0001; ns, not significant; Tukey-corrected one-way ANOVA (E and G, CD44hiCD62Llow only). Data are represented as mean ± SEM; n = 6 tumors.
Figure S1
Figure S1
T Cell FACS Analysis Post Antibody-Mediated T Cell Depletion, Related to Figure 1 (A) FACS analysis of spleen and thymus tissue from non-tumor-bearing animals 6 days after commencing antibody treatment. (B) FACS analysis of T cell populations from spleen and thymus tissue from tumor-bearing animals at the end of T cell depletion studies in Figures 1C and 1D.
Figure S2
Figure S2
T Cell FACS Gating Strategy, Related to Figures 2 and 7 (A) FACS gating strategy applied for identification of T cell sub-populations. E = effector, CM = central memory, and N = naive. (B) FMO (full antibody set minus one) control samples used to determine correct gating for T cell sub-population identification.
Figure S3
Figure S3
Macrophage FACS Gating Strategy, Related to Figure 3 (A) FACS gating strategy applied for identification of macrophage sub-populations. (B) FMO control samples used to determine correct gating for macrophage sub-population identification.
Figure S4
Figure S4
MDSC and Treg FACS Gating Strategy, Related to Figures 3 and 7 (A) FACS gating strategy applied for identification of MDSC sub-populations. M-MDSC – Monocytic Myeloid Derived Suppressor Cell; G-MDSC – Granulocytic Myeloid Derived Suppressor Cell. (B) FMO control samples used to determine correct gating for MDSC sub-population identification. (C) FACS gating strategy applied for identification of regulatory T cells (Treg).
Figure S5
Figure S5
Tregs Infiltrating SCC FAK-WT Tumors Express the Thymic Marker Helios; Nuclear FAK Regulates Transcription of TGFβ2, which Contributes to Treg Expansion and Tumor Growth, Related to Figures 3 and 5 (A) FACS analysis of Helios expression in CD4+CD25+FOXP3+ SCC FAK-WT tumor-infiltrating Tregs and Tregs isolated from the thymus of tumor-bearing mice. Control represents background signal from a sample stained with CD4, CD25, and FoxP3 conjugated antibodies but not Helios. Representative replicates are shown in different colors for thymus and SCC FAK-WT samples. (B) qRT-PCR analysis of Tgfb2 gene expression knockdown in SCC cells. ∗∗∗∗p < 0.0001 (Tukey-corrected one-way ANOVA). (C) SCC FAK-WT shRNA-TGFβ2 tumor growth in FVB mice. Blue dashed line indicates growth of SCC FAK-WT shRNA-TGFβ2 tumors that had to be sacrificed due to ulceration at day 14. Red dashed line indicates growth of SCC FAK-WT shRNA-TGFβ2 tumors that showed no ulceration. Green solid line indicates the mean growth of all SCC FAK-WT shRNA-TGFβ2 tumors up until cohort numbers were reduced due to ulceration. n = 6 tumors / group. (D) FACS analysis of SCC FAK-WT shRNA-TGFβ2 tumor infiltrating Tregs. ∗∗∗∗p < 0.0001 (Tukey-corrected one-way ANOVA) (E) qRT-PCR analysis of Tgfb2 gene expression in SCC FAK-NLS mutant cells. ∗∗∗p < 0.001, ∗∗∗∗p < 0.0001 (Tukey-corrected one-way ANOVA). Data are represented as mean ± SEM.
Figure S6
Figure S6
Nuclear FAK Interactome in the Context of Ccl5 Transcription Factors, Related to Figure 6 and Table S1 (A) Interaction network analysis of proteins that bind FAK in the nucleus of SCC cells. Predicted Ccl5 transcription factors (TFs) (squares; bottom) and respective TF binders (circles; top) enriched by at least two-fold in nuclear FAK immunoprecipitations (SCC FAK-WT over SCC FAK−/− controls; p < 0.05) are shown. Ccl5 TFs not detected (ND) are shown as gray squares. TF complexes or groups are indicated; proteins are labeled with gene names for clarity. TF binders are aligned above TF groups with which there are the greatest number of reported interactions. Overrepresented molecular functions determined by functional enrichment analysis are displayed as a heat map (log10-transformed color scale) (inset). Displayed terms satisfy p < 0.01 (Benjamini–Hochberg-corrected hypergeometric test) with > 5 proteins assigned per term. (B) Topological analysis of Ccl5 TF–associated proteins identified in the nuclear FAK interactome. Ccl5 TF binders were clustered using the yFiles Organic algorithm implemented in Cytoscape. Topological parameters were computed using NetworkAnalyzer, excluding self-interactions. Protein node size is proportional to the number of interaction partners in the network (degree); node color indicates betweenness centrality (normalized number of shortest paths between proteins; a measure of the control a protein exerts over the interactions of other proteins in the network). Box-and-whisker plots (inset) show the distributions of degree and betweenness centrality for Ccl5 TF–associated proteins that bind nuclear FAK compared to those that were not enriched in nuclear FAK immunoprecipitations, indicating that FAK binders tend to have more interactions and be more central in the interaction network than undetected Ccl5 TF–associated proteins. Plots display the median (line), interquartile range (box) and 1.5 × interquartile range (whiskers) (n = 169 and 761 Ccl5 TF–associated proteins detected and not detected, respectively, with degree ≥ 1 based on physical or predicted interactions). ∗∗∗∗p < 0.0001 (two-tailed Mann–Whitney test). See also Table S1.
Figure S7
Figure S7
Analysis of FAK pY397 Phosphorylation in Tumors following Treatment with VS-4718, Related to Figure 7 Phosphorylation of FAK on Y397 was measured in protein lysates isolated from tumors following treatment with VS-4718 using ELISA. Tumors were removed within 30 min of treatment. n = 5. Data are represented as mean ± SEM.

References

    1. Albasri A., Fadhil W., Scholefield J.H., Durrant L.G., Ilyas M. Nuclear expression of phosphorylated focal adhesion kinase is associated with poor prognosis in human colorectal cancer. Anticancer Res. 2014;34:3969–3974. - PubMed
    1. Ali K., Soond D.R., Piñeiro R., Hagemann T., Pearce W., Lim E.L., Bouabe H., Scudamore C.L., Hancox T., Maecker H. Inactivation of PI(3)K p110δ breaks regulatory T-cell-mediated immune tolerance to cancer. Nature. 2014;510:407–411. - PMC - PubMed
    1. Ashton G.H., Morton J.P., Myant K., Phesse T.J., Ridgway R.A., Marsh V., Wilkins J.A., Athineos D., Muncan V., Kemp R. Focal adhesion kinase is required for intestinal regeneration and tumorigenesis downstream of Wnt/c-Myc signaling. Dev. Cell. 2010;19:259–269. - PMC - PubMed
    1. Beyer M., Schultze J.L. Regulatory T cells in cancer. Blood. 2006;108:804–811. - PubMed
    1. Biragyn A., Longo D.L. Neoplastic “Black Ops”: cancer’s subversive tactics in overcoming host defenses. Semin. Cancer Biol. 2012;22:50–59. - PMC - PubMed

Publication types

MeSH terms

Associated data