. 2024 Jan 26:13:e70276.
doi: 10.7554/eLife.70276.

Tempo and mode of gene expression evolution in the brain across primates

Affiliations

Tempo and mode of gene expression evolution in the brain across primates

Katherine Rickelton et al. Elife. .

Abstract

Primate evolution has led to a remarkable diversity of behavioral specializations and pronounced brain size variation among species (Barton, 2012; DeCasien and Higham, 2019; Powell et al., 2017). Gene expression provides a promising opportunity for studying the molecular basis of brain evolution, but it has been explored in very few primate species to date (e.g. Khaitovich et al., 2005; Khrameeva et al., 2020; Ma et al., 2022; Somel et al., 2009). To understand the landscape of gene expression evolution across the primate lineage, we generated and analyzed RNA-seq data from four brain regions in an unprecedented eighteen species. Here, we show a remarkable level of variation in gene expression among hominid species, including humans and chimpanzees, despite their relatively recent divergence time from other primates. We found that individual genes display a wide range of expression dynamics across evolutionary time reflective of the diverse selection pressures acting on genes within primate brain tissue. Using our samples that represent a 190-fold difference in primate brain size, we identified genes with variation in expression most correlated with brain size. Our study extensively broadens the phylogenetic context of what is known about the molecular evolution of the brain across primates and identifies novel candidate genes for the study of genetic regulation of brain evolution.

Keywords: brain; chromosomes; cis-regulation; evolutionary biology; gene expression; human; human evolution.


Conflict of interest statement

KR, TZ, JP, EM, JE, MR, WH, PH, CS, AB, CB No competing interests declared

Figures
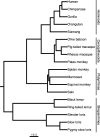
Figure 1.
Figure 1.. Primate phylogeny showing the eighteen species sampled in this study.
The scale bar for the branch lengths represents 10 million years of evolution. The phylogenetic tree is a consensus tree of 1000 iterations produced from 10kTrees v.3 (https://10ktrees.nunn-lab.org) based on data from GenBank. The insets demonstrate the approximate locations of the four brain regions sampled on a coronal section, midsagittal view, and lateral view (displayed left to right, respectively) of a schematized adult human brain.
Figure 2.
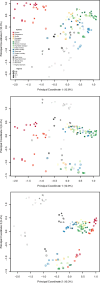
Figure 2.. Patterns of brain gene expression across primates.
The first three axes of a principal coordinates analysis (PCoA) are plotted in both rows but have different symbols and colors to emphasize expression patterns specific to taxa (upper row, a–c) and regions (lower row, d-f). Polygons in each plot surround the data points for taxa (upper row) and regions (lower row). Axes 1, 2, and 3 represent 12.8, 10.3, and 9.4% of variance, respectively.
Figure 2—figure supplement 1.
Figure 2—figure supplement 1.. The first three axes of the principal coordinates analysis (PCoA) are plotted in three bivariate plots.
This is the same plot as Figure 2 of the main text except here each species is plotted as a different color.
Figure 2—figure supplement 2.
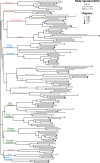
Figure 2—figure supplement 2.. Gene expression phenogram of all sampled data.
The phenogram was constructed from neighboring-joining tree estimation based on log2 fold-change distances of the 500 most variable genes based on standard deviation (the same distance matrix that constructed the principal coordinates analysis (PCoA)). Reproducibility of the nodes of the tree were estimated using a bootstrap analysis of 1000 iterations. Species common names are color-coded to indicate taxa (hominoid, pink; cercopithecoid, green; platyrrhine, blue; strepsirrhine, gray).
Figure 2—figure supplement 3.
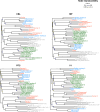
Figure 2—figure supplement 3.. Gene expression phenograms by region.
The phenograms were constructed using the same techniques as Supplementary data Figure 2. Species common names are color-coded to indicate taxa (hominoid, pink; cercopithecoid, green; platyrrhine, blue; strepsirrhine, gray).
Figure 3.
Figure 3.. Gene counts of differentially expressed (DE) genes between species and clades.
Each row represents one of the four brain regions examined. The size of the circle represents the number of DE genes seen at q<0.05 (5% FDR). The comparisons on the left are between exemplar species or sets of species, comparisons on the right are between clades of primates.
Figure 3—figure supplement 1.
Figure 3—figure supplement 1.. Box Plots of Pearson Rank-based Correlation Coefficients for multiple species and brain region comparisons.
The plot shows how each species’ expression patterns (rhesus macaque, baboon, and lemur) correlate with the DEGs of human and chimpanzee (yellow and green, respectively) samples for each brain region.
Figure 3—figure supplement 2.
Figure 3—figure supplement 2.. Upset Plot of each brain region (color) showing the shared DEGs for select species across the phylogeny.
Figure 4.
Figure 4.. Rates of change over genes and evolutionary time.
a. Exemplar genes that show constraint (left panel) and variation (right panel) across primates (colors as in Figure 2). b. Mean squared expression difference plotted by evolutionary distance to humans across all orthologs that were expressed. Shapes denote the four brain regions, and the colors represent the four major primate clades represented in our samples.
Figure 4—figure supplement 1.
Figure 4—figure supplement 1.. Region-specific plots of mean square expression differences over evolutionary time for each of the four brain regions analyzed.
Figure 5.
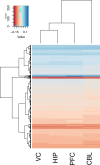
Figure 5.. Gene correlated with brain size by region.
A clustering and heatmap of the loadings from PC2 of genes for the four regions examined (V1, HIP, PFC, and CBL).
Figure 5—figure supplement 1.
Figure 5—figure supplement 1.. principal coordinates analysis (PCoA) of expression data from human samples of all four brain regions and primary neurons and astrocytes.
Symbols delineate the current study’s tissue samples from primary cell data. Colors distinguish cell type or brain region. Tissue-level human samples from all regions do not exhibit biased expression for either neurons or astrocytes.

Update of

References

    1. Azevedo FAC, Carvalho LRB, Grinberg LT, Farfel JM, Ferretti REL, Leite REP, Jacob Filho W, Lent R, Herculano-Houzel S. Equal numbers of neuronal and nonneuronal cells make the human brain an isometrically scaled-up primate brain. The Journal of Comparative Neurology. 2009;513:532–541. doi: 10.1002/cne.21974. - DOI - PubMed
    1. Babbitt CC, Fedrigo O, Pfefferle AD, Boyle AP, Horvath JE, Furey TS, Wray GA. Both noncoding and protein-coding RNAs contribute to gene expression evolution in the primate brain. Genome Biology and Evolution. 2010;2:67–79. doi: 10.1093/gbe/evq002. - DOI - PMC - PubMed
    1. Bagot RC, Cates HM, Purushothaman I, Lorsch ZS, Walker DM, Wang J, Huang X, Schlüter OM, Maze I, Peña CJ, Heller EA, Issler O, Wang M, Song WM, Stein JL, Liu X, Doyle MA, Scobie KN, Sun HS, Neve RL, Geschwind D, Dong Y, Shen L, Zhang B, Nestler EJ. Circuit-wide transcriptional profiling reveals brain region-specific gene networks regulating depression susceptibility. Neuron. 2016;90:969–983. doi: 10.1016/j.neuron.2016.04.015. - DOI - PMC - PubMed
    1. Barton RA. Embodied cognitive evolution and the cerebellum. Philosophical Transactions of the Royal Society of London. Series B, Biological Sciences. 2012;367:2097–2107. doi: 10.1098/rstb.2012.0112. - DOI - PMC - PubMed
    1. Blekhman R, Marioni JC, Zumbo P, Stephens M, Gilad Y. Sex-specific and lineage-specific alternative splicing in primates. Genome Research. 2010;20:180–189. doi: 10.1101/gr.099226.109. - DOI - PMC - PubMed

Associated data