. 2015 Dec 3;163(6):1400-12.
doi: 10.1016/j.cell.2015.11.009. Epub 2015 Nov 19.

Single-Cell Genomics Unveils Critical Regulators of Th17 Cell Pathogenicity

Affiliations

Single-Cell Genomics Unveils Critical Regulators of Th17 Cell Pathogenicity

Jellert T Gaublomme et al. Cell. .

Abstract

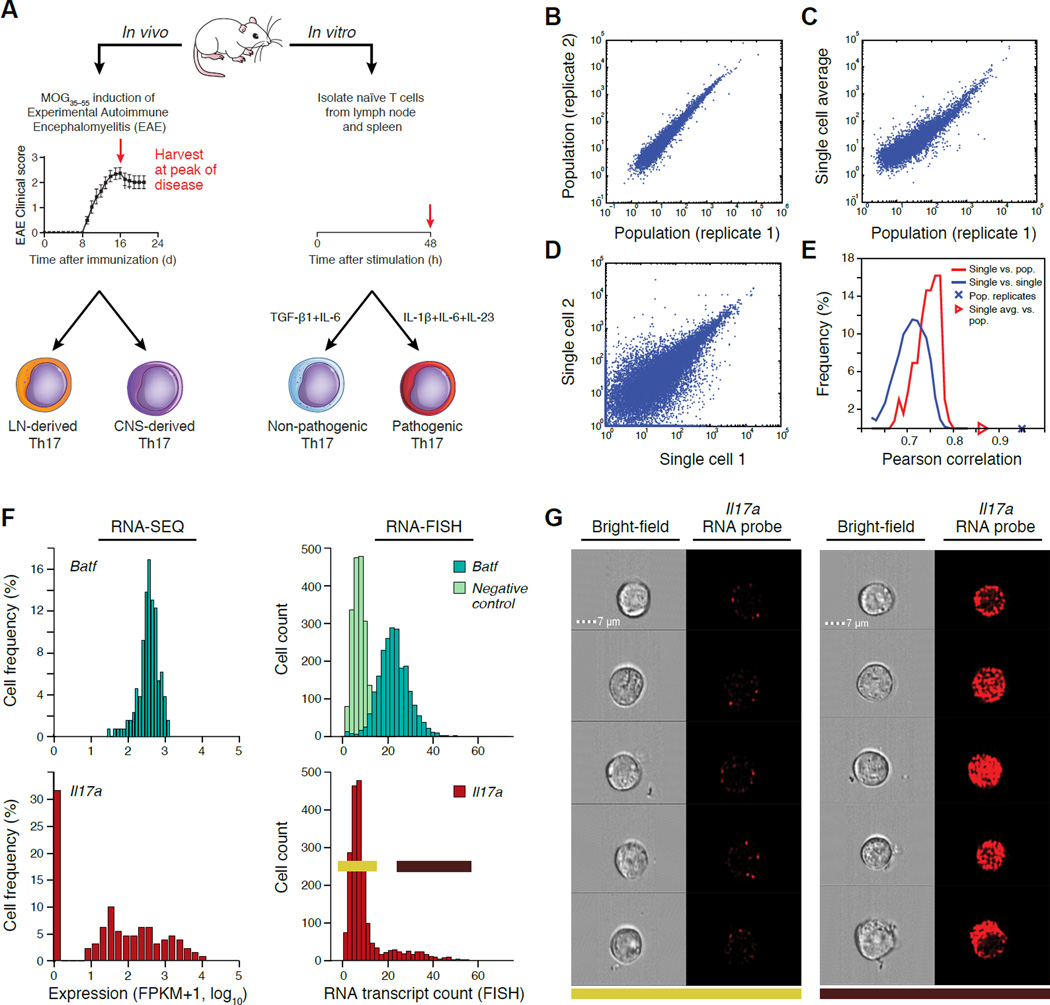
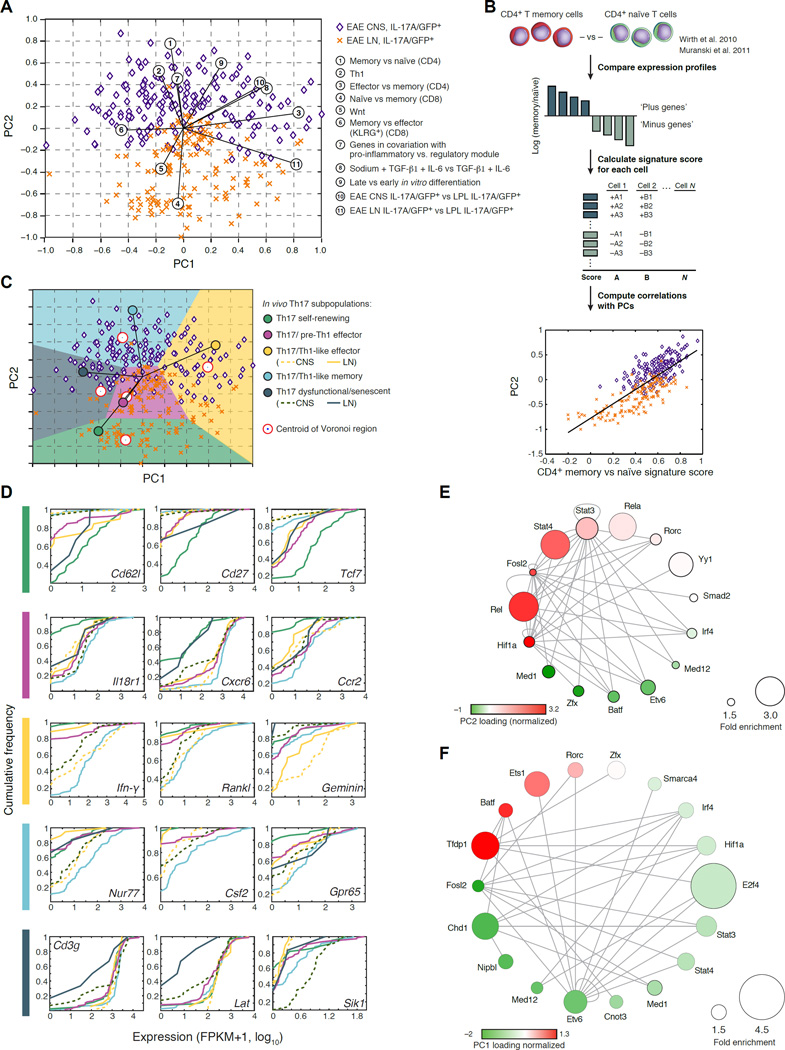
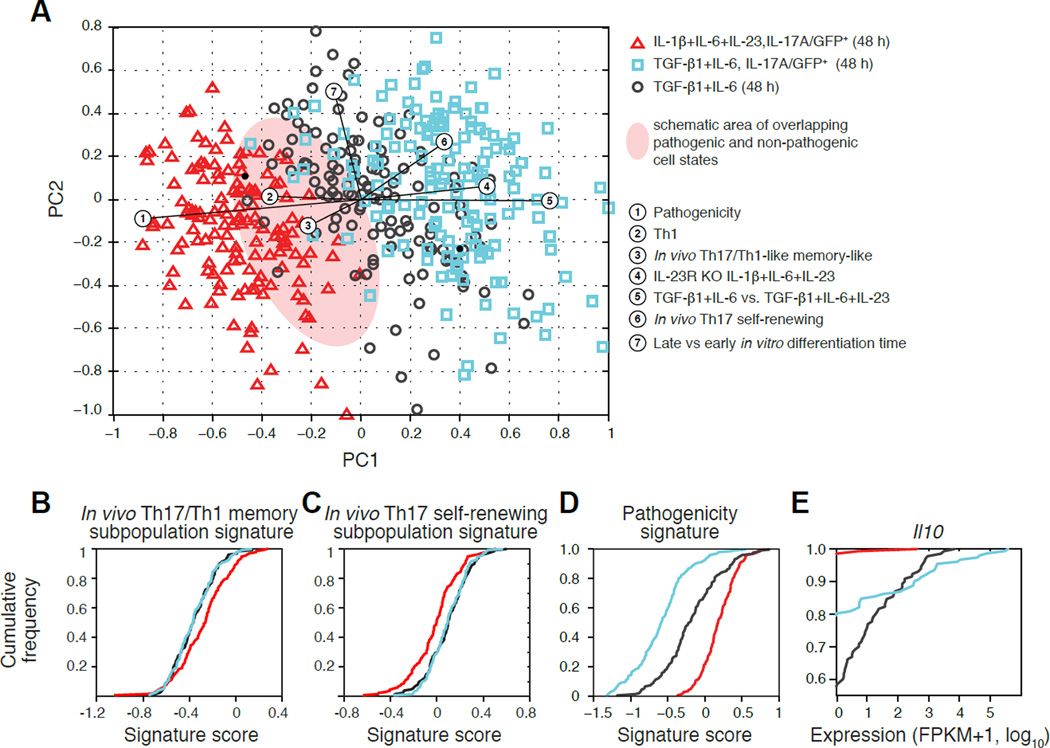
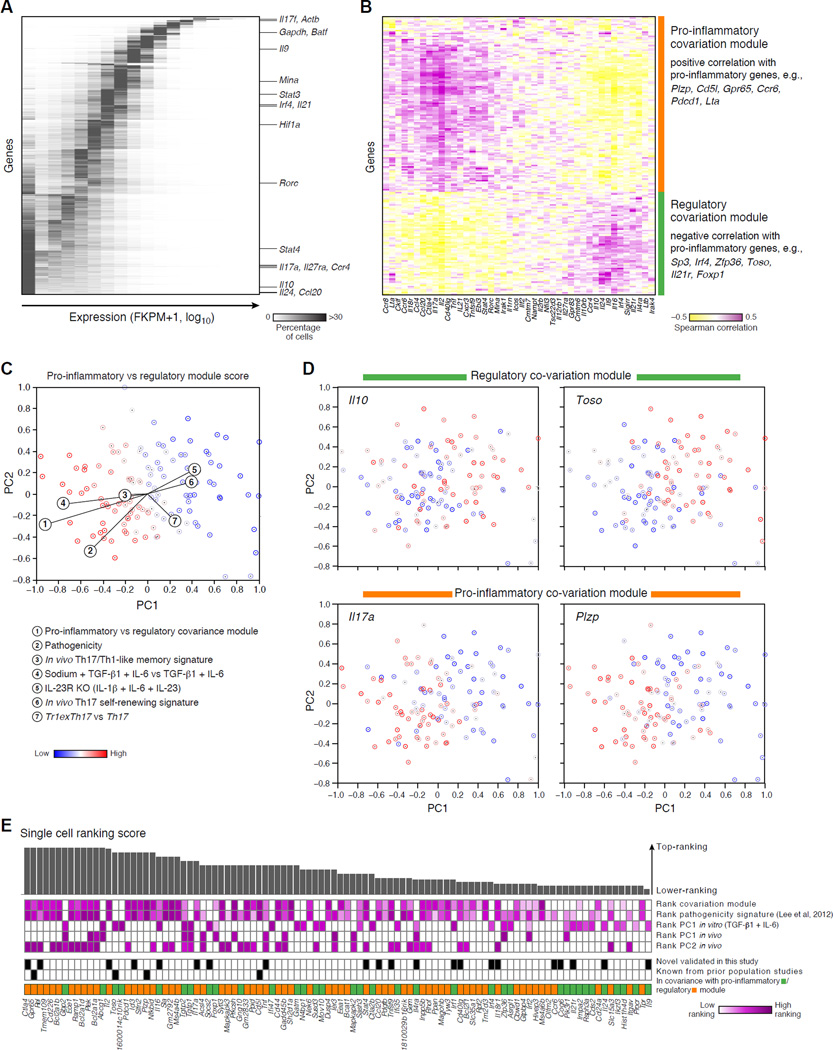
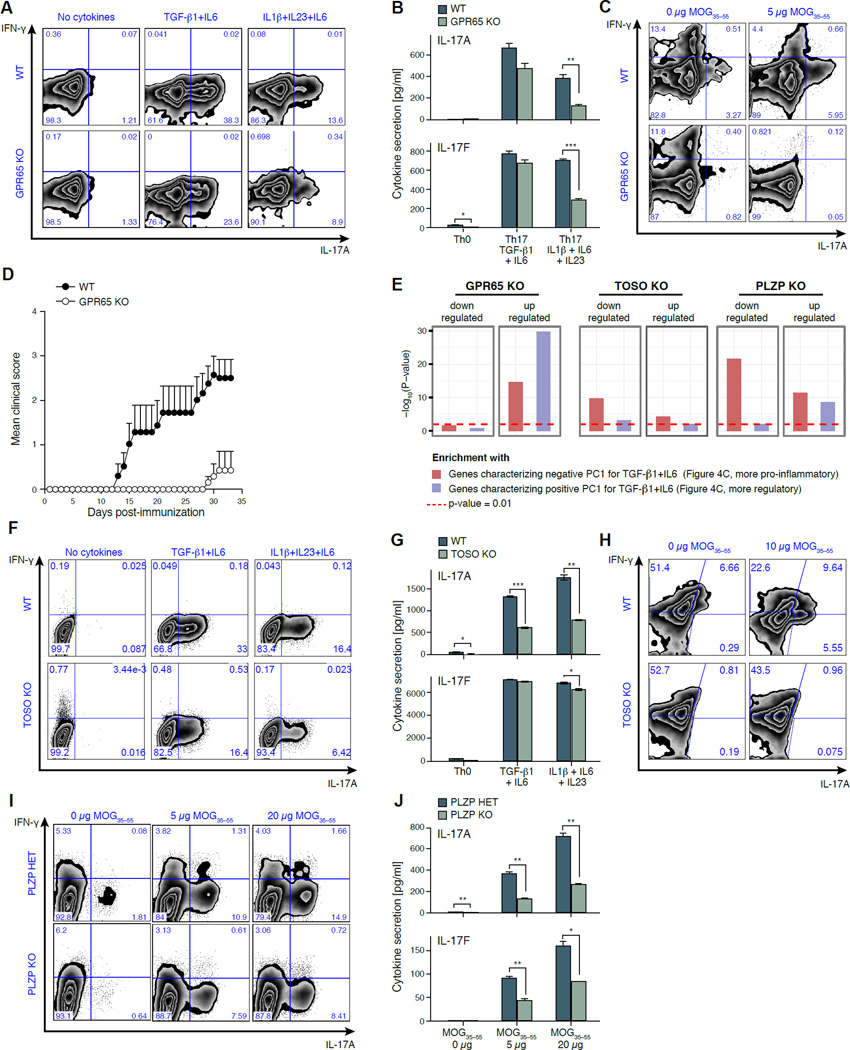
Extensive cellular heterogeneity exists within specific immune-cell subtypes classified as a single lineage, but its molecular underpinnings are rarely characterized at a genomic scale. Here, we use single-cell RNA-seq to investigate the molecular mechanisms governing heterogeneity and pathogenicity of Th17 cells isolated from the central nervous system (CNS) and lymph nodes (LN) at the peak of autoimmune encephalomyelitis (EAE) or differentiated in vitro under either pathogenic or non-pathogenic polarization conditions. Computational analysis relates a spectrum of cellular states in vivo to in-vitro-differentiated Th17 cells and unveils genes governing pathogenicity and disease susceptibility. Using knockout mice, we validate four new genes: Gpr65, Plzp, Toso, and Cd5l (in a companion paper). Cellular heterogeneity thus informs Th17 function in autoimmunity and can identify targets for selective suppression of pathogenic Th17 cells while potentially sparing non-pathogenic tissue-protective ones.


Figures

Figure 1
Figure 1. Single-cell RNA-seq of Th17 cells in vivo and in vitro
(A) Experimental setup. (B–E) Quality of single-cell RNA-seq. Scatter plots (B–D) compare transcript expression (FPKM+1, log10) from the in vitro TGF-β1+IL-6 48hr condition, between two bulk population replicates (B), the ‘average’ of single-cell profile and a matched bulk population control (C), or two single cells (D). Histograms (E) depict the distributions of Pearson correlation coefficients (X axis) between single cells and their matched population control and between pairs of single cells. (F,G) Comparison to RNA Flow-FISH. (F) Expression distributions by RNA-seq and RNA Flow-FISH at 48h under the TGF-β1+IL-6 in vitro condition. Negative control: bacterial DapB gene. (G) Bright-field and fluorescence channel images of RNA Flow-FISH in negative (left) and positive (right) cells. See also Figure S1, Table S1, related to Figure 1.
Figure 2
Figure 2. Th17 cells span a progressive trajectory of states from the LN to the CNS
(A) PCA separates CNS-derived cells from LN-derived cells. Shown are 302 cells in the space of the first two PCs. Numbered circles: signatures that significantly correlate with PC1 or PC2 (p < 10−6, Table S2, Supplemental Experimental Procedures). (B) Functional annotation. Top to bottom: Gene signatures are defined from literature, and a signature score is calculated for each single cell. The Pearson correlation coefficient is calculated between the signature score and the PC loading, for each cell and PC, and plotted on the PCA plot (circled numbers in (A)) (Supplemental Experimental Procedures). (C) Five progressive Th17-cell states from the LN to the CNS. Plot as in (A), but with Voronoi cells, defined by signatures (colored circles, Table S2) characterizing the cells populating the extremities of PCA space: Five signature-specific subpopulations are marked. The self-renewing state was observed in two technical replicates of one of the two in vivo biological replicates, potentially due to differences in disease induction or progression. (D) Example genes that distinguish each sub-population. Cumulative distribution function (CDF) plots of expression for key selected genes. Dotted/solid line corresponds to CNS/LN cells respectively, where appropriate. (E,F) Transcription factors (nodes) whose targets are significantly enriched in PC2 (E) or PC1 (F). Nodes are sized proportionally to fold enrichment (Table S3) and colored according to the loading of the encoding gene in the respective PC (loadings were normalized to have zero mean and standard deviation of 1). See also Figure S2–S4, Table S2–4, related to Figure 2.
Figure 3
Figure 3. A spectrum of pathogenicity states in vitro
(A) PCA plot of Th17 cells differentiated in vitro. PC1 separates cells from most (left) to least (right) pathogenic, as indicated both by the differentiation condition (color code), and by the correlated signatures (numbered circles). (B–D) Key signatures related to pathogenicity. CDFs of the single-cell scores for key signatures for the three in vitro populations (colored as in A): (B) a signature distinguishing the in vivo Th17/Th1-like memory sub-population (blue in Figure 2C); (C) a signature distinguishing the in vivo Th17 self-renewing sub-population (green in Figure 2C); and (D) a signature of pathogenic Th17 cells (Lee et al., 2012). (E) CDFs of expression level (FPKM+1, log10) of Il10 for the three in vitro populations. See also Table S2, related to Figure 3.
Figure 4
Figure 4. Modules of genes that co-vary with pro-inflammatory and regulatory genes across single cells
(A) Single-cell expression distribution of genes. The heat map shows for each gene (row) its expression distribution across single cells differentiated under the TGF-β1+IL-6 condition for 48h (without further IL-17A-based sorting). Color scale: proportion of cells expressing in each of the 17 expression bins (columns). Genes are sorted from more unimodal (top) to bimodal (bottom). (B) Modules co-varying with pro-inflammatory and regulatory genes. Heat map of the Spearman correlation coefficients between the single-cell expression levels of signature genes of pathogenic T cells (Lee et al., 2012) or of other CD4+ lineages (columns) and the single-cell expression of any other bimodally expressed gene (rows) in cells differentiated under the TGF-β1+IL-6 condition at 48h. Genes are clustered. (C) The modules co-varying with pro-inflammatory and regulatory genes distinguish key variation. Each cell (TGF-β1+IL-6, 48h) is colored by a signature score comparing the two co-variation modules. (D) Expression of key module genes. Each panel shows the PCA plot of (C) where cells are colored by an expression ranking score of a key gene, denoted on top. (E) A ranking of the top 100 candidate genes co-varying with pro-inflammatory or regulatory genes (out of 184; Table S5), sorting from high (left) to lower (right) ranking scores (bar chart, Supplemental Experimental Procedures). See also Figure S5 and S6, Table S2&S5 related to Figure 4.
Figure 5
Figure 5. GPR65, TOSO and PLZP are validated as T-cell pathogenicity regulators
(A,B) Reduction in IL17A-producing cells in GPR65−/− T-cells differentiated in vitro. (A) Intracellular cytokine staining for IFN-γ and IL-17A of CD4+ WT or GPR65−/− cells differentiated for 96h. (B) Quantification of secreted IL-17A and Il-17F by cytometric bead assays (CBA) in corresponding samples. * p < 0.05, ** p < 0.01, *** p < 0.001. (C) Reduced IL-17A and IFN-γ production by GPR65−/− memory (CD62LCD44+CD4+) T cells in a recall assay (Supplemental Experimental Procedures). (D) Loss of GPR65 reduces tissue inflammation and autoimmune disease in vivo. RAG-1−/− mice (n = 10 per category) were reconstituted with 2×10⁶ naïve WT or GPR65−/− CD4+ T-cells, and induced with EAE one week post transfer. Error bars: standard deviation. (E) Transcriptional impact of a loss of GPR65, TOSO and PLZP. Shown is the significance of enrichment (−log10 (P-value); hypergeometric test, Y axis) of genes that are dysregulated compared to WT during the TGF-β1+IL-6 differentiation of GPR65−/− (96h), PLZP−/− (48h) and TOSO−/− (96h) cells. (F,G) Reduction in IL17A-producing cells in TOSO−/− T cells differentiated in vitro. (F) Intracellular cytokine staining as in (A) but for WT or TOSO−/− CD4+ T-cells, activated in vitro for 96h. (G) Quantification of secreted IL-17A and IL-17F for WT or TOSO−/− CD4+ T cells, as in (B). (H) Reduced IL-17A production by TOSO−/− LN memory T cells in a recall assay as in (C). (I) Hampered IL-17A production by PLZP−/− CD4+ T cells in an in vitro recall assay (Supplemental Experimental Procedures). Intracellular cytokine staining for IFN-γ (Y axis) and IL-17A (X axis). (J) Quantification of secreted IL-17A and IL-17F of a MOG35–55 recall assay for littermate controls and PLZP−/− mice at 96h post ex vivo. All experiments are a representative of at least three independent experiments with at least three experimental replicates per group. See also Figure S7, Table S6 related to Figure 5.

Comment in

References

    1. Antebi YE, Reich-Zeliger S, Hart Y, Mayo A, Eizenberg I, Rimer J, Putheti P, Pe'er D, Friedman N. Mapping differentiation under mixed culture conditions reveals a tunable continuum of T cell fates. PLoS biology. 2013;11:e1001616. - PMC - PubMed
    1. Aust G, Kamprad M, Lamesch P, Schmucking E. CXCR6 within T-helper (Th) and T-cytotoxic (Tc) type 1 lymphocytes in Graves' disease (GD) European journal of endocrinology / European Federation of Endocrine Societies. 2005;152:635–643. - PubMed
    1. Bending D, De la Pena H, Veldhoen M, Phillips JM, Uyttenhove C, Stockinger B, Cooke A. Highly purified Th17 cells from BDC2.5NOD mice convert into Th1-like cells in NOD/SCID recipient mice. The Journal of clinical investigation. 2009;119:565–572. - PMC - PubMed
    1. Blaschitz C, Raffatellu M. Th17 cytokines and the gut mucosal barrier. Journal of clinical immunology. 2010;30:196–203. - PMC - PubMed
    1. Ciofani M, Madar A, Galan C, Sellars M, Mace K, Pauli F, Agarwal A, Huang W, Parkurst Christopher N, Muratet M, et al. A Validated Regulatory Network for Th17 Cell Specification. Cell. 2012 - PMC - PubMed

Publication types

MeSH terms

Associated data