Review
. 2022 Jul 12:11:e75804.
doi: 10.7554/eLife.75804.

Exploring the expression patterns of palmitoylating and de-palmitoylating enzymes in the mouse brain using the curated RNA-seq database BrainPalmSeq

Affiliations
Review

Exploring the expression patterns of palmitoylating and de-palmitoylating enzymes in the mouse brain using the curated RNA-seq database BrainPalmSeq

Angela R Wild et al. Elife. .

Abstract

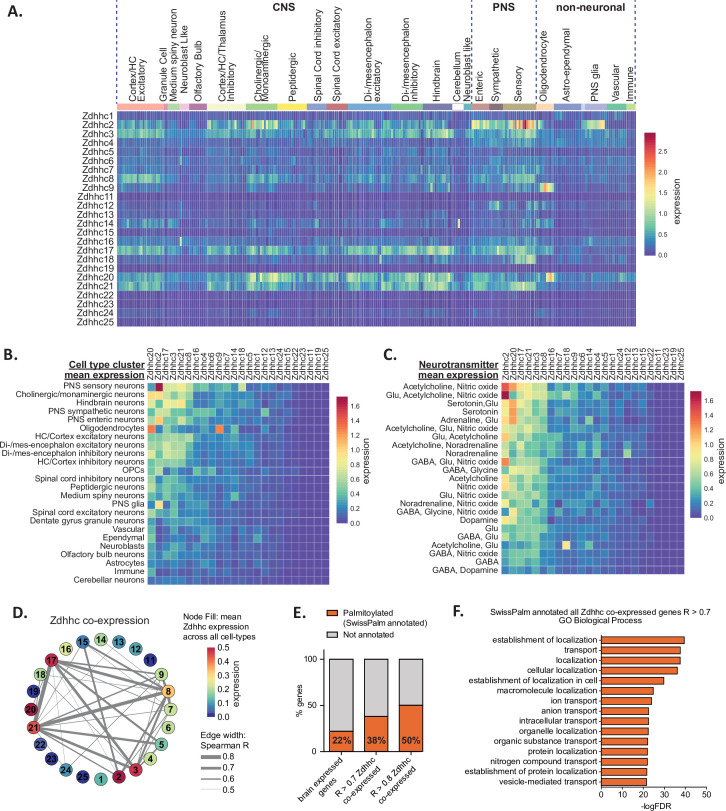
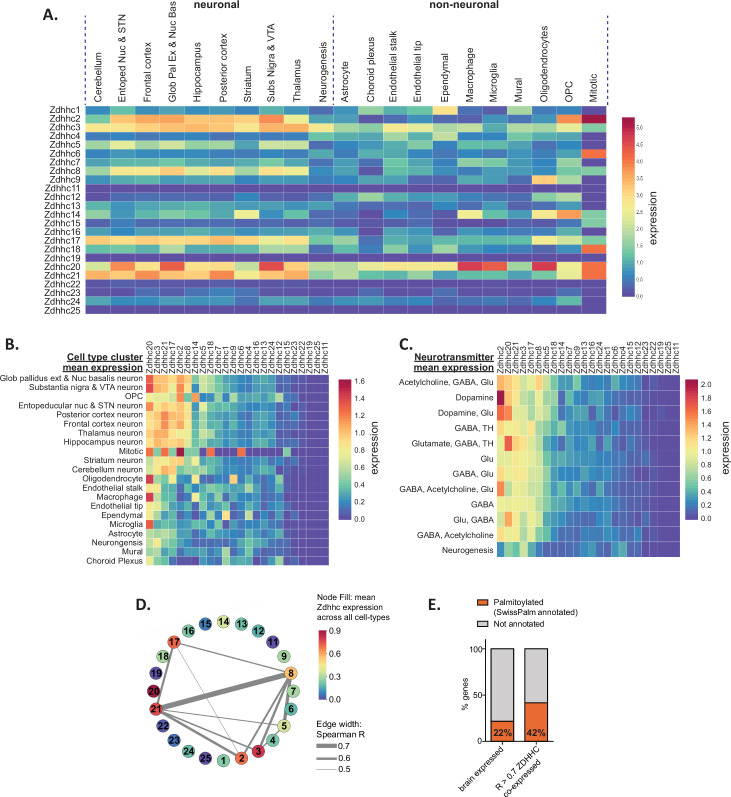
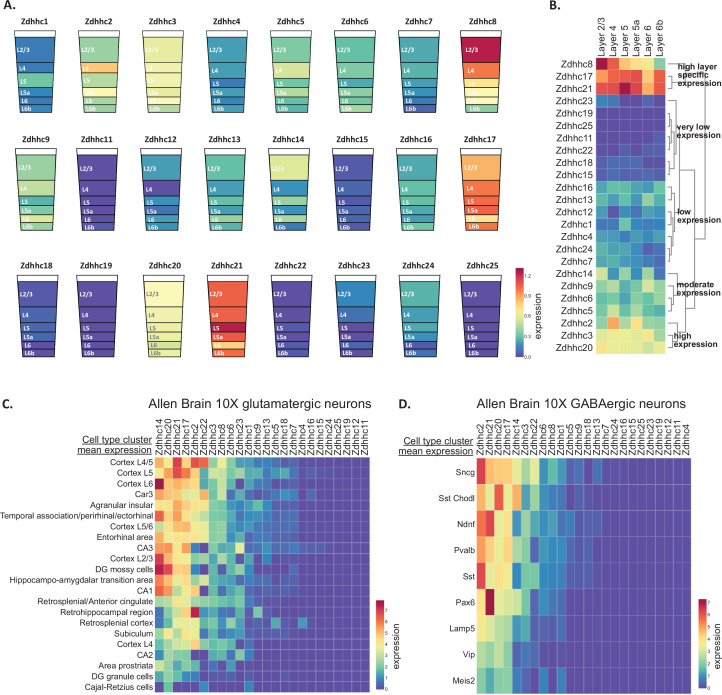
Protein S-palmitoylation is a reversible post-translational lipid modification that plays a critical role in neuronal development and plasticity, while dysregulated S-palmitoylation underlies a number of severe neurological disorders. Dynamic S-palmitoylation is regulated by a large family of ZDHHC palmitoylating enzymes, their accessory proteins, and a small number of known de-palmitoylating enzymes. Here, we curated and analyzed expression data for the proteins that regulate S-palmitoylation from publicly available RNAseq datasets, providing a comprehensive overview of their distribution in the mouse nervous system. We developed a web-tool that enables interactive visualization of the expression patterns for these proteins in the nervous system (http://brainpalmseq.med.ubc.ca/), and explored this resource to find region and cell-type specific expression patterns that give insight into the function of palmitoylating and de-palmitoylating enzymes in the brain and neurological disorders. We found coordinated expression of ZDHHC enzymes with their accessory proteins, de-palmitoylating enzymes and other brain-expressed genes that included an enrichment of S-palmitoylation substrates. Finally, we utilized ZDHHC expression patterns to predict and validate palmitoylating enzyme-substrate interactions.

Keywords: RNAseq; ZDHHC enzymes; brain; database; expression patterns; human; mouse; neuroscience; palmitoylation.


Conflict of interest statement

AW, PH, SF, GN, RH, DA, KH, SB No competing interests declared

Figures

Figure 1.
Figure 1.. Heterogeneous ZDHHC expression in the mouse nervous system.
(A) Heatmap showing expression for the 24 ZDHHC genes, extracted from scRNAseq study of mouse CNS and PNS (Zeisel et al., 2018). Each column represents one of the 265 metacells classified in the study. Metacells are organized along x-axis according to hierarchical clustering designations generated by Zeisel et al. Full metadata for this study available on BrainPalmSeq. (B) Heatmap showing mean ZDHHC expression per hierarchical cluster, with columns and rows sorted by descending mean ZDHHC expression per row/column. (C) Heatmap showing mean ZDHHC expression per neurotransmitter cluster for all PNS and CNS neurons. Columns and rows are sorted as in B. (D) Correlation network showing ZDHHC co-expression across all metacells in ‘MouseBrain’ (Spearman R>0.5). Numbers in nodes correspond to ZDHHC number. Node color represents mean expression across all metacells. Edge thickness represents strength of correlation. (E) Graph showing proportion of genes from ‘MouseBrain’ dataset that are co-expressed with one or more ZDHHC and also substrates for S-palmitoylation (SwissPalm annotated). ‘Brain expressed’ n=15,389 protein coding genes expressed in the postnatal mouse brain, curated from the MGI RNAseq studies database. ‘R>0.7 ZDHHC co-expressed’ n=914 genes co-expressed with one or more ZDHHC (Spearman R>0.7). ‘R>0.8 ZDHHC co-expressed’ n=167 genes co-expressed with one or more ZDHHC (Spearman R>0.8). Brain expressed vs. R>0.7: p<0.001; R>0.7 vs R>0.8: p<0.01; Fisher’s exact test. (F) Graph of GO biological process analysis. Gene IDs from the ‘MouseBrain’ dataset (Zeisel et al., 2018) that showed correlated expression with one or more ZDHHC (R>0.7) and were also Uniprot reviewed and SwissPalm annotated were used as input. Units for all heatmaps in figure: mean log2(counts per 10,000+1).
Figure 1—figure supplement 1.
Figure 1—figure supplement 1.. Heterogeneous ZDHHC expression in the mouse brain.
(A) Heatmap showing expression for the 24 ZDHHC genes, extracted from ‘DropViz’ scRNAseq study of mouse brain (Saunders et al., 2018). Each column represents metacell averages. Metacells are organized along x-axis according to brain region (neuronal) or class (non-neuronal). Full metadata for this study available on BrainPalmSeq. (B) Heatmap showing mean Zdhhc expression per brain region/class, with columns and rows sorted by descending mean Zdhhc expression per row/column. (C) Heatmap showing mean Zdhhc expression per neurotransmitter cluster for neurons from all brain regions. Columns and rows are sorted as in B. (D) Correlation network showing ZDHHC co-expression across all metacells in ‘DropViz’ (Spearman R>0.5). Numbers in nodes correspond to ZDHHC number. Node color represents mean expression across all metacells. Edge thickness represents strength of correlation. (E) Graph showing proportion of genes from ‘DropViz’ dataset that are co-expressed with one or more ZDHHC and also substrates for S-palmitoylation (SwissPalm annotated). ‘Brain expressed’=15,389 protein coding genes expressed in the postnatal mouse brain, curated from the MGI RNAseq studies database. ‘R>0.7 ZDHHC co-expressed’=676 genes co-expressed with one or more ZDHHC (Spearman R>0.7). Units for all heatmaps in figure: mean log2(counts per 10,000+1).
Figure 1—figure supplement 2.
Figure 1—figure supplement 2.. Correlation of Zdhhc enzymes that are known to be involved in palmitoylation cascades.
(A) Plot of Zdhhc5 vs Zdhhc20 expression across 265 identified cell types from ‘MouseBrain’ dataset. Expression units: mean log2(counts per 10,000+1). Arrows/labels indicate ‘MouseBrain’ cell types that have high expression of both genes. Legend below indicates annotation of these cell types. (B) As (A), but for Zdhhc6 vs Zdhhc16.
Figure 2.
Figure 2.. Diversity in ZDHHC expression and S-palmitoylation substrate expression in the hippocampus.
(A) Heatmap of excitatory neuron ZDHHC expression from dorsal hippocampus (original pooled cell RNAseq data from Cembrowski et al., 2016) projected onto diagrams of dorsal hippocampus. (B) Hierarchical clustering of ZDHHC expression data in A. (C) Heatmap showing top 6 ranked expressing ZDHHCs in dorsal CA1 in descending order. (D) Pie chart showing proportion genes with enriched expression in dorsal CA1 (dCA1) that are also substrates for palmitoylation (SwissPalm annotated). (E) KEGG analysis of the dCA1 enriched/SwissPalm annotated genes. (F) SynGO analysis of the dCA1 enriched/SwissPalm annotated genes. (G–J) As in (C)-(F) but for the dorsal dentate gyrus (dDG). Heatmap legend in (A) applies to all heatmaps (logFPKM +1).
Figure 2—figure supplement 1.
Figure 2—figure supplement 1.. Heterogeneous ZDHHC expression in excitatory neurons of the hippocampus.
(A) Heatmaps showing ZDHHC expression data from BrainPalmSeq for excitatory neurons of indicated subregions of the hippocampus. Original data are from ‘Hipposeq’ (Cembrowski et al., 2016; units: FPKM), ‘DropViz’ (Saunders et al., 2018; units: mean log2(counts per 10,000+1)) and Allen Mouse Brain 10 X atlas (Yao et al., 2021; units: Trimmed Mean (25–75%) Log2(CPM +1)). (B) Expression maps from Figure 2A with in-situ hybridization images from Allen Brain ISH. White scale bar = 500 μm.
Figure 3.
Figure 3.. Pyramidal neuron layer specific ZDHHC expression.
(A) Heatmap of excitatory neuron ZDHHC expression from somatosensory cortex (original data scRNAseq data from Zeisel et al., 2015) projected onto diagrams of cortical layers. (B) Hierarchical clustering of ZDHHC expression data in A. Heatmap units in (A, B): mean log2(counts per 10,000+1) (C) Heatmap of scRNAseq data from Allen Brain 10 X genomics (Yao et al., 2021). Data are represented as mean ZDHHC expression per excitatory neuron subtype, with columns and rows sorted by descending mean ZDHHC expression per row/column. (D) As in (C) but for inhibitory neuron subtypes. Heatmap units for (C, D): trimmed mean (25–75%) Log2(CPM +1).
Figure 3—figure supplement 1.
Figure 3—figure supplement 1.. Heterogeneous ZDHHC expression in excitatory neurons of the cortex.
(A) Heatmaps showing ZDHHC expression data from BrainPalmSeq for excitatory neurons of indicated layers of the cortex. Original data are from somatosensory cortex Zeisel et al., 2015; units: mean log2(counts per 10,000+1); ‘MouseBrain’ Zeisel et al., 2018; mean log2(counts per 10,000+1); ‘DropViz’ posterior cortex Saunders et al., 2018; units: mean log2(counts per 10,000+1) and Allen Mouse Brain 10 X atlas intertelencephalic neurons Yao et al., 2021; units: Trimmed Mean (25–75%) Log2(CPM +1). (B) Expression maps from Figure 3A with in-situ hybridization images of somatosensory cortex from Allen Brain ISH. White scale bar = 250 μm.
Figure 4.
Figure 4.. Heterogeneous de-palmitoylating enzyme and ZDHHC accessory protein expression in the mouse nervous system.
(A) Heatmap showing expression of de-palmitoylating enzymes (top) and ZDHHC accessory subunits (bottom), extracted from scRNAseq study of mouse CNS and PNS (Zeisel et al., 2018). Each column represents one of the 265 metacells classified in the study. Metacells are organized according to hierarchical clustering designations generated by Zeisel et al. (B) Heatmap showing mean de-palmitoylating enzyme expression per hierarchical cluster, with columns and rows sorted by descending mean ZDHHC expression per row/column. (C) As B but for ZDHHC accessory proteins. (D) Correlation network showing ZDHHC co-expression with de-palmitoylating enyzmes and accessory proteins across all metacells in ‘MouseBrain’ (Spearman R>0.4). Node color represents mean expression across all metacells. Edge thickness represents strength of correlation.
Figure 4—figure supplement 1.
Figure 4—figure supplement 1.. Heterogeneous de-palmitoylating enzyme and accessory protein expression in mouse brain.
(A) Heatmap showing expression for the 6 depalmitoylating enzyme genes and 3 accessory protein genes extracted from ‘DropViz’ scRNAseq study of mouse brain (Saunders et al., 2018). Each column represents metacell averages. Metacells are organized along x-axis according to brain region (neuronal) or class (non-neuronal). Full metadata for this study available on BrainPalmSeq. Expression units: mean log2(counts per 10,000+1). (B) Heatmap showing mean expression of the 6 depalmitoylating enzyme genes per brain region/class, with columns and rows sorted by descending mean gene expression per row/column. (C) Heatmap showing mean expression of the 3 accessory protein genes per brain region/class, with columns and rows sorted by descending mean gene expression per row/column.
Figure 4—figure supplement 2.
Figure 4—figure supplement 2.. Correlation of Zdhhc enzymes and their known accessory proteins.
(A) Plot of Zdhhc5 vs Golga7b expression across 265 identified cell types from ‘MouseBrain’ dataset. Expression units: mean log2(counts per 10,000+1). Arrows/labels indicate ‘MouseBrain’ cell types that have high expression of both genes. Legend below indicates annotation of these cell types. (B) As (A), but for Zdhhc9 vs Golga7. (C) As (A), but for Zdhhc6 vs Selenok.
Figure 4—figure supplement 3.
Figure 4—figure supplement 3.. Cell-type enrichment of ZDHHC and depalmitoylating enzyme protein.
(A) Bioinformatic workflow to calculate mRNA and protein z-scores in each major brain cell type. (B) Heatmaps showing genes with mRNA and protein predominantly enriched in astrocytes. (C–F) As (B), but for microglia, neurons, oligodendrocytes and inconsistently enriched cells. (G) Graph showing correlation of protein vs RNA z-scores for all genes in each of the cell types investigated.
Figure 5.
Figure 5.. Disease associated palmitoylating enzyme regional and cell-type expression overlays with brain pathology in associated LOF disorders.
(A) Heatmap showing ranked Zdhhc8 expressing neuronal and glial cell types in descending order. Original data from scRNAseq neonatal mouse brain study; Rosenberg et al., 2018. Cell types were averaged as described in Supplementary file 1. Heatmap units: mean log2(counts per 10,000+1). (B) As in A, but original data from scRNAseq adolescent mouse brain study Zeisel et al., 2018. Heatmap units: mean log2(counts per 10,000+1). (C) Heatmap of Zdhhc8 expression from whole brain regional bulk RNAseq data (original data from ‘Protein Atlas’; Sjöstedt et al., 2020) projected onto anatomical map of mouse brain. Heatmap units: pTPM. (D–F) As in (A)-(C) but for Zdhhc9. (G–I) As in (A)-(C) but for Ppt1.
Figure 5—figure supplement 1.
Figure 5—figure supplement 1.. Anatomical sampling for bulk RNAseq study.
(A) Diagram illustrating anatomical brain regions for bulk RNA expression data from Figure 5 (Sjöstedt et al., 2020).
Figure 6.
Figure 6.. Validation of projected S-palmitoylation substrates of Zdhhc9 derived from cell-type enriched expression.
(A) Graph of expression data for Zdhhc9 extracted from BrainPalmSeq. Original data from oligodendrocyte scRNAseq study by Marques et al. Expression units: mean log2(counts per 10,000+1). (B) Diagram illustrating workflow to generate a list of oligodendrocyte enriched palmitoylation substrates, GO annotated for myelin sheath for experimental validation. (C) STRING diagram of myelin sheath annotated palmitoylation substrates. (D) Western blot following Acyl-RAC palmitoylation assay in HEK293 cells to identify palmitoylated and unpalmitoylated fractions of FLAG-MOBP either without or with co-transfection of FLAG-GOLGA7 and HA-ZDHHC9. Input = unprocessed protein lysate. NSB control = non-specific binding of protein to sepharose resin in control pipeline. Palm fraction = palmitoylated protein. Unpalm fraction = unpalmitoylated protein. (E–F) As in (D) but for FLAG-PLP1 (E) or FLAG-CNP (F). (G) Graphs quantifying the ratio of palmitoylated to unpalmitoylated protein either with or without co-transfections with FLAG-GOLGA7 and HA-ZDHHC9. n=4–6 HEK cell cultures per condition. Statistics shown for palmitoylated fraction. Two-way ANOVA; Šídák’s post hoc; mean ± SEM. MOBP: p=0.0004, 95% CI –0.6594 to –0.2266; PLP1: p=0.0046, 95% CI –0.1660 to –0.03011; CNP: p=0.6981, 95% CI –0.3274–0.1742.
Figure 6—figure supplement 1.
Figure 6—figure supplement 1.. GO cellular component analysis for oligodendrocyte enriched genes.
(A) Graph of GO cellular component analysis. Gene IDs from the full Marques oligodendrocyte dataset (Marques et al., 2016) that were enriched in MFOL and MOL subtypes and were also Uniprot reviewed and SwissPalm annotated were used as input.
Figure 6—figure supplement 2.
Figure 6—figure supplement 2.. Palmitoylation of myelin proteins in Zdhhc9 KO mice.
(A) Western blot following Acyl-RAC palmitoylation assay in WT or Zdhhc9 KO half-brains to identify palmitoylated and unpalmitoylated fractions of CNP, PLP1 and MOBP. Input = unprocessed protein lysate. Palm fraction = palmitoylated protein. Unpalm fraction.=unpalmitoylated protein. (B) Graphs quantifying the ratio of palmitoylated to unpalmitoylated protein in WT or Zdhhc9 KO mice. n=2–3 animals per condition. Statistics shown for palmitoylated fraction. Two-way ANOVA; Šídák’s post hoc; mean ± SEM. ns = not significant.

References

    1. Abrami L, Dallavilla T, Sandoz PA, Demir M, Kunz B, Savoglidis G, Hatzimanikatis V, van der Goot FG. Identification and dynamics of the human ZDHHC16-ZDHHC6 palmitoylation cascade. eLife. 2017;6:e27826. doi: 10.7554/eLife.27826. - DOI - PMC - PubMed
    1. Baker K, Astle DE, Scerif G, Barnes J, Smith J, Moffat G, Gillard J, Baldeweg T, Raymond FL. Epilepsy, cognitive deficits and neuroanatomy in males with ZDHHC9 mutations. Annals of Clinical and Translational Neurology. 2015;2:559–569. doi: 10.1002/acn3.196. - DOI - PMC - PubMed
    1. Bathelt J, Astle D, Barnes J, Raymond FL, Baker K. Structural brain abnormalities in a single gene disorder associated with epilepsy, language impairment and intellectual disability. NeuroImage. Clinical. 2016;12:655–665. doi: 10.1016/j.nicl.2016.07.016. - DOI - PMC - PubMed
    1. Bathelt J, Barnes J, Raymond FL, Baker K, Astle D. Global and local connectivity differences converge with gene expression in a neurodevelopmental disorder of known genetic origin. Cerebral Cortex. 2017;27:3806–3817. doi: 10.1093/cercor/bhx027. - DOI - PMC - PubMed
    1. Bird CM, Burgess N. The hippocampus and memory: insights from spatial processing. Nature Reviews. Neuroscience. 2008;9:182–194. doi: 10.1038/nrn2335. - DOI - PubMed

Publication types