. 2022 Jul 5:11:e77898.
doi: 10.7554/eLife.77898.

Genome-wide detection of imprinted differentially methylated regions using nanopore sequencing

Affiliations

Genome-wide detection of imprinted differentially methylated regions using nanopore sequencing

Vahid Akbari et al. Elife. .

Abstract

Imprinting is a critical part of normal embryonic development in mammals, controlled by defined parent-of-origin (PofO) differentially methylated regions (DMRs) known as imprinting control regions. Direct nanopore sequencing of DNA provides a means to detect allelic methylation and to overcome the drawbacks of methylation array and short-read technologies. Here, we used publicly available nanopore sequencing data for 12 standard B-lymphocyte cell lines to acquire the genome-wide mapping of imprinted intervals in humans. Using the sequencing data, we were able to phase 95% of the human methylome and detect 94% of the previously well-characterized, imprinted DMRs. In addition, we found 42 novel imprinted DMRs (16 germline and 26 somatic), which were confirmed using whole-genome bisulfite sequencing (WGBS) data. Analysis of WGBS data in mouse (Mus musculus), rhesus monkey (Macaca mulatta), and chimpanzee (Pan troglodytes) suggested that 17 of these imprinted DMRs are conserved. Some of the novel imprinted intervals are within or close to imprinted genes without a known DMR. We also detected subtle parental methylation bias, spanning several kilobases at seven known imprinted clusters. At these blocks, hypermethylation occurs at the gene body of expressed allele(s) with mutually exclusive H3K36me3 and H3K27me3 allelic histone marks. These results expand upon our current knowledge of imprinting and the potential of nanopore sequencing to identify imprinting regions using only parent-offspring trios, as opposed to the large multi-generational pedigrees that have previously been required.

Keywords: DNA methylation; H3K27me3; H3K36me3; allele-specific methylation; computational biology; genetics; genomics; human; imprinting; nanopore sequencing; systems biology.


Conflict of interest statement

VA, JG, KO, PP, RM, MM, MH, SJ No competing interests declared

Figures

Figure 1.
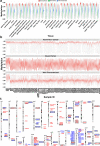
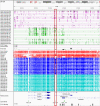
Figure 1.. Detection of allelic methylation using nanopore sequencing.
(a) Flowchart of the study representing all the analysis steps. (b) Pearson correlation matrix of the nanopore CpG methylation frequencies for the 12 cell lines and NA12878 whole-genome bisulfite sequencing (WGBS) from ENCODE (ENCFF835NTC). (c) Upset plot of the number of differentially methylated regions (DMRs) detected in our study and previous studies, including overlaps.
Figure 1—figure supplement 1.
Figure 1—figure supplement 1.. Number of allelic differentially methylated regions (DMRs) overlapped to the reported DMRs and parent-of-origin (PofO)-defined phased CpG methylation in each sample examined for differential methylation analysis by DSS R package.
To calculate coverage, the genome length is considered as 3.2G.
Figure 2.
Figure 2.. Confirmation of nanopore-detected differentially methylated regions (DMRs) using whole-genome bisulfite sequencing (WGBS) data.
(a) and (b) Violin plots representing the average methylation of each DMR in WGBS tissue and blood samples. (c) Idiogram of the 101 DMRs overlapping to reported intervals and 42 novel DMRs which were confirmed by WGBS. Paternally methylated DMRs are labelled on the left side of each chromosome while maternally methylated DMRs are on the right. Red labels represent germline DMRs while blue labels represent somatic DMRs. Novel DMRs are boxed and named based on their nearest gene (Ensembl Gene 103 GRCh38.p13).
Figure 2—figure supplement 1.
Figure 2—figure supplement 1.. Violin plots representing methylation in whole-genome bisulfite sequencing (WGBS) blood (left) and tissue (right) samples at randomly selected CpG islands (CGIs), 1, 2, and 3 kb intervals.
Figure 3.
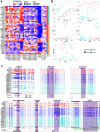
Figure 3.. Detection of novel germline and somatic differentially methylated regions (DMRs).
(a) Heatmap displaying average methylation of the 42 nanopore-detected DMRs confirmed by whole-genome bisulfite sequencing (WGBS). DMRs are named based on their nearest gene (Ensembl Gene 103 GRCh38.p13). (b) Dot plots representing the methylation of novel germline and somatic DMRs in each sample with respect to other samples. (c) IGV screenshots from six novel germline DMRs overlapping with ZNF445 and/or ZFP57 chromatin immunoprecipitation sequencing (ChIP-seq) peaks. The range for all methylation tracks is 0–1.
Figure 4.
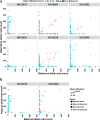
Figure 4.. Allelic H3K4me3 histone mark at detected imprinted differentially methylated regions (DMRs).
(a) The plots representing reference and alternative alleles H3K4me3 read counts for the heterozygous single-nucleotide variants (SNVs) mapped to the detected DMRs for the six examined samples. Each point represents an SNV. Blue color displays SNVs with Fisher’s combined p-value binomial <0.05 and at least 80% of the reads on one allele and red color represent those SNVs that did not satisfy either of these thresholds. (b) The plots representing paternal and maternal H3K4me3 read counts for the heterozygous SNVs at DMRs in NA12878 and NA19240. Each point represents an SNV. The ‘Status’ indicates the methylation origin of the DMR and if the DMR is novel or reported.
Figure 5.
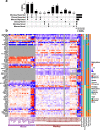
Figure 5.. Conservation of detected differentially methylated regions (DMRs).
(a) Upset plot representing the number of previously reported and novel DMRs with evidence of conservation (partial methylation) in each of the mammals. (b) Heatmap representing human DMRs (DMR names on the left) and average methylation of their orthologous intervals in mouse and macaque in different tissues and also in sperm, oocyte, and embryonic samples. Gray regions represent NA values that either did not have an ortholog or enough CpG in the whole-genome bisulfite sequencing (WGBS) data.
Figure 6.
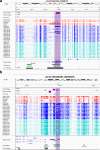
Figure 6.. IGV screenshots of two novel somatic differentially methylated regions (DMRs).
(a) Novel maternally methylated somatic DMR overlapping with the promoter of paternally expressed ZNF714 gene. (b) Novel paternally methylated somatic DMR overlapping with the promoter of maternally expressed PAX8-AS1gene. Highlighted box regions represent the DMRs. Parent-of-origin (PofO) allele-specific expression (ASE) track is created using publicly available ASE data from Zink et al., 2018 (see Materials and methods). Positive vertical bars (upward) represent paternal expression and negative bars (downward) represent maternal expression. The range for all methylation tracks is 0–1.
Figure 6—figure supplement 1.
Figure 6—figure supplement 1.. Novel somatic paternally methylated differentially methylated region (DMR) in paternally expressed ZDBF2 gene.
The range for all methylation tracks is 0–1. In parent-of-origin (PofO) ASE track, positive or upward bars represent paternal expression bias and negative or downward bars represent maternal expression bias.
Figure 6—figure supplement 2.
Figure 6—figure supplement 2.. Novel somatic maternally methylated differentially methylated region (DMR) in maternally expressed RB1 gene and isoform dependent (or in some studies paternally) expressed LPAR6 gene.
The range for all methylation tracks is 0–1. In parent-of-origin (PofO) ASE track, positive or upward bars represent paternal expression bias and negative or downward bars represent maternal expression bias.
Figure 6—figure supplement 3.
Figure 6—figure supplement 3.. Novel somatic maternally methylated differentially methylated region (DMR) in paternally expressed BMP8A gene.
The range for all methylation tracks is 0–1. In parent-of-origin (PofO) ASE track, positive or upward bars represent paternal expression bias and negative or downward bars represent maternal expression bias.
Figure 6—figure supplement 4.
Figure 6—figure supplement 4.. Novel somatic paternally methylated differentially methylated region (DMR) 3 kb away from paternally expressed PWAR1 gene.
The range for all methylation tracks is 0–1. In parent-of-origin (PofO) ASE track, positive or upward bars represent paternal expression bias and negative or downward bars represent maternal expression bias.
Figure 6—figure supplement 5.
Figure 6—figure supplement 5.. Novel somatic paternally methylated differentially methylated region (DMR) 90 kb away from maternally expressed LINC00665 gene.
The range for all methylation tracks is 0–1. In parent-of-origin (PofO) ASE track, positive or upward bars represent paternal expression bias and negative or downward bars represent maternal expression bias.
Figure 6—figure supplement 6.
Figure 6—figure supplement 6.. Novel somatic paternally methylated differentially methylated region (DMR) 296 kb away from randomly/maternally expressed DGCR6 gene.
The range for all methylation tracks is 0–1. In parent-of-origin (PofO) ASE track, positive or upward bars represent paternal expression bias and negative or downward bars represent maternal expression bias.
Figure 6—figure supplement 7.
Figure 6—figure supplement 7.. Novel somatic paternally methylated differentially methylated region (DMR) 1.03 Mb away from maternally expressed IGF2R.
The range for all methylation tracks is 0–1. In parent-of-origin (PofO) ASE track, positive or upward bars represent paternal expression bias and negative or downward bars represent maternal expression bias.
Figure 7.
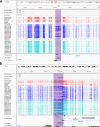
Figure 7.. IGV screenshots of two novel maternal germline differentially methylated regions (DMRs).
(a) Novel maternally methylated germline DMR overlapping with the promoter of the paternally expressed ACTL10 gene. (b) Novel maternally methylated germline DMR overlapping with the promoter of the SYCE1 gene, which demonstrates paternal expression bias from parent-of-origin (PofO) allele-specific expression (ASE) track. Highlighted box regions represent the DMRs. PofO ASE track is created using publicly available ASE data from Zink et al., 2018 (see Materials and methods). Positive vertical bars (upward) represent paternal expression and negative bars (downward) represent maternal expression. The range for all methylation tracks is 0–1.
Figure 7—figure supplement 1.
Figure 7—figure supplement 1.. Novel germline maternally methylated differentially methylated region (DMR) in maternally expressed DDA1 gene.
The range for all methylation tracks is 0–1. In parent-of-origin (PofO) ASE track, positive or upward bars represent paternal expression bias and negative or downward bars represent maternal expression bias.
Figure 7—figure supplement 2.
Figure 7—figure supplement 2.. Novel germline maternally methylated differentially methylated region (DMR) in paternally expressed AC024940.1 (OVOS2) gene.
The range for all methylation tracks is 0–1. In parent-of-origin (PofO) ASE track, positive or upward bars represent paternal expression bias and negative or downward bars represent maternal expression bias.
Figure 7—figure supplement 3.
Figure 7—figure supplement 3.. Novel germline maternally methylated differentially methylated region (DMR) 149 kb away from isoform dependent expressed NAPRT gene.
The range for all methylation tracks is 0–1. In parent-of-origin (PofO) ASE track, positive or upward bars represent paternal expression bias and negative or downward bars represent maternal expression bias.
Figure 7—figure supplement 4.
Figure 7—figure supplement 4.. Novel germline maternally methylated differentially methylated region (DMR) 745 kb away from maternally expressed NTM gene.
The range for all methylation tracks is 0–1. In parent-of-origin (PofO) ASE track, positive or upward bars represent paternal expression bias and negative or downward bars represent maternal expression bias.
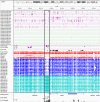
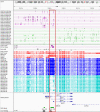
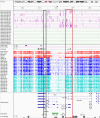
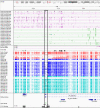
Figure 8.
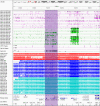
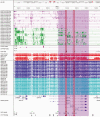
Figure 8.. IGV screenshot of 200 kb paternally methylated biased methylation block in the PWS/AS imprinted cluster.
The range for all methylation tracks is 0–1. The histone mark tracks represent allelic read counts for H3K36me3 and H3K27me3 modifications. The range for all histone mark tracks is 0–20. In H3K27 and H3K36 tracks, for NA12878 and NA19240 the parent-of-origin could be determined and specified by maternal (Mat) and paternal (Pat) alleles. While the other samples are specified by reference (Ref) and alternative (Alt) alleles.
Figure 8—figure supplement 1.
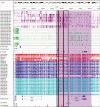
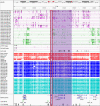
Figure 8—figure supplement 1.. IGV screenshot of ~65 kb paternally methylated biased methylation block in GPR1-AS/ZDBF2 imprinted cluster.
The histone mark tracks are representing allelic read counts for H3K36me3 and H3K27me3 modifications. The range for all histone mark tracks is 0–20. Purple highlight demonstrates the whole block. In H3K27 and H3K36 tracks, for NA12878 and NA19240 the parent-of-origin (PofO) could be determined and specified by maternal (Mat) and paternal (Pat) alleles. While the other samples are specified by reference (Ref) and alternative (Alt) alleles. Black box represents known somatic differentially methylated region (DMR) in the block while red box shows known germline DMR in the block. The range for all methylation tracks is 0–1. In PofO ASE track, positive or upward bars represent paternal expression bias and negative or downward bars represent maternal expression bias.
Figure 8—figure supplement 2.
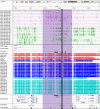
Figure 8—figure supplement 2.. IGV screenshot of ~58 kb paternally methylated biased methylation block in ZNF331/ZNF813 imprinted cluster.
The histone mark tracks are representing allelic read counts for H3K36me3 and H3K27me3 modifications. The range for all histone mark tracks is 0–20. In H3K27 and H3K36 tracks, for NA12878 and NA19240 the parent-of-origin (PofO) could be determined and specified by maternal (Mat) and paternal (Pat) alleles. While the other samples are specified by reference (Ref) and alternative (Alt) alleles. Purple highlight demonstrates the whole block. Red box shows known germline differentially methylated region (DMR) in the block. The range for all methylation tracks is 0–1. In PofO ASE track, positive or upward bars represent paternal expression bias and negative or downward bars represent maternal expression bias.
Figure 8—figure supplement 3.
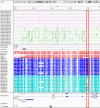
Figure 8—figure supplement 3.. IGV screenshot of ~56 kb paternally methylated biased methylation block in KCNQ1/KCNQ1OT1 imprinted cluster.
The histone mark tracks are representing allelic read counts for H3K36me3 and H3K27me3 modifications. The range for all histone mark tracks is 0–20. In H3K27 and H3K36 tracks, for NA12878 and NA19240 the parent-of-origin (PofO) could be determined and specified by maternal (Mat) and paternal (Pat) alleles. While the other samples are specified by reference (Ref) and alternative (Alt) alleles. Purple highlight demonstrates the whole block. Red box shows known germline differentially methylated region (DMR) in the block. The range for all methylation tracks is 0–1. In PofO ASE track, positive or upward bars represent paternal expression bias and negative or downward bars represent maternal expression bias.
Figure 8—figure supplement 4.
Figure 8—figure supplement 4.. IGV screenshot of ~44 kb paternally methylated biased methylation block in GNAS/GNAS-AS1 imprinted cluster.
The histone mark tracks are representing allelic read counts for H3K36me3 and H3K27me3 modifications. The range for all histone mark tracks is 0–20. In H3K27 and H3K36 tracks, for NA12878 and NA19240 the parent-of-origin (PofO) could be determined and specified by maternal (Mat) and paternal (Pat) alleles. While the other samples are specified by reference (Ref) and alternative (Alt) alleles. Purple highlight demonstrates the whole block. Black box represents known somatic differentially methylated region (DMR) in the block while red box shows known germline DMR in the block. The range for all methylation tracks is 0–1. In PofO ASE track, positive or upward bars represent paternal expression bias and negative or downward bars represent maternal expression bias.
Figure 8—figure supplement 5.
Figure 8—figure supplement 5.. IGV screenshot of ~42 kb paternally methylated biased methylation block in L3MBTL1/SGK2 imprinted cluster.
The histone mark tracks are representing allelic read counts for H3K36me3 and H3K27me3 modifications. The range for all histone mark tracks is 0–20. In H3K27 and H3K36 tracks, for NA12878 and NA19240 the parent-of-origin (PofO) could be determined and specified by maternal (Mat) and paternal (Pat) alleles. While the other samples are specified by reference (Ref) and alternative (Alt) alleles. Purple highlight demonstrates the whole block. Red box shows known germline differentially methylated region (DMR) in the block. The range for all methylation tracks is 0–1. In PofO ASE track, positive or upward bars represent paternal expression bias and negative or downward bars represent maternal expression bias.
Figure 8—figure supplement 6.
Figure 8—figure supplement 6.. IGV screenshot of ~35 kb maternally methylated biased methylation block in ZNF597/NAA60 imprinted cluster.
The histone mark tracks are representing allelic read counts for H3K36me3 and H3K27me3 modifications. The range for all histone mark tracks is 0–20. In H3K27 and H3K36 tracks, for NA12878 and NA19240 the parent-of-origin (PofO) could be determined and specified by maternal (Mat) and paternal (Pat) alleles. While the other samples are specified by reference (Ref) and alternative (Alt) alleles. Purple highlight demonstrates the whole block. Black box represents known somatic differentially methylated region (DMR) in the block. The range for all methylation tracks is 0–1. In PofO ASE track, positive or upward bars represent paternal expression bias and negative or downward bars represent maternal expression bias.
Figure 9.
Figure 9.. Mutual exclusive allelic H3K36me3 and H3K27me3 histone marks at seven parent-of-origin (PofO) methylation-biased blocks.
All blocks demonstrate allelic H3K36me3 on hypermethylated allele and H3K27me3 on hypomethylated allele. For NA12878 and NA19240, allele1 is the paternal and allele2 is maternal. For sake of visualization in other four cell lines without parental information, allele1 for H3K36me3 mark demonstrates the allele with more mapped reads at all blocks except ZNF597/NAA60. Therefore, for H3K36me3 we swapped the reference allele read count with the alternative allele read count if the reference allele count was less than the alternative allele count. At ZNF597/NAA60, we swapped the reference allele read count with the alternative allele read count if the reference had higher read count. We also swapped the reference and the alternative allele counts for the same SNVs for H3K27me3. Each point represents a heterozygous SNV. Lines are connecting SNVs that have mapped reads for both histone modifications.
Figure 9—figure supplement 1.
Figure 9—figure supplement 1.. Allelic H3K36me3 and H3K27me3 histone marks read count at seven test blocks.
Test blocks do not display allelic bias for H3K36me3 or H3K27me3 histone modifications. For NA12878 and NA19240, allele1 is the paternal and allele2 is maternal. For sake of visualization in other four cell lines without parental information, allele1 for H3K36me3 mark demonstrates the allele with more mapped reads. Therefore, for H3K36me3 we swapped reference allele read count with alternative allele read count if reference allele count was less than alternative allele count. We also swapped reference and alternative allele counts for the same SNVs for H3K27me3. Each point represents a heterozygous SNV. Lines are connecting SNVs that have mapped reads for both histone modifications.
Figure 9—figure supplement 2.
Figure 9—figure supplement 2.. IGV screenshot of the PPIEL imprinted cluster.
The histone mark tracks are representing allelic read counts for H3K36me3 and H3K27me3 modifications. The range for all histone mark tracks is 0–20. In H3K27 and H3K36 tracks, for NA12878 and NA19240 the parent-of-origin (PofO) could be determined and specified by maternal (Mat) and paternal (Pat) alleles. While the other samples are specified by reference (Ref) and alternative (Alt) alleles. Red box shows known germline DMR. The range for all methylation tracks is 0–1. In PofO ASE track, positive or upward bars represent paternal expression bias and negative or downward bars represent maternal expression bias.
Figure 9—figure supplement 3.
Figure 9—figure supplement 3.. IGV screenshot of the MEG3 imprinted cluster.
The histone mark tracks are representing allelic read counts for H3K36me3 and H3K27me3 modifications. The range for all histone mark tracks is 0–20. In H3K27 and H3K36 tracks, for NA12878 and NA19240 the parent-of-origin (PofO) could be determined and specified by maternal (Mat) and paternal (Pat) alleles. While the other samples are specified by reference (Ref) and alternative (Alt) alleles. Black box shows known somatic differentially methylated region (DMR). The range for all methylation tracks is 0–1. In PofO ASE track, positive or upward bars represent paternal expression bias and negative or downward bars represent maternal expression bias.
Figure 9—figure supplement 4.
Figure 9—figure supplement 4.. IGV screenshot of the MEST imprinted cluster.
The histone mark tracks are representing allelic read counts for H3K36me3 and H3K27me3 modifications. The range for all histone mark tracks is 0–20. In H3K27 and H3K36 tracks, for NA12878 and NA19240 the parent-of-origin (PofO) could be determined and specified by maternal (Mat) and paternal (Pat) alleles. While the other samples are specified by reference (Ref) and alternative (Alt) alleles. Red box shows known germline differentially methylated region (DMR). The range for all methylation tracks is 0–1. In PofO ASE track, positive or upward bars represent paternal expression bias and negative or downward bars represent maternal expression bias.
Figure 9—figure supplement 5.
Figure 9—figure supplement 5.. IGV screenshot of the DIRAS3 imprinted cluster.
The histone mark tracks are representing allelic read counts for H3K36me3 and H3K27me3 modifications. The range for all histone mark tracks is 0–20. In H3K27 and H3K36 tracks, for NA12878 and NA19240 the parent-of-origin (PofO) could be determined and specified by maternal (Mat) and paternal (Pat) alleles. While the other samples are specified by reference (Ref) and alternative (Alt) alleles. Red box shows known germline differentially methylated region (DMR). The range for all methylation tracks is 0–1. In PofO ASE track, positive or upward bars represent paternal expression bias and negative or downward bars represent maternal expression bias.
Figure 9—figure supplement 6.
Figure 9—figure supplement 6.. IGV screenshot of the IGF2 imprinted cluster.
The histone mark tracks are representing allelic read counts for H3K36me3 and H3K27me3 modifications. The range for all histone mark tracks is 0–20. In H3K27 and H3K36 tracks, for NA12878 and NA19240 the parent-of-origin (PofO) could be determined and specified by maternal (Mat) and paternal (Pat) alleles. While the other samples are specified by reference (Ref) and alternative (Alt) alleles. Black box represents known somatic differentially methylated region (DMR) and red box shows known germline DMR. The range for all methylation tracks is 0–1. In PofO ASE track, positive or upward bars represent paternal expression bias and negative or downward bars represent maternal expression bias.
Figure 9—figure supplement 7.
Figure 9—figure supplement 7.. IGV screenshot of the MTRNR2L4 imprinted cluster.
The histone mark tracks are representing allelic read counts for H3K36me3 and H3K27me3 modifications. The range for all histone mark tracks is 0–20. In H3K27 and H3K36 tracks, for NA12878 and NA19240 the parent-of-origin (PofO) could be determined and specified by maternal (Mat) and paternal (Pat) alleles. While the other samples are specified by reference (Ref) and alternative (Alt) alleles. Black box represents known somatic differentially methylated region (DMR). The range for all methylation tracks is 0–1. In PofO ASE track, positive or upward bars represent paternal expression bias and negative or downward bars represent maternal expression bias.
Figure 9—figure supplement 8.
Figure 9—figure supplement 8.. IGV screenshot of the ADNP2 imprinted cluster.
The histone mark tracks are representing allelic read counts for H3K36me3 and H3K27me3 modifications. The range for all histone mark tracks is 0–20. In H3K27 and H3K36 tracks, for NA12878 and NA19240 the parent-of-origin (PofO) could be determined and specified by maternal (Mat) and paternal (Pat) alleles. While the other samples are specified by reference (Ref) and alternative (Alt) alleles. Red box shows known germline differentially methylated region (DMR). The range for all methylation tracks is 0–1. In PofO ASE track, positive or upward bars represent paternal expression bias and negative or downward bars represent maternal expression bias.
Appendix 1—figure 1.
Appendix 1—figure 1.. Pearson correlation for the number of ZFP57-binding motif (TGCCGC) at differentially methylated regions (DMRs) and percent of individuals that demonstrated partial methylation in their whole-genome bisulfite sequencing data at the DMRs.
Appendix 2—figure 1.
Appendix 2—figure 1.. Conserved differentially methylated region (DMR) at HTR5A in human and mouse.
The known DMR at HTR5A reported to be not conserved in mouse by Court et al. (PMID: 24402520; see supplementary figure S6 from Court et al., 2014), however we detected it as conserved due to a different orthologous examined in our study. Court et al. examined CGI 102 which is also not imprinted in our analysis, however the ortholog we examined spans beginning of the HTR5A and is partially methylated which suggests the region is imprinted. Red boxes are showing germline DMRs. The range for all methylation tracks is 0–1. In parent-of-origin (PofO) ASE track, positive or upward bars represent paternal expression bias and negative or downward bars represent maternal expression bias.
Appendix 3—figure 1.
Appendix 3—figure 1.. Germline maternally methylated differentially methylated region (DMR) in the promoter of paternally expressed PTCHD3 gene.
The range for all methylation tracks is 0–1. In parent-of-origin (PofO) ASE track, positive or upward bars represent paternal expression bias and negative or downward bars represent maternal expression bias.
Appendix 3—figure 2.
Appendix 3—figure 2.. Germline maternally methylated differentially methylated region (DMR) in the intron 1 of maternally expressed FANCC gene.
The range for all methylation tracks is 0–1. In parent-of-origin (PofO) ASE track, positive or upward bars represent paternal expression bias and negative or downward bars represent maternal expression bias.

References

    1. Akbari V, Garant J-M, O’Neill K, Pandoh P, Moore R, Marra MA, Hirst M, Jones SJM. Megabase-scale methylation phasing using nanopore long reads and NanoMethPhase. Genome Biology. 2021;22:68. doi: 10.1186/s13059-021-02283-5. - DOI - PMC - PubMed
    1. Akbari V. NanoMethPhase. swh:1:rev:1657f7aed60604aa7c7f3e77d992d76bee6bf6d3Software Heritage. 2022 https://archive.softwareheritage.org/swh:1:dir:544b123669c23565347328349...
    1. Amemiya HM, Kundaje A, Boyle AP. The ENCODE Blacklist: Identification of Problematic Regions of the Genome. Scientific Reports. 2019;9:9354. doi: 10.1038/s41598-019-45839-z. - DOI - PMC - PubMed
    1. Auton A, Brooks LD, Durbin RM, Garrison EP, Kang HM, Korbel JO, Marchini JL, McCarthy S, McVean GA, Abecasis GR, 1000 Genomes Project Consortium A global reference for human genetic variation. Nature. 2015;526:68–74. doi: 10.1038/nature15393. - DOI - PMC - PubMed
    1. Babak T, DeVeale B, Tsang EK, Zhou Y, Li X, Smith KS, Kukurba KR, Zhang R, Li JB, van der Kooy D, Montgomery SB, Fraser HB. Genetic conflict reflected in tissue-specific maps of genomic imprinting in human and mouse. Nature Genetics. 2015;47:544–549. doi: 10.1038/ng.3274. - DOI - PMC - PubMed

Publication types