. 2023 Nov 28;14(1):7464.
doi: 10.1038/s41467-023-43264-5.

Systematic characterization of the HOXA9 downstream targets in MLL-r leukemia by noncoding CRISPR screens

Affiliations

Systematic characterization of the HOXA9 downstream targets in MLL-r leukemia by noncoding CRISPR screens

Shaela Wright et al. Nat Commun. .

Abstract

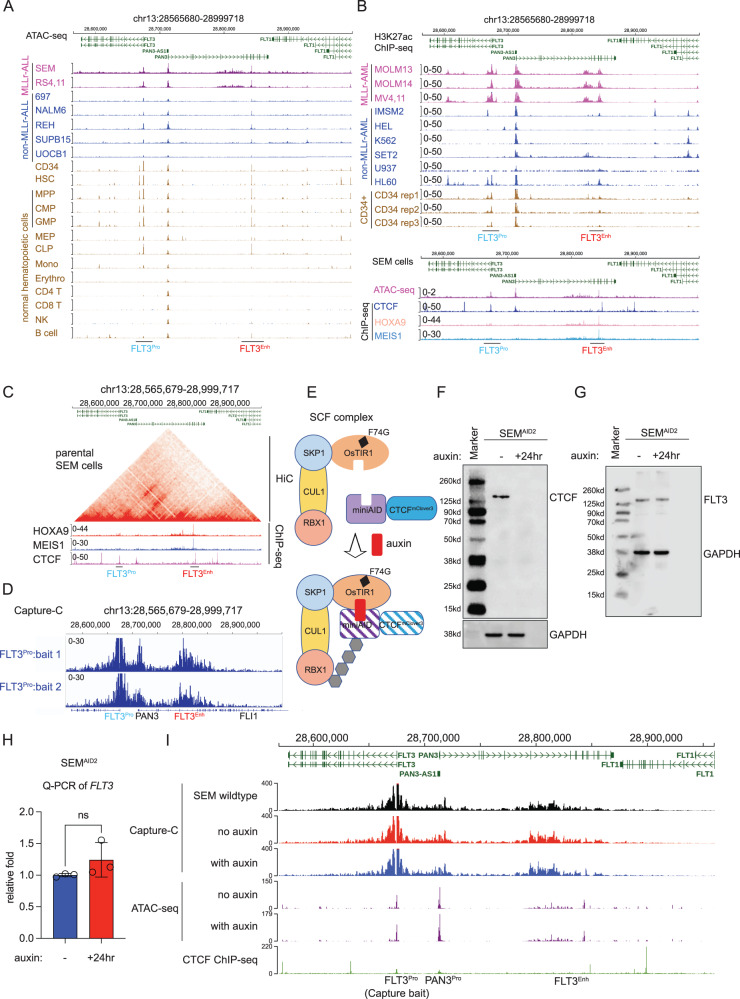
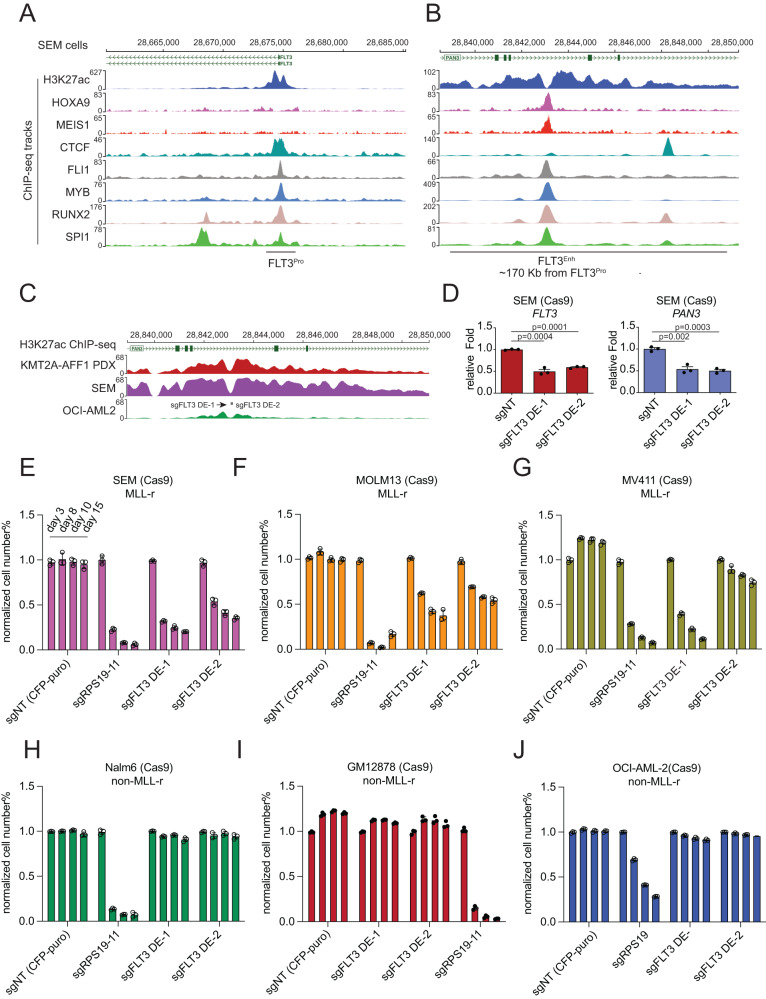
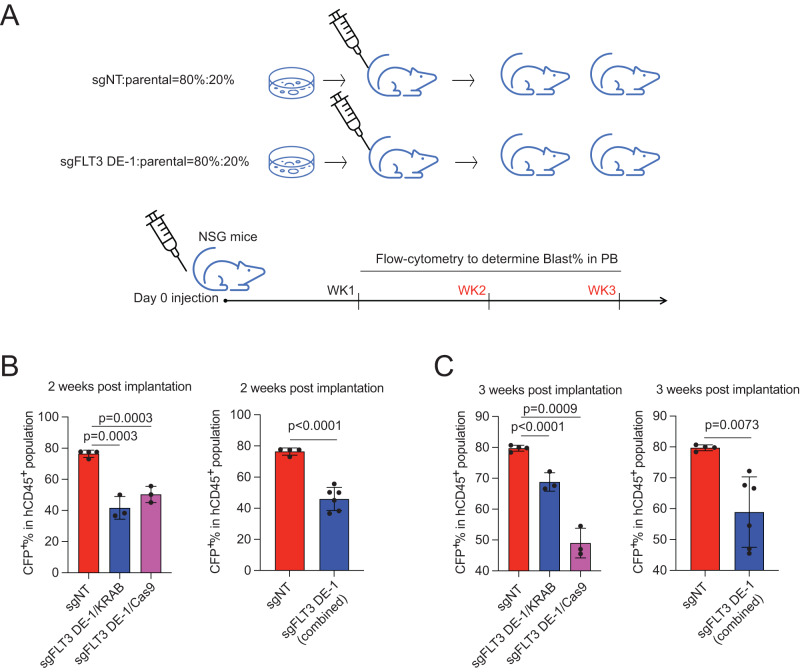
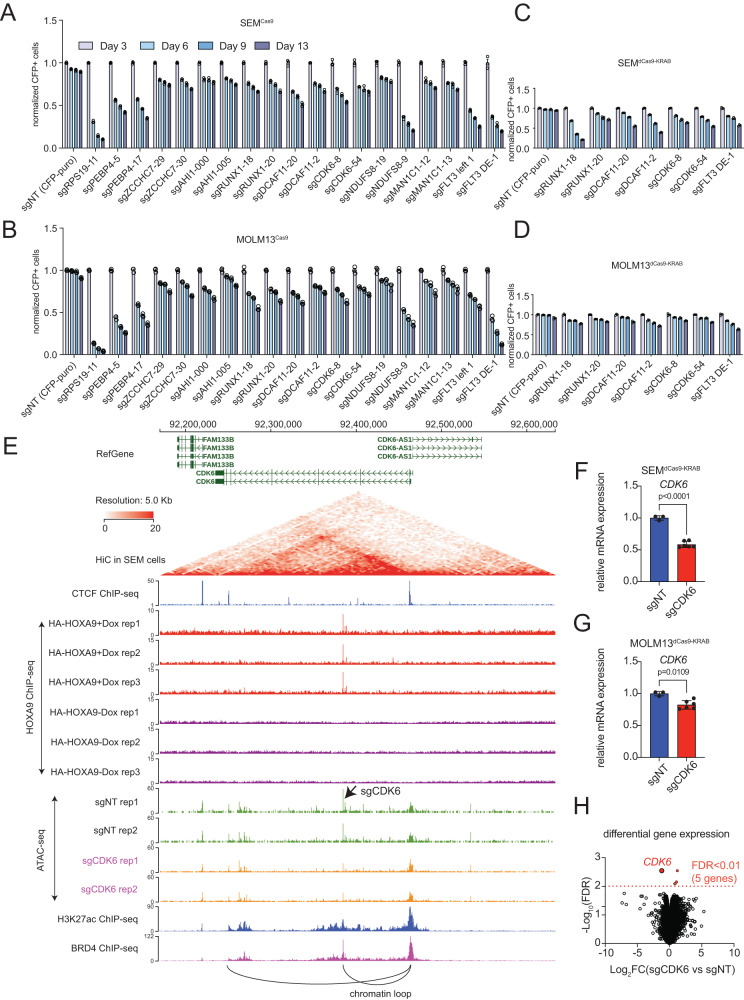
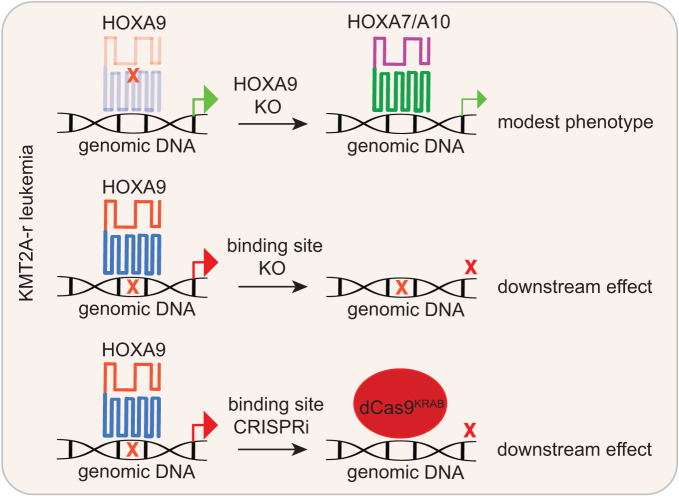
Accumulating evidence indicates that HOXA9 dysregulation is necessary and sufficient for leukemic transformation and maintenance. However, it remains largely unknown how HOXA9, as a homeobox transcriptional factor, binds to noncoding regulatory sequences and controls the downstream genes. Here, we conduct dropout CRISPR screens against 229 HOXA9-bound peaks identified by ChIP-seq. Integrative data analysis identifies reproducible noncoding hits, including those located in the distal enhancer of FLT3 and intron of CDK6. The Cas9-editing and dCas9-KRAB silencing of the HOXA9-bound sites significantly reduce corresponding gene transcription and impair cell proliferation in vitro, and in vivo by transplantation into NSG female mice. In addition, RNA-seq, Q-PCR analysis, chromatin accessibility change, and chromatin conformation evaluation uncover the noncoding regulation mechanism of HOXA9 and its functional downstream genes. In summary, our work improves our understanding of how HOXA9-associated transcription programs reconstruct the regulatory network specifying MLL-r dependency.


Conflict of interest statement

The authors declare no competing interests.

Figures

Fig. 1
Fig. 1. A CRISPR editing screen discovered HOXA9 binding sites essential for the growth of MLL-r leukemia cells.
A Diagram of the all-in-one inducible Tet-On system to ectopically express HOXA9-HA cDNA. B Genomic distribution of the 229 HOXA9 ChIP-seq peaks. C The top three consensus motifs and P value were shown using the HOMER motif analysis algorithm against 229 peaks compared with control peaks. D Heat maps of HOXA9-HA ChIP-seq peaks compared with publicly available HOXA9 and MEIS1 ChIP-seq datasets and additional transcription factor ChIP-seq datasets in SEM cells (GEO: GSE117864). E The 229 reproducible HOXA9-bound peaks were identified from our ChIP-seq data and targeted by a library of 5718 sgRNAs, including 100 non-target (NT) sgRNAs used as negative controls and 120 positive control sgRNAs, respectively. Through genome editing mediated by Cas9, drop-out CRISPR library screens were performed to select HOXA9-bound sites critical for the survival of SEM cells on day 7 and day 14. FI Volcano plot of enriched sgRNAs from the drop-out screen using SEM Cas9 and dCas9-KRAB cells infected with the sgRNA library and collected at day 7 and day 14. The positive control sgRNAs targeting the coding region of the RPS19 gene were enriched at all Cas9-mediated screens. The sgRNAs targeting an FLT3 enhancer (left site peak and right site peak) were enriched in all screens. FDR was calculated based on the MAGeCK algorithm descrbed in the Methods.
Fig. 2
Fig. 2. Characterizing the epigenetic regulation of FLT3.
A Functional annotation of the FLT3 locus, using ATAC-seq data from seven B-ALL leukemia cell lines either with the MLL gene rearrangement (MLL-r cells) (SEM and RS4;11) or without MLL rearrangement (non-MLL-r cells) (697, Nalm6, REH, SUP-B15, and UOC-B1)(GEO: GSE129066) and from 13 different normal human hematopoietic lineages (GEO: GSE74912). A potential FLT3 enhancer (FLT3Enh) at ~170 kb upstream of FLT3 was observed in all leukemia cell lines, normal human stem cells, progenitor cells, and B cells. The signal of the FLT3 enhancer was significantly more robust in cells with the MLL gene rearrangement than in cells without the MLL rearrangement. B A strong H3K27ac ChIP-seq signal was observed at the FLT3 enhancer in AML cells with the MLL rearrangement but not in AML cells without MLL rearrangement (upper panel)(GSE17312, GSE65138, GSE80779, GSE79899, GSE109492, GSE137652, GSE111179, GSE111293). Strong CTCF, HOXA9, and MEIS1 ChIP-seq signals were also observed at the h-FLT3 enhancer locus in SEM cells (lower panel). C HiC data from parental SEM cells demonstrated long-range chromatin interaction between the FLT3 promoter and the h-FLT3 enhancer (upper panel)(GEO: GSE138862). ChIP-seq data (HOXA9, MEIS1, and CTCF) served as a reference to locate the HOXA9-bound site (lower panel). D Capture-C was conducted to characterize the chromatin looping between the FLT3 promoter and the h-FLT3 enhancer using biotin-labeled DNA oligos against the FLT3 promoter. E Schematic diagram of auxin-inducible degron system to target and acutely deplete CTCF protein. F Immunoblotting was conducted to confirm the acute protein degradation of CTCF in the presence of auxin for 24 hours. The results were confirmed by consistent two replicates and one representative result was shown here. G Immunoblotting was performed to detect the expression of FLT3 protein upon acute degradation of CTCF. GAPDH was included as an internal control. H Q-PCR was used to examine the mRNA expression of FLT3 upon CTCF protein degradation. Data are shown as mean values ± SEM of three biological replicates (center of the error bar). P values were estimated using a two-tail un-paired t-test. I Capture-C and ATAC-seq were conducted to characterize the chromatin accessibility change and chromatin conformation change following CTCF degradation, respectively. The biotin-labeled DNA oligos against the FLT3 promoter were used as baits to quantify chromatin looping between the FLT3 promoter and the h-FLT3 enhancer. Source data are provided as a Source Data File.
Fig. 3
Fig. 3. Cas9-mediated disruption of the h-FLT3 enhancer blunted MLL-r leukemia cell growth.
ChIP-seq tracks of transcription factors and H3K27ac (GEO: GSE117864) were used to demonstrate the epigenetic status of the FLT3 promoter (A) and the HOXA9-bound site in the h-FLT3 enhancer (B). C Two sgRNAs (sgFLT3-DE-1 and -DE-2) targeting the h-FLT3 enhancer were used to disrupt the h-FLT3 enhancer activity. D Q-PCR detection of gene expression demonstrated notable downregulation of FLT3 and PAN3 expressions in SEM cells upon CRISPR targeting. Cas9/sgFLT3-DE-1/2-mediated disruption of the h-FLT3 enhancer resulted in retarded cell growth of MLL-r leukemia cells (EG) but not non-MLL-r leukemia cells or OCI-AML-2 cells with low enhancer activity of the h-FLT3 (HJ). The sgRPS19-11 sgRNA served as the positive control. The percentage of cell numbers was normalized to CFP+ control cells (sgNT). Data are shown as mean values ± SEM of three biological replicates (center of the error bar). P values were estimated using a two-tail un-paired t-test. Source data are provided as a Source Data File.
Fig. 4
Fig. 4. dCas9-KRAB-mediated disruption of the h-FLT3 enhancer blunted growth of MLL-r leukemia cells and decreased sensitivity to an FLT3 inhibitor.
A A dCas9-KRAB-mediated CRISPR interfering system was applied to disrupt the h-FLT3 enhancer. B, C ATAC-seq results showed that Cas9-KRAB/sgFLT3-DE-1 only influenced the chromatin accessibility of the h-FLT3 enhancer locus in a genome-wide analysis. The non-relevant RBM45 locus was one of the negative loci. DF dCas9-KRAB/sgFLT3-DE-1-mediated disruption of the h-FLT3 enhancer led to down-regulation of FLT3 and PAN3 expressions and retarded cell growth of SEM cells. Expressions of FLT3 and PAN3 were normalized to SEM (dCas9-KRAB) cells infected with non-target sgRNA (sgNT). The percentage of cell numbers was normalized to CFP+ control cells. Data are shown as mean values ± SEM of three biological replicates (center of the error bar), and results represent three independent experiments. P values were estimated using a two-tail un-paired t-test. G Capture-C results showed a strong interaction between the h-FLT3 enhancer and the FLT3 promoter, and this interaction was not influenced by dCas9-KRAB/sgFLT3-DE-1-mediated disruption of the h-FLT3 enhancer. Two baits (Bait 1 and Bait 2) were designed against the FLT3 promoter. FLT3 was shown as an essential gene in SEM (MLL-r) cells, indicated by gene effect (<-0.5 is recognized as essential)(DEPMAP) (H). Its high expression conferred SEM superior sensitivity to the FLT3 inhibitor Gilteritinib (I), whereas dCas9-KRAB/sgFLT3-DE-1-mediated disruption of the h-FLT3 enhancer led to the down-regulated expression of FLT3 and decreased sensitivity to Gilteritinib (J). Data are shown as mean % viability relative to vehicle ± SEM of three biological replicates (center of the error bar), and results represent three independent experiments. Source data are provided as a Source Data File.
Fig. 5
Fig. 5. CRISPR-based disruption of the h-FLT3 enhancer blunted in vivo MLL-r leukemia cell growth.
A A diagram of in vivo competitive transplantation in female NSG mice to evaluate the effect of CRISPR-based disruption of the h-FLT3 enhancer on cell growth of SEM cells. The percentage of SEM cells in the peripheral blood was monitored weekly by flow cytometry. CRISPR-based (dCas9-KRAB and Cas9) disruption of h-FLT3 enhancer compromised in vivo growth of SEM cells at 2 weeks (B) and 3 weeks (C) after transplantation. Four animals in sgNT group and three animals in targeted experiment groups were used. Data are shown as mean values ± SEM of three biological replicates (center of the error bar). P values were estimated using a two-tail un-paired t-test. Source data are provided as a Source Data File.
Fig. 6
Fig. 6. Functional interrogation of HOXA9-bound targets by genome editing.
A Competitive proliferation assay was conducted in Cas9-expressing SEM cells targeted with sgRNAs against HOXA9-bound sites close to the genes as PEBP4, ZCCNC7, AHI1, RUNX1, DCAF11, CDK6, NDUFS8, and MAN1C1. The sgRPS19 and sgFLT3-DE-1 sgRNA served as positive controls. Disruption of the loci targeted by these selected sgRNAs led to retarded cell growth of SEM cells in a time-dependent manner. The percentage of cell numbers was normalized to CFP+ control cells infected with non-target sgRNA (sgNT). B Competitive proliferation assay was conducted in Cas9-expressing MOLM13 cells targeted with sgRNAs against HOXA9-bound sites close to the genes as PEBP4, ZCCHC7, AHI1, RUNX1, DCAF11, CDK6, NDUFS8 and MAN1C1. The sgRPS19 and sgFLT3-DE-1 sgRNA served as positive controls. Disruption of the loci targeted by these sgRNAs led to retarded cell growth of MOLM13 cells in a time-dependent manner. The percentage of cell numbers was normalized to CFP+ control cells infected with non-target sgRNA (sgNT). C Competitive proliferation assay was conducted in dCas9-KRAB-expressing SEM cells targeted with sgRNAs against HOXA9-bound sites close to the genes RUNX1, DCAF11, and CDK6. The sgFLT3-DE-1 sgRNA served as positive control. D Competitive proliferation assay was conducted in dCas9-KRAB-expressing MOLM13 cells targeted with sgRNAs against HOXA9-bound sites close to the genes RUNX1, DCAF11, and CDK6. The sgFLT3-DE-1 sgRNA served as positive control. E Characterization of the chromatin conformation change upon dCas9-KRAB targeting against the HOXA9-bound site in the intron of CDK6. HiC (GEO: GSE138862), HOXA9 ChIP-seq, H3K27ac ChIP-seq and BRD4 ChIP-seq (GEO: GSE117864) tracks were shown to characterize the epigenetic status of the HOXA9-bound site. F Q-PCR was conducted to quantify the transcription decrease of CDK6 when CRISPRi targeted the HOXA9-bound site in the intron of CDK6 in SEM cells. G Q-PCR was conducted to quantify the transcription decrease of CDK6 when CRISPRi targeted the HOXA9-bound site in the intron of CDK6 in MOLM13 cells. H Total RNA-seq was performed using SEM cells targeted with sgCDK6 against the HOXA9-bound site in the CDK6 intron. Differential gene expression was defined by FDR < 0.01. The CDK6 expression is the top hit. Data are shown as mean values ± SEM of three biological replicates. P values were estimated using a two-tail un-paired t-test. Source data are provided as a Source Data File.
Fig. 7
Fig. 7. Schematic diagram summarizing this study.
Our work interrogated the transcription factor function of HOXA9 in MLL-r leukemias by targeting HOXA9-bound sites by genomic editing (CRISPR/Cas9 and CRISPRi). It would overcome the common issue observed by HOXA9 protein perturbation and HOX compensation.

References

    1. Pearson JC, Lemons D, McGinnis W. Modulating Hox gene functions during animal body patterning. Nat. Rev. Genet. 2005;6:893–904. doi: 10.1038/nrg1726. - DOI - PubMed
    1. Innis JW. Role of HOX genes in human development. Curr. Opin. Pediatr. 1997;9:617–622. doi: 10.1097/00008480-199712000-00011. - DOI - PubMed
    1. Krumlauf R. Hox genes in vertebrate development. Cell. 1994;78:191–201. doi: 10.1016/0092-8674(94)90290-9. - DOI - PubMed
    1. Lawrence HJ, Sauvageau G, Humphries RK, Largman C. The role of HOX homeobox genes in normal and leukemic hematopoiesis. Stem Cells. 1996;14:281–291. doi: 10.1002/stem.140281. - DOI - PubMed
    1. van Oostveen J, Bijl J, Raaphorst F, Walboomers J, Meijer C. The role of homeobox genes in normal hematopoiesis and hematological malignancies. Leukemia. 1999;13:1675–1690. doi: 10.1038/sj.leu.2401562. - DOI - PubMed

Publication types