. 2019 Nov 20:8:e48718.
doi: 10.7554/eLife.48718.

Receptor-specific interactome as a hub for rapid cue-induced selective translation in axons

Affiliations

Receptor-specific interactome as a hub for rapid cue-induced selective translation in axons

Max Koppers et al. Elife. .

Abstract

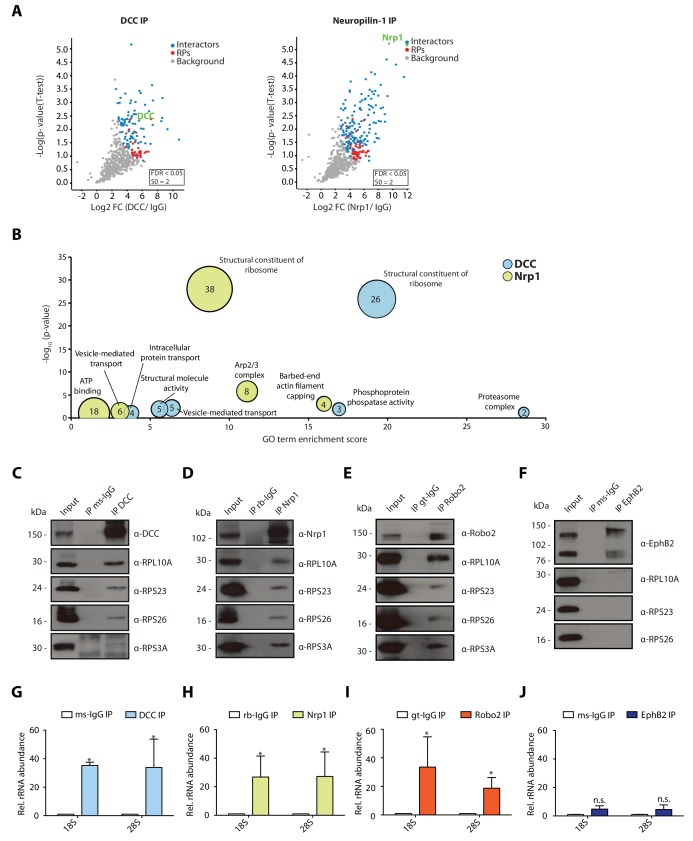
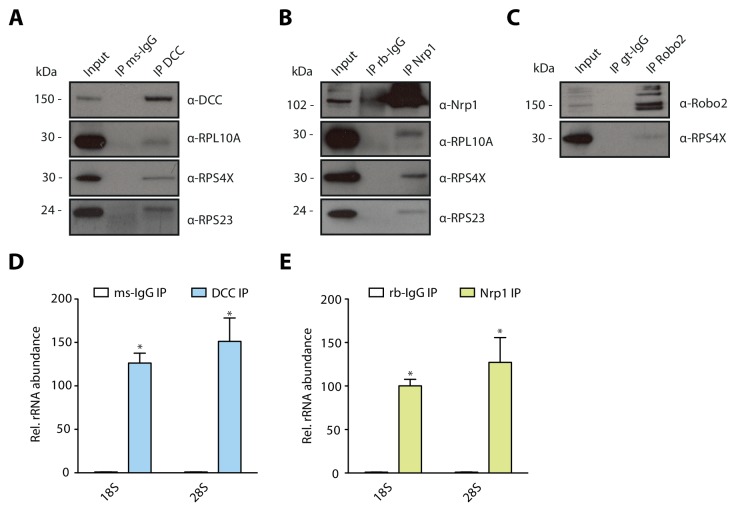
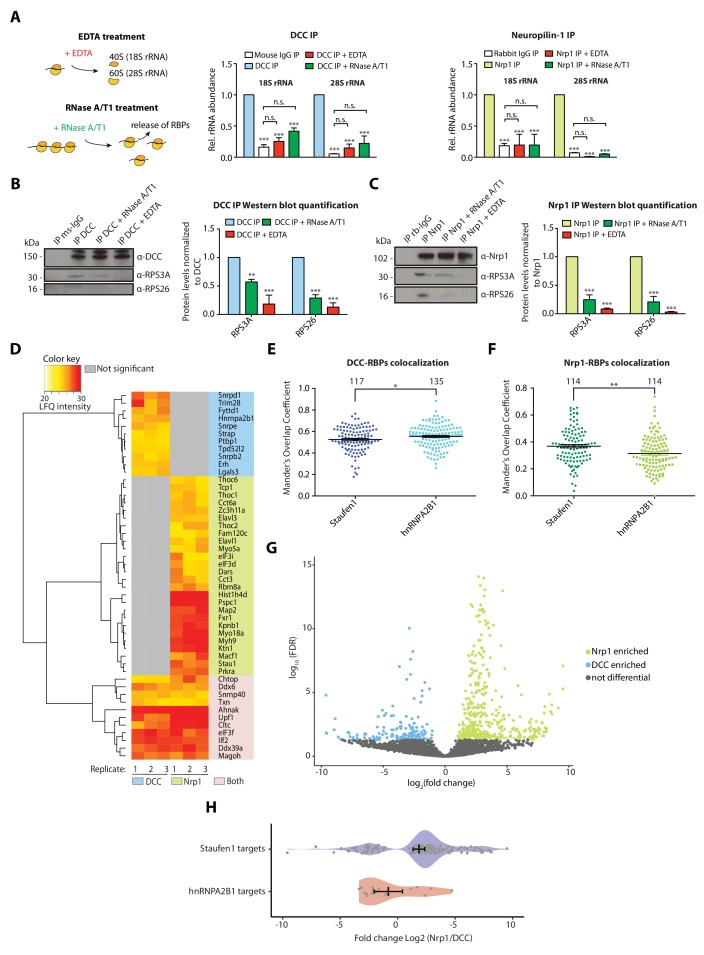
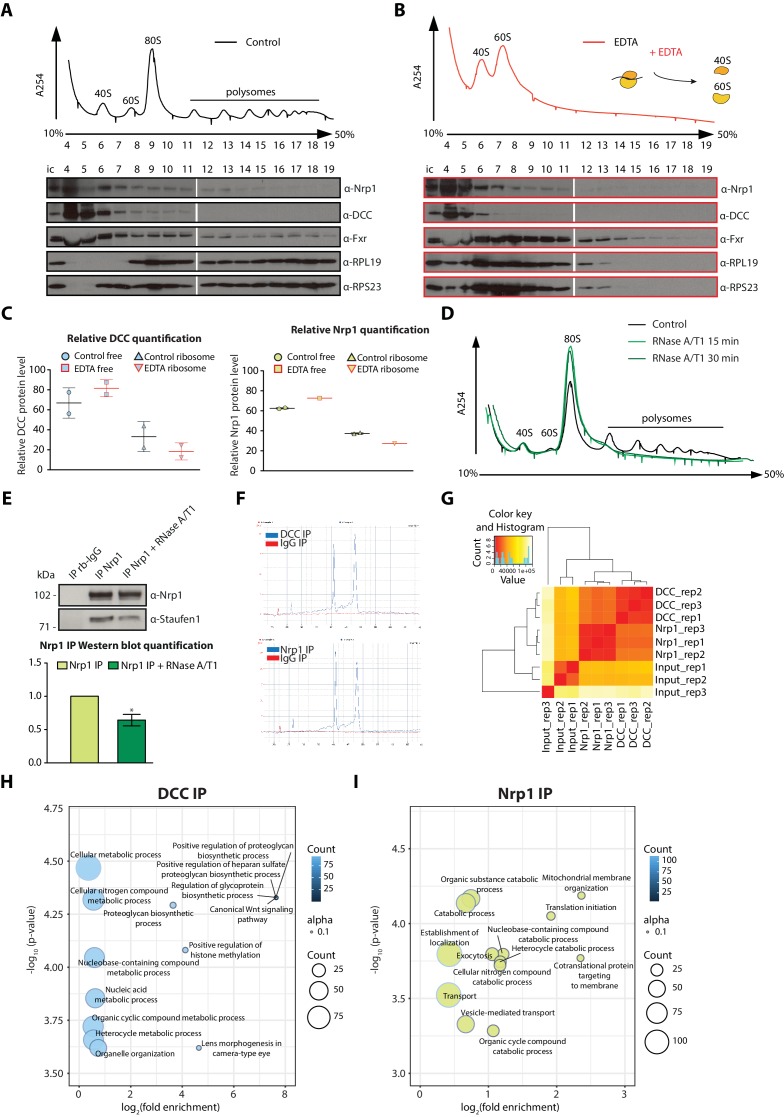
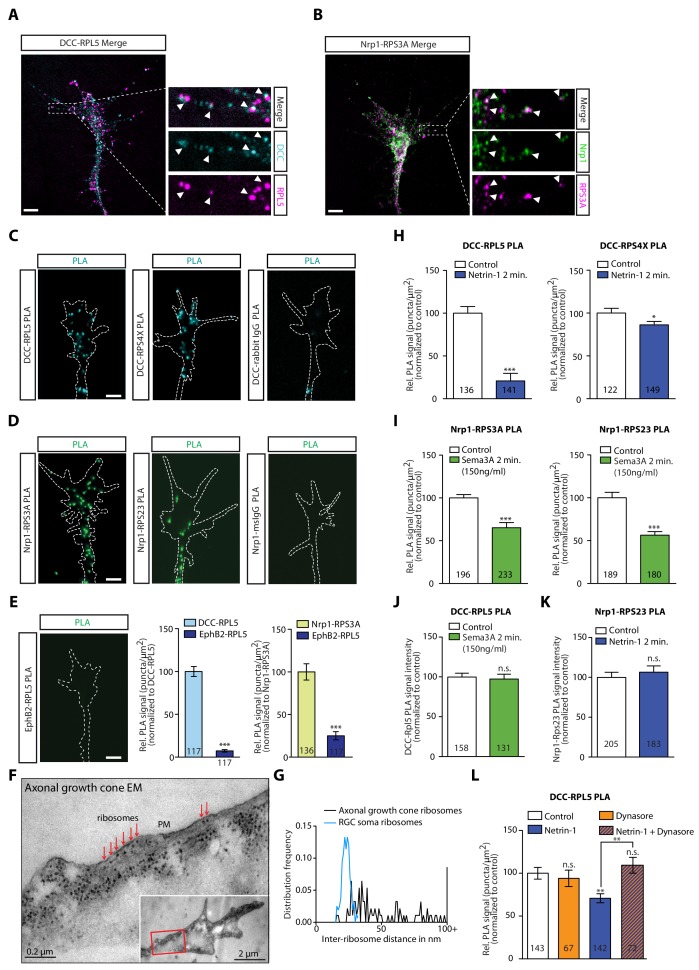
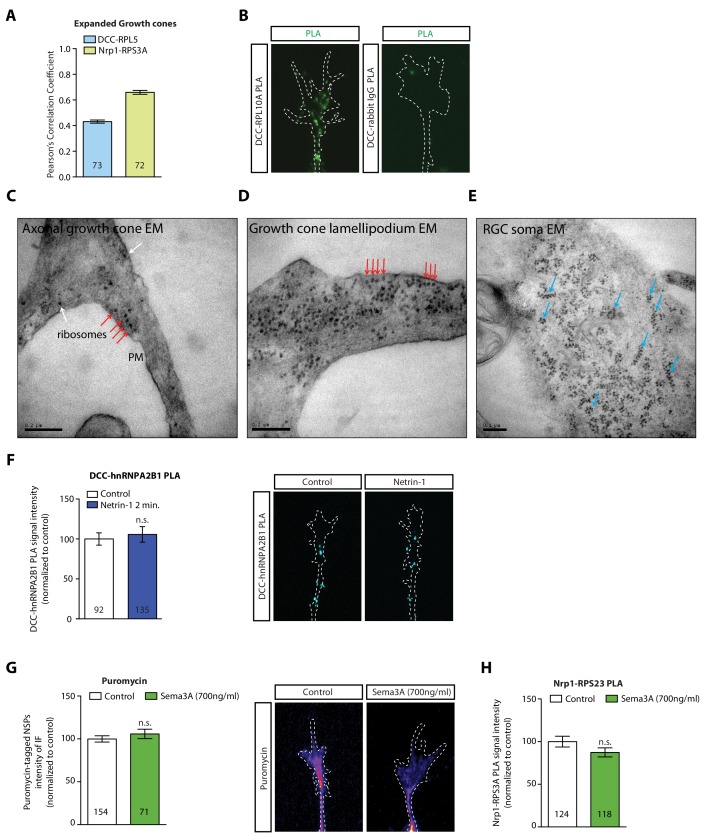
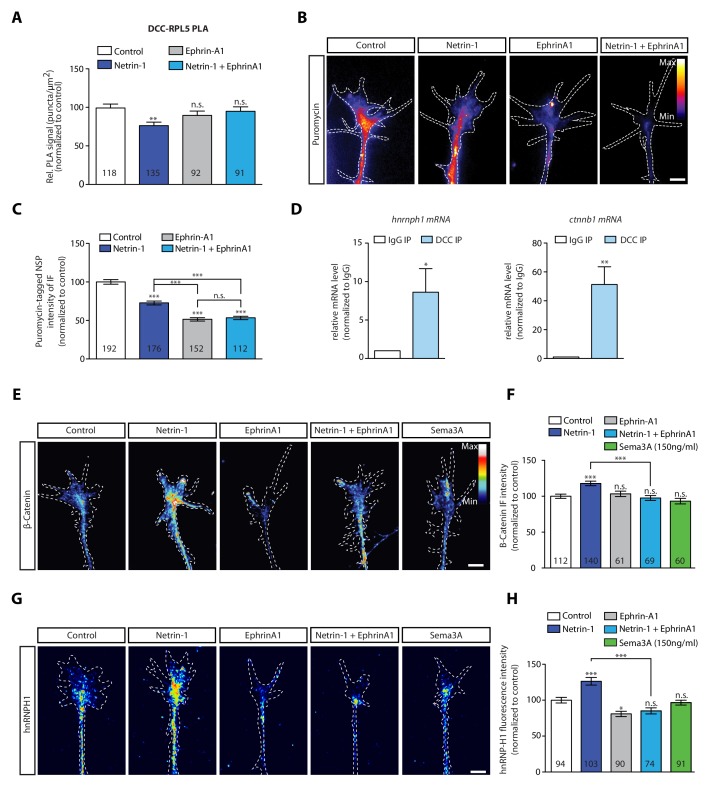
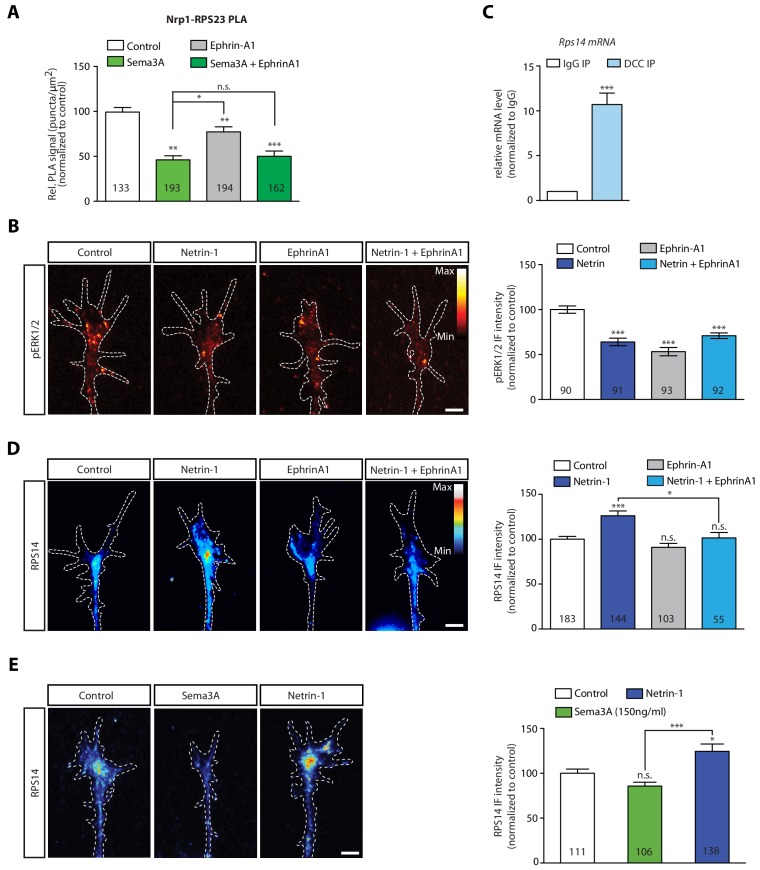
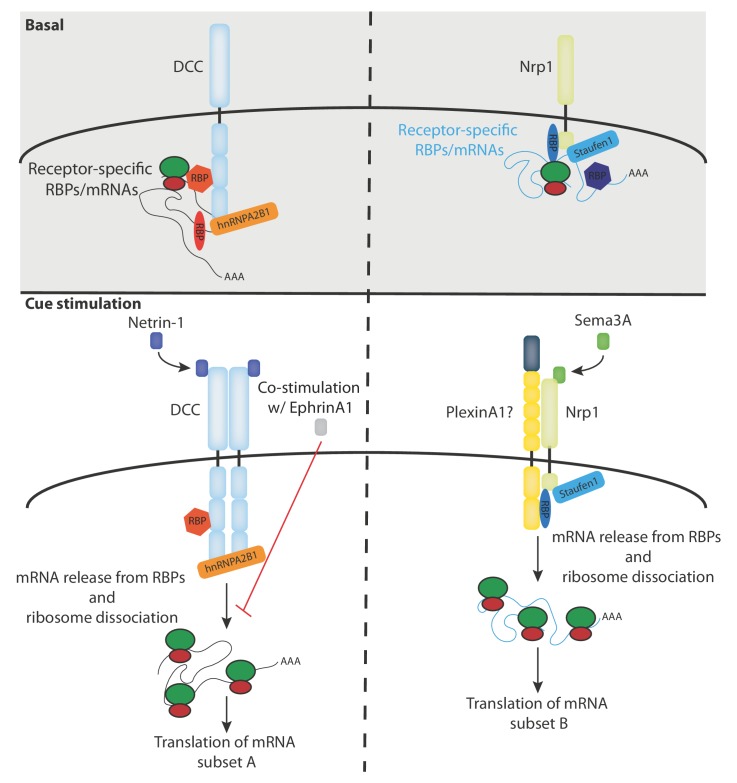
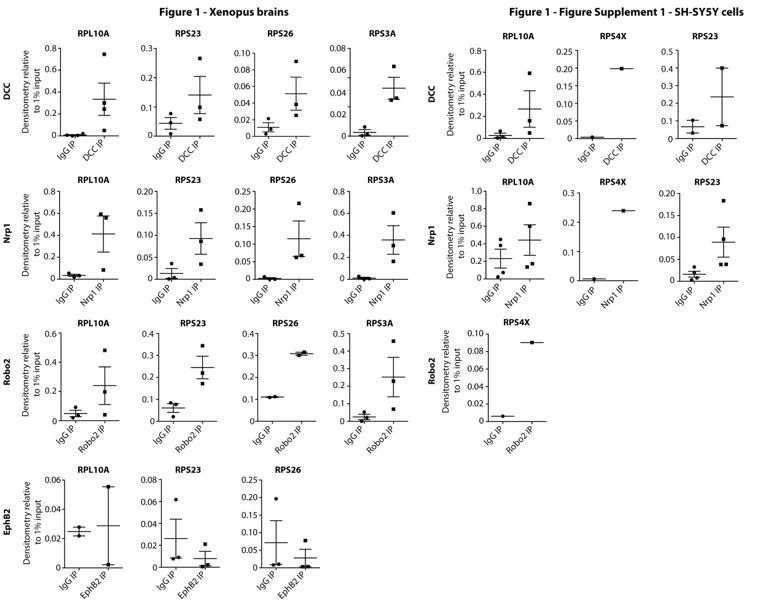
Extrinsic cues trigger the local translation of specific mRNAs in growing axons via cell surface receptors. The coupling of ribosomes to receptors has been proposed as a mechanism linking signals to local translation but it is not known how broadly this mechanism operates, nor whether it can selectively regulate mRNA translation. We report that receptor-ribosome coupling is employed by multiple guidance cue receptors and this interaction is mRNA-dependent. We find that different receptors associate with distinct sets of mRNAs and RNA-binding proteins. Cue stimulation of growing Xenopus retinal ganglion cell axons induces rapid dissociation of ribosomes from receptors and the selective translation of receptor-specific mRNAs. Further, we show that receptor-ribosome dissociation and cue-induced selective translation are inhibited by co-exposure to translation-repressive cues, suggesting a novel mode of signal integration. Our findings reveal receptor-specific interactomes and suggest a generalizable model for cue-selective control of the local proteome.

Keywords: RNA-binding protein; axon; developmental biology; guidance receptor; human; local protein synthesis; mRNA; neuroscience; retinal ganglion cell; xenopus.


Conflict of interest statement

MK, RC, TS, LW, PV, JQ, SZ, MJ, AD, MM, AB, CK, WH, JF, CH No competing interests declared

Figures

Figure 1.
Figure 1.. Multiple guidance cue receptors interact with ribosomes.
(A) Volcano plots showing statistically enriched proteins in DCC-IP and Nrp1-IP samples identified by permutation-based FDR-corrected t-test based on three biological replicates. The LFQ intensity of the DCC or Nrp1 pulldowns over IgG pulldowns are plotted against the -log10 p-value. FDR < 0.05; S0 = 2. (B) Gene enrichment analysis of statistically enriched proteins in the DCC and Nrp1 pulldown samples. The values in each circle denotes protein count. (C–F) Western blot validation of RP co-immunoprecipitation with DCC, Nrp1 and Robo2 but not with EphB2. Each Western blot was repeated 2 to 4 times, representative images are shown. (G–J) Relative 18S and 28S ribosomal RNA abundance after control (IgG) pulldown or receptors pulldowns shows enrichment of rRNA in DCC, Nrp1, and Robo2 but not EphB2 pulldowns (unpaired two-tailed t-test; three biological replicates). Bars indicate means, error bars indicate standard deviation; *p<0.05.
Figure 1—figure supplement 1.
Figure 1—figure supplement 1.. Multiple guidance cue receptors interact with ribosomes in SH-SY5Y cells.
(A–C) Western blot validation of RP co-immunoprecipitation with DCC, Nrp1 and Robo2 in SH-SY5Y cells. Western blots were repeated 2 to 4 times, Rps4X Western blots are from one experiment, representative examples are shown. (D–E) Relative 18S and 28S ribosomal RNA abundance after control (IgG) pulldowns or receptor pulldowns shows enrichment of rRNA in DCC and Nrp1 IPs in SH-SY5Y cells (unpaired two-tailed t-test; three biological replicates; Bars indicate mean, error bars indicate standard deviation. *p<0.05).
Figure 2.
Figure 2.. Receptor-ribosome coupling is mRNA dependent and DCC and Nrp1 bind to specific RBPs and mRNAs.
(A) Relative 18S and 28S ribosomal RNA abundance after control (IgG) pulldown or receptors pulldowns with or without EDTA or RNase A/T1 treatments (two-way ANOVA with Bonferroni’s multiple comparisons test; three biological replicates; Bars indicate mean, error bars indicate standard deviation; ***p<0.0001). (B) Western blot analysis and quantification of ribosomal proteins after DCC and (C) Nrp1 pulldowns. (two-way ANOVA with Bonferroni’s multiple comparisons test; three biological replicates; Bars indicate mean, error bars indicate standard deviation; **p<0.01; ***p<0.0001). (D) Hierarchically-clustered heatmap of detected RBPs after DCC and Nrp1 pulldown. LFQ intensities are plotted for each IP-MS replicate. (E) Mander’s overlap coefficients analysed using dual immunohistochemistry of DCC and Staufen1 or hnRNPA2B1 in axonal growth cones (unpaired two-tailed t-test; three biological replicates; individual data points are shown, error bars indicate SEM; p=0.03913). (F) Mander’s overlap coefficients analysed using dual immunohistochemistry Nrp1 and Staufen1 or hnRNPA2B1 in axonal growth cones (unpaired two-tailed t-test; three biological replicates; individual data points are shown, error bars indicate SEM; p=0.00161). (G) Volcano plot showing differential expression analysis for DCC and Nrp1 pulldowns. (H) Enrichment analysis plot of known RBP targets of Staufen1 and hnRNPA2B1 detected in RNA-sequencing data after DCC and Nrp1 pulldown (individual data points are shown, error bars indicate standard deviation, Mann-Whitney test, Wilcoxon rank sum test DCC versus Nrp1; p=0.001511).
Figure 2—figure supplement 1.
Figure 2—figure supplement 1.. Polysome fractionation analysis, RNase sensitivity of Nrp1-Staufen1 interaction and additional RNA-seq analyses.
(A) Control and (B) EDTA treated polysome fractions and Western blot showing the distribution of DCC and Nrp1 across fractions. (C) Relative quantification of DCC and Nrp1 protein levels in ribosome-free and ribosomal fractions for control and EDTA-treated samples (DCC control n = 2, DCC EDTA n = 2, Nrp1 control n = 2, Nrp1 EDTA n = 1; Bars indicate mean, errors bars indicate standard deviation). (D) UV absorbance profiles after sucrose density gradient fractionation for control and RNAseA/T1 treated lysates. (E) Western blot analysis and quantification of Staufen1 after Nrp1 pulldowns. (paired t-test; three biological replicates; bars indicate mean, error bars indicate standard deviation; p=0.0136). (F) Bioanalyzer gel analysis of RNA. (G) Distance matrix showing a high correlation between replicates and a distinct signature between samples. (H) Gene ontology enrichment plot of mRNAs after DCC or (I) Nrp1 pulldowns.
Figure 3.
Figure 3.. DCC and Nrp1 are in close proximity to ribosomes in axonal growth cones in a cue-dependent manner.
(A) Expansion imaging shows partial co-localization of DCC and (B) Nrp1 with ribosomal proteins (Scale bars, 5 μm). (C) Representative proximity ligation assay signal in axonal growth cones between DCC and RPL5/uL18, RPS4X/eS4 or IgG control (Scale bars, 5 μm). (D) Representative proximity ligation assay signal in axonal growth cones between Nrp1 and RPS3A/eS1, RPS23/uS12 or IgG control (Scale bars, 5 μm). (E) Representative PLA signal in axonal growth cones between EphB2 and RPL5/uL18 (left) and quantification of PLA signal in axonal growth cones compared to DCC-RPL5/uL18 or Nrp1-RPS23/uS12 (right) (Mann-Whitney test; three biological replicates; bars indicate mean, error bars indicate SEM, ***p<0.0001; Scale bars, 5 μm). (F) EM image of an unstimulated axonal growth cone showing ribosomes aligned in a row (red arrows) under plasma membrane (PM). Inset shows the growth cone at lower magnification; the red box indicates the area shown in higher magnification. The section glances through the extreme surface of growth cone, where it attaches to the culture dish, giving rise to areas that lack subcellular structure. (G) Distribution frequency of the inter-ribosome distance in nm of ribosomes in axonal growth cones (n = 20) or in RGC soma (n = 5). All distances larger than 100 nm were pooled together. (H, I, J, K) Quantification of PLA signal in cue-stimulated axonal growth cones relative to control (unpaired two-tailed t-test; bars indicate mean, error bars indicate SEM; ***p<0.0001; *p=0.0423; for n.s. in J p=0.3522; for n.s. in K, p=0.885). (L) Relative PLA quantification of DCC and RPL5/uL18 compared to control after Dynasore pre-treatment (50 μM for 20 min), Netrin-1, or Netrin-1 + Dynasore (one-way ANOVA with Bonferroni’s multiple comparisons test; bars indicate mean, error bars indicate SEM; p=0.001027 for Control vs. Netrin-1, p=0.000402 for Netrin-1 vs Netrin-1 + Dynasore, p=0.590377 for Control vs. Dynasore, p=0.384848 for Control vs Netrin + Dynasore). For all PLA experiments, numbers in bars indicate total number of growth cones quantified from at least three independent experiments.
Figure 3—figure supplement 1.
Figure 3—figure supplement 1.. DCC and Nrp1 are in close proximity to ribosomes in axonal growth cones in a cue-dependent manner.
(A) Pearson’s Correlation coefficients of DCC-RPL5/uL18 and Nrp1-RPS3A/eS1 from expanded axonal growth cones (data obtained from four biological replicates, bars indicate mean, error bars indicate SEM). (B) PLA images showing DCC and RPL10A/uL1 are in close proximity in axonal growth cones, whereas DCC and IgG control generates little to no PLA signal. Scale bars, 5 μm. (C–E) EM images of an unstimulated axonal growth cone (C), a growth cone lamellipodium (D) and a retinal ganglion cell body (E). Ribosomes can be seen aligned in rows (red arrows) or isolated (white arrow) under the plasma membrane and as polysomes (blue arrows) in the cell body. (F) PLA signal between DCC and hnRNPA2B1 does not decrease after a 2 min Netrin-1 stimulation in axonal growth cones (Mann-Whitney test; bars indicate mean, error bars indicate SEM; p=0.2886; representative PLA images are shown). (G) Sema3A stimulation at protein-synthesis independent concentration does not decrease puromycin levels in axonal growth cones (Mann-Whitney test; bars indicate mean, error bars indicate SEM; p=0.2487; representative images are shown) or (H) PLA signal between Nrp1 and RPS3A/eS1 (Mann-Whitney test; bars indicate mean, error bars indicate SEM; p=0.2555). For all Expansion microscopy, PLA and QIF experiments, numbers in bars indicate amount of growth cones quantified collected from at least three independent experiments.
Figure 4.
Figure 4.. EphrinA1 co-stimulation blocks Netrin-1 induced receptor-ribosome dissociation and selective translation.
(A) Relative PLA quantification of DCC and RPL5/uL18 compared to control after Netrin-1, EphrinA1, or co-stimulation (one-way ANOVA with Bonferroni’s multiple comparisons test; bars indicate mean, error bars indicate SEM; **p<0.01). (B, C) Puromycin QIF relative to control after Netrin-1, EphrinA1 or co-stimulation (one-way ANOVA with Bonferroni’s multiple comparisons test; bars indicate mean, error bars indicate SEM; ***p<0.0001). (D) Relative mRNA quantification after DCC IP of hnrnph1 and ctnnb1 mRNA (unpaired t-test with Welch’s corrections on dCT values; three biological replicates; bars indicate mean, error bars indicate SEM; *p=0.02 for hnrnph1; **p=0.0018 for ctnnb1). (E, F) β-Catenin QIF relative to control after Netrin-1, EphrinA1, Sema3A or Netrin-1 and EphrinA1 co-stimulation (one-way ANOVA with Bonferroni’s multiple comparisons test; bars indicate mean, error bars indicate SEM; ***p<0.0001). (G, H) hnRNPH1 QIF relative to control after Netrin-1, EphrinA1, Sema3A or Netrin-1 and EphrinA1 co-stimulation (one-way ANOVA with Bonferroni’s multiple comparisons test; bars indicate mean, error bars indicate SEM; ***p<0.0001; *p=0.0164). Scale bars, 5 μm. For all QIF experiments, numbers in bars indicate amount of growth cones quantified collected from at least three independent experiments.
Figure 4—figure supplement 1.
Figure 4—figure supplement 1.. EphrinA1 co-stimulation blocks Netrin-1 induced receptor-ribosome dissociation and selective translation of rps14.
(A) Relative PLA quantification of Nrp1 and RPS23/uS12 compared to control after Sema3A, EphrinA1, or co-stimulation with Sema3A and EphrinA1 (one-way ANOVA with Bonferroni’s multiple comparisons test; bars indicate mean, error bars indicate SEM; *p=0.032078; **p<0.018577; ***p<0.001). (B) pERK1/2 QIF relative to control after Netrin-1, EphrinA1 or Netrin-1 and EphrinA1 co-stimulation (one-way ANOVA with Bonferroni’s multiple comparisons test; bars indicate mean, error bars indicate SEM; ***p<0.0001). (C) Relative mRNA quantification after DCC IP of rps14 mRNA (unpaired t-test with Welch’s corrections on dCT values; three biological replicates; bars indicate mean, error bars indicate SEM; ***p=0.0003). (D) RPS14 QIF relative to control after Netrin-1, EphrinA1 or Netrin-1 and EphrinA1 co-stimulation (one-way ANOVA with Bonferroni’s multiple comparisons test; bars indicate mean, error bars indicate SEM; ***p<0.0001; *p=0.026544). (E) RpsRPS14 QIF relative to control after Netrin-1 or Sema3A stimulation (one-way ANOVA with Bonferroni’s multiple comparisons test; bars indicate mean, error bars indicate SEM; ***p<0.0001; *p<0.05). Scale bars, 5 μm. For all QIF experiments the numbers in bars indicate amount of growth cones quantified collected from three independent experiments.
Figure 5.
Figure 5.. Model diagram depicting the proposed interactions between receptors, RBPs, mRNAs and ribosomes under basal and cue stimulation conditions.
Author response image 1.

References

    1. Ascano M, Mukherjee N, Bandaru P, Miller JB, Nusbaum JD, Corcoran DL, Langlois C, Munschauer M, Dewell S, Hafner M, Williams Z, Ohler U, Tuschl T. FMRP targets distinct mRNA sequence elements to regulate protein expression. Nature. 2012;492:382–386. doi: 10.1038/nature11737. - DOI - PMC - PubMed
    1. Bellon A, Iyer A, Bridi S, Lee FCY, Ovando-Vázquez C, Corradi E, Longhi S, Roccuzzo M, Strohbuecker S, Naik S, Sarkies P, Miska E, Abreu-Goodger C, Holt CE, Baudet ML. miR-182 regulates Slit2-Mediated axon guidance by modulating the local translation of a specific mRNA. Cell Reports. 2017;18:1171–1186. doi: 10.1016/j.celrep.2016.12.093. - DOI - PMC - PubMed
    1. Cagnetta R, Frese CK, Shigeoka T, Krijgsveld J, Holt CE. Rapid Cue-Specific remodeling of the nascent axonal proteome. Neuron. 2018;99:29–46. doi: 10.1016/j.neuron.2018.06.004. - DOI - PMC - PubMed
    1. Cagnetta R, Wong HH, Frese CK, Mallucci GR, Krijgsveld J, Holt CE. Noncanonical modulation of the eIF2 pathway controls an increase in local translation during neural wiring. Molecular Cell. 2019;73:474–489. doi: 10.1016/j.molcel.2018.11.013. - DOI - PMC - PubMed
    1. Campbell DS, Regan AG, Lopez JS, Tannahill D, Harris WA, Holt CE. Semaphorin 3A elicits stage-dependent collapse, turning, and branching in Xenopus retinal growth cones. The Journal of Neuroscience. 2001;21:8538–8547. doi: 10.1523/JNEUROSCI.21-21-08538.2001. - DOI - PMC - PubMed

Publication types

Associated data