. 2008 Feb 5;105(5):1674-9.
doi: 10.1073/pnas.0706057105. Epub 2008 Jan 28.

Suppressor role of activating transcription factor 2 (ATF2) in skin cancer

Affiliations

Suppressor role of activating transcription factor 2 (ATF2) in skin cancer

Anindita Bhoumik et al. Proc Natl Acad Sci U S A. .

Abstract

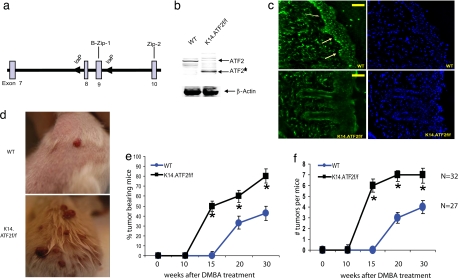
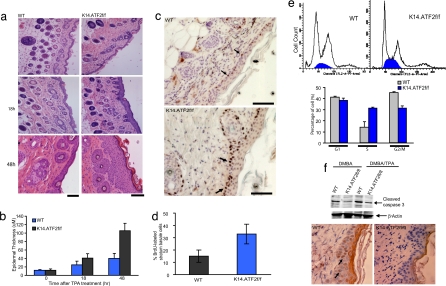
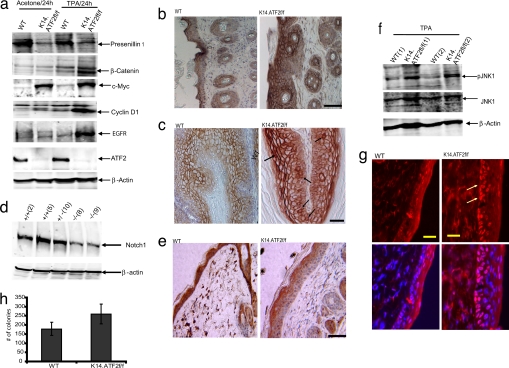
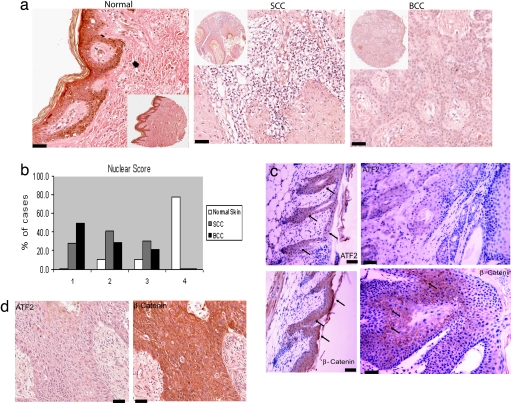
Activating transcription factor 2 (ATF2) regulates transcription in response to stress and growth factor stimuli. Here, we use a mouse model in which ATF2 was selectively deleted in keratinocytes. Crossing the conditionally expressed ATF2 mutant with K14-Cre mice (K14.ATF2(f/f)) resulted in selective expression of mutant ATF2 within the basal layer of the epidermis. When subjected to a two-stage skin carcinogenesis protocol [7,12-dimethylbenz[a]anthracene/phorbol 12-tetradecanoate 13-acetate (DMBA/TPA)], K14.ATF2(f/f) mice showed significant increases in both the incidence and prevalence of papilloma development compared with the WT ATF2 mice. Consistent with these findings, keratinocytes of K14.ATF2(f/f) mice exhibit greater anchorage-independent growth compared with ATF2 WT keratinocytes. Papillomas of K14.ATF2(f/f) mice exhibit reduced expression of presenilin1, which is associated with enhanced beta-catenin and cyclin D1, and reduced Notch1 expression. Significantly, a reduction of nuclear ATF2 and increased beta-catenin expression were seen in samples of squamous and basal cell carcinoma, as opposed to normal skin. Our data reveal that loss of ATF2 transcriptional activity serves to promote skin tumor formation, thereby indicating a suppressor activity of ATF2 in skin tumor formation.


Conflict of interest statement

The authors declare no conflict of interest.

Figures

Fig. 1.
Fig. 1.
Targeted disruption of ATF2 in mouse skin increases susceptibility to papilloma formation in the two-stage chemical carcinogenesis. (a) Targeting strategy shows WT allele of ATF2 encompassing exons 8 and 9 (boxes) and flanking loxP sequences (arrowheads). (b) Expression of ATF2 by immunoblot in skin extracts from K14.ATF2wt/wt (WT) and K14.ATF2f/f mice. β-Actin was used as loading control. ATF2* indicates the fast migrating form of ATF2 released after deletion of exons 8 and 9. An ATF2 antibody that recognizes C-terminal epitopes was used for Western blotting. (c) Immunohistochemical analysis of the expression of ATF2 in the frozen skin sections of WT and K14.ATF2f/f mice. (Scale bars, 50 μm.) Arrows point to the expression of ATF2 in the epidermis of WT skin. (d) Representative pictures of mice bearing papillomas 15 weeks after DMBA treatment. (e) Tumor incidence in the WT and K14.ATF2f/f mice. Data represent the percentage of mice with skin papillomas. Bars indicate SE. *, P < 0.04, statistically different from the WT mice, as determined by Student's t test. (f) Average number of papillomas per mouse after DMBA/TPA treatment. Data represent an average number of skin papillomas per mouse. Bars indicate SE. *, P < 0.04, statistically different from WT mice, as determined by Student's t test.
Fig. 2.
Fig. 2.
Epidermal hyperplasia induced by TPA treatment. (a) Dorsal skin of 8-week-old mice after three topical treatments with 10 μg of TPA was excised and stained with H&E. Histological analysis shown was performed 18 and 48 h after TPA treatment. (Scale bars, 50 μm.) (Top) Acetone-treated control skin. (b) Quantitative analysis of the epidermal thickness (in micrometers) after TPA treatment (P < 0.001). Bars indicate SD (n = 10). The thickness of the epidermis (in micrometers) was calculated as described in Materials and Methods. (c) Immunohistochemical analysis of BrdU incorporation. The dorsal skin of 8-week-old mice received three topical treatments with 10 μg of TPA. Twenty-four hours after TPA treatment, BrdU was injected i.p., and 1 h later the dorsal skin was isolated. Arrows indicate examples of BrdU-positive suprabasal cells. (Scale bars, 50 μm.) (d) Quantitative analysis of the BrdU-positive cells after TPA treatment (P < 0.001). Bars indicate SD (n = 10). (e) (Upper) Cell cycle profile of primary keratinocytes isolated from WT and K14.ATF2f/f pups subjected to FACS analysis. (Lower) Percentages of cells in G1, S, and G2/M phases (mean ± SD of three experiments). (f) Apoptosis was assessed with active caspase 3 antibody of skin from WT and K14.ATF2f/f mice after 5 days of DMBA alone or DMBA and 18 h of TPA treatment. The TPA treatment was done for skin thickening to facilitate visualization of active caspase 3-positive cells in an immunohistochemistry study. (Upper) Western blotting with the active caspase 3 antibody. (Lower) Staining pattern in the skin upon treatment with DMBA after 5 days, followed by TPA treatment. Arrows indicate active caspase 3-positive cells.
Fig. 3.
Fig. 3.
Reduced level of PS1 coincides with reduced Notch1 and elevated β-catenin expression in the TPA-treated skin and papillomas of K14.ATF2f/f mice. (a) Epidermis of mice that received three topical applications of acetone or TPA (10 μg) was isolated 24 h after the last treatment. Tissue lysates were subjected to Western blotting with antibodies to PS1, β-catenin, ATF2, c-Myc, cyclin D1, and EGFR. β-Actin was used as loading control. (b) The dorsal skin of 8-week-old mice was subjected to treatment as indicated in a and was excised, and paraffin sections were prepared and stained with β-catenin antibody. (Scale bar, 50 μm.) (c) β-Catenin staining in papilloma sections of the K14.ATF2f/f and WT mice. Cells exhibiting nuclear β-catenin staining are marked with arrows. (Scale bar, 50 μm.) (d) Keratinocytes isolated from K14.ATF2f/f and WT 1-day-old pups were lysed and were subjected to immunoblot analysis with antibodies to Notch1. β-Actin was used as loading control. (e) The dorsal skin of 8-week-old mice treated and prepared as indicated in b was immunostained with antibodies to Notch1. (Scale bar, 50 μm.) (f) Western blotting for phospho-JNK (pJNK1) and total JNK levels was performed as in a. Two mice for each group are shown. β-Actin was used as loading control. (g) Immunohistochemical analysis of the expression of phospho-c-Jun upon TPA treatment in the frozen skin sections of WT and K14.ATF2f/f mice. (Scale bars, 50 μm.) Arrows point to the expression of phospho-c-Jun in the epidermis of WT skin. (h) Increased anchorage-independent cell growth in K14.ATF2f/f keratinocytes. H-RasV12-infected WT and K14.ATF2f/f keratinocytes were seeded in soft agar. Colonies were counted 21 days later and scored microscopically. The data represent an average of three experiments (P < 0.005).
Fig. 4.
Fig. 4.
Reduced nuclear ATF2 expression in TMA samples from SCC and BCC patients. (a and b) ATF2 protein expression levels were assessed by using a tissue microarray that was stained with an antibody directed against ATF2. (a) Examples of staining in normal skin, SCC, and BCC. (Scale bars, 50 μm.) Scoring of ATF2 nuclear and cytosolic localization was performed as detailed in Materials and Methods. Forty samples from SCC patients, 14 samples of BCC patients, and 10 normal matched and nonmatched skin tissues were analyzed. Scores were divided into four categories: 1, scores ranging from 0 to 75; 2, scores ranging from 76 to 150; 3, scores ranging from 151 to 225; and 4, scores ranging from 226 to 300. (b) Distribution of nuclear ATF2 staining in normal skin, BCC, and SCC. (c) (Left) Staining of the skin derived from the WT mouse that developed papillomas with ATF2 (Upper) and β-catenin (Lower). (Right) Staining of the corresponding papillomas with antibodies to ATF2 (Upper) and β-catenin (Lower). (Scale bars, 50 μm.) (d) Staining of the TMA used in a with ATF2 (Left) and β-catenin antibody (Right). (Scale bars, 50 μm.)

References

    1. van Dam H, Wilhelm D, Herr I, Steffen A, Herrlich P, Angel P. EMBO J. 1995;14:1798–1811. - PMC - PubMed
    1. Gupta S, Campbell D, Dérijard B, Davis RJ. Science. 1995;267:389–393. - PubMed
    1. van Dam H, Castellazzi M. Oncogene. 2001;20:2453–2464. - PubMed
    1. Benbrook DM, Jones NC. Oncogene. 1990;5:295–302. - PubMed
    1. Kerppola TK, Curran T. Mol Cell Biol. 1993;13:5479–5489. - PMC - PubMed

Publication types

MeSH terms

Associated data