. 2007 Dec;12(6):542-58.
doi: 10.1016/j.ccr.2007.11.012.

ETV6-NTRK3 fusion oncogene initiates breast cancer from committed mammary progenitors via activation of AP1 complex

Affiliations

ETV6-NTRK3 fusion oncogene initiates breast cancer from committed mammary progenitors via activation of AP1 complex

Zhe Li et al. Cancer Cell. 2007 Dec.

Abstract

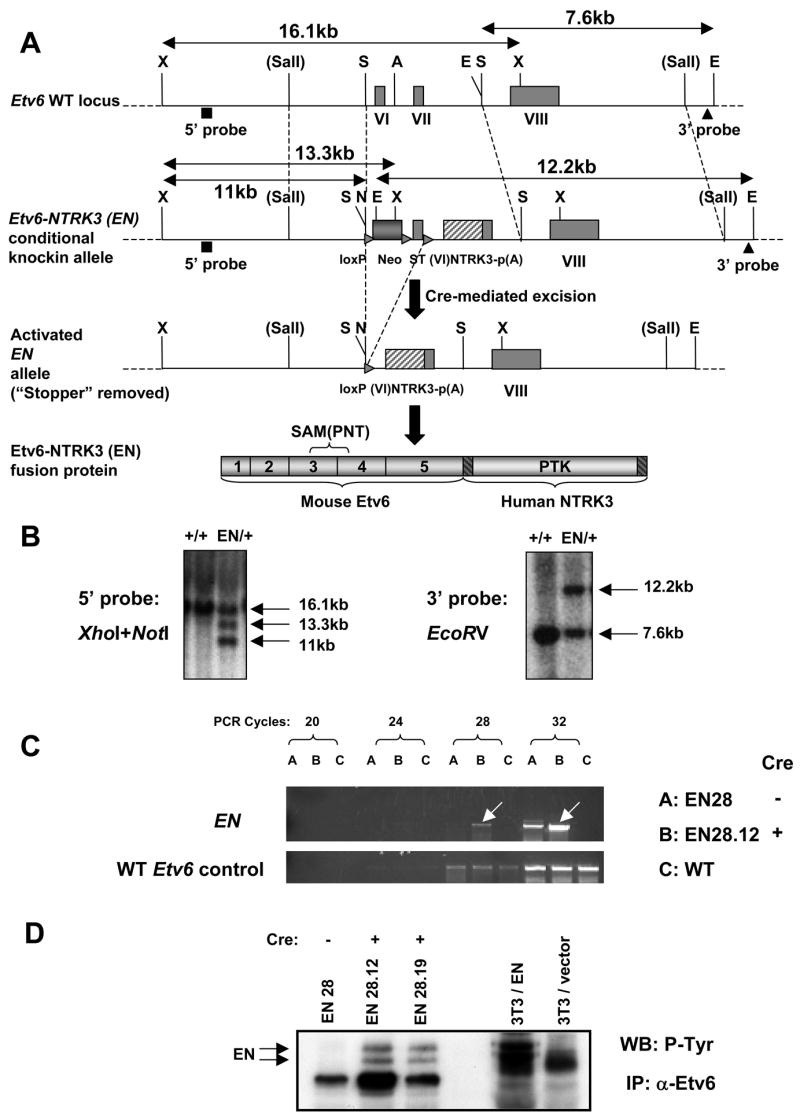
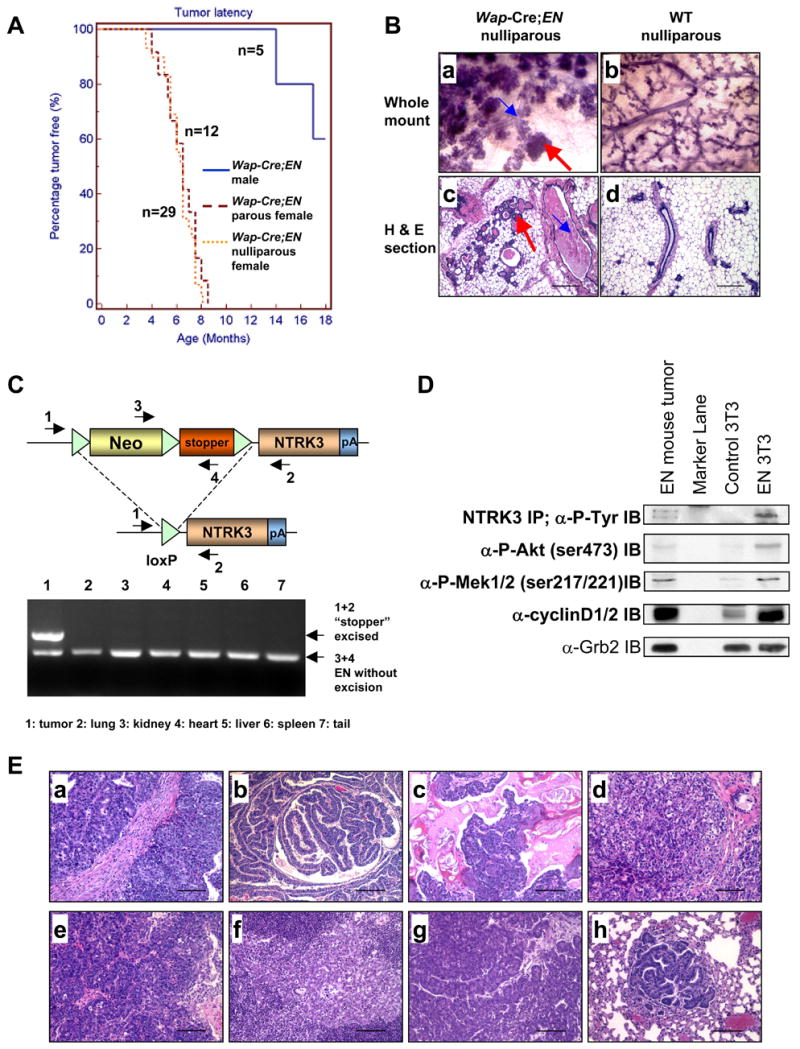
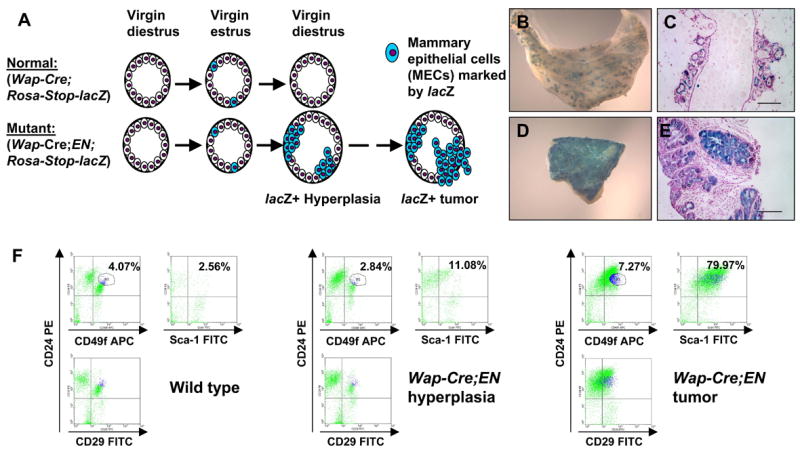
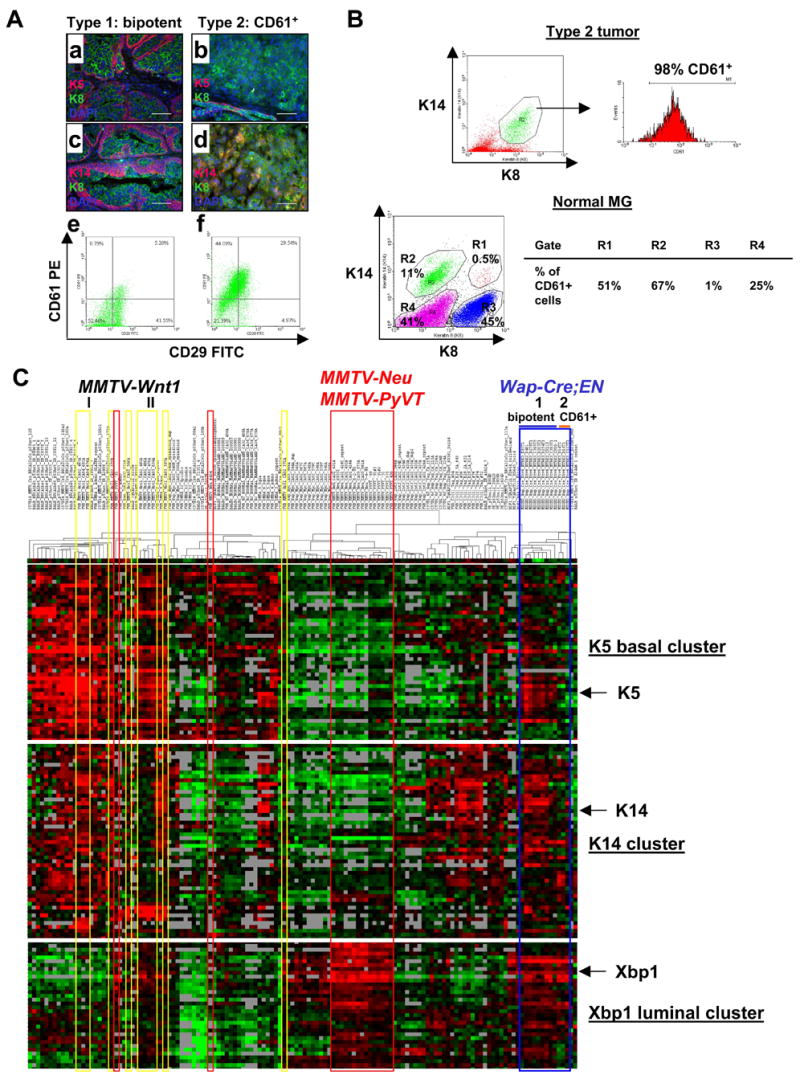
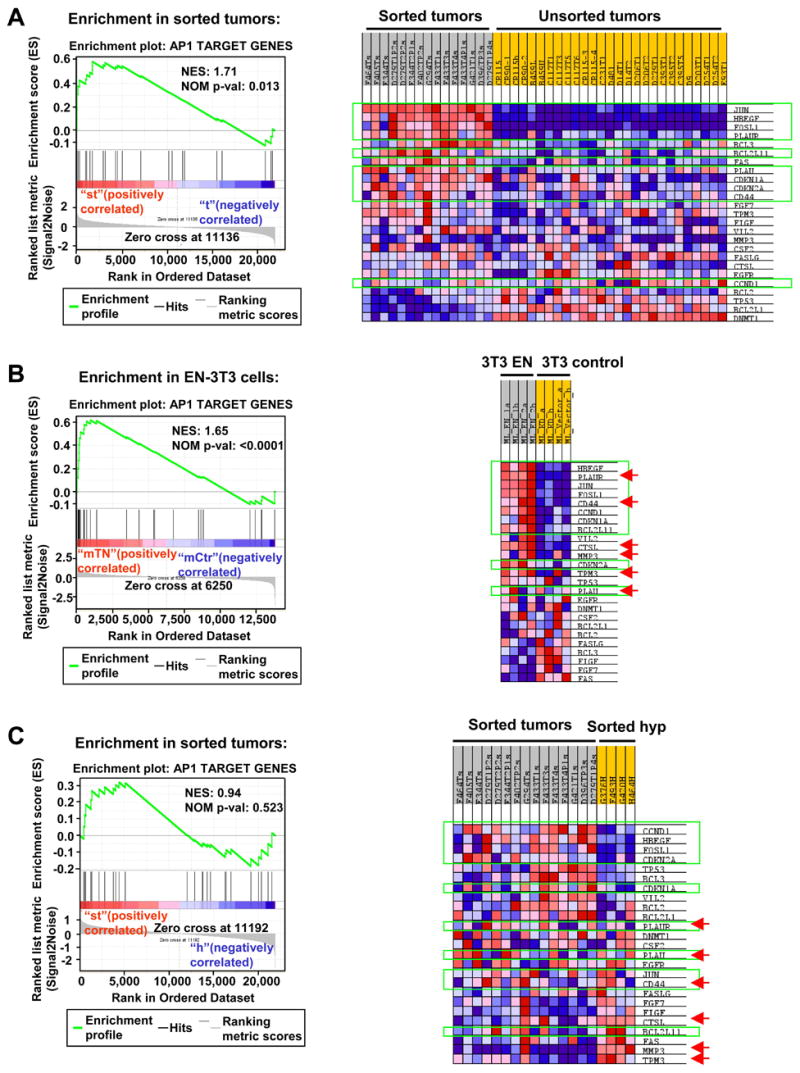
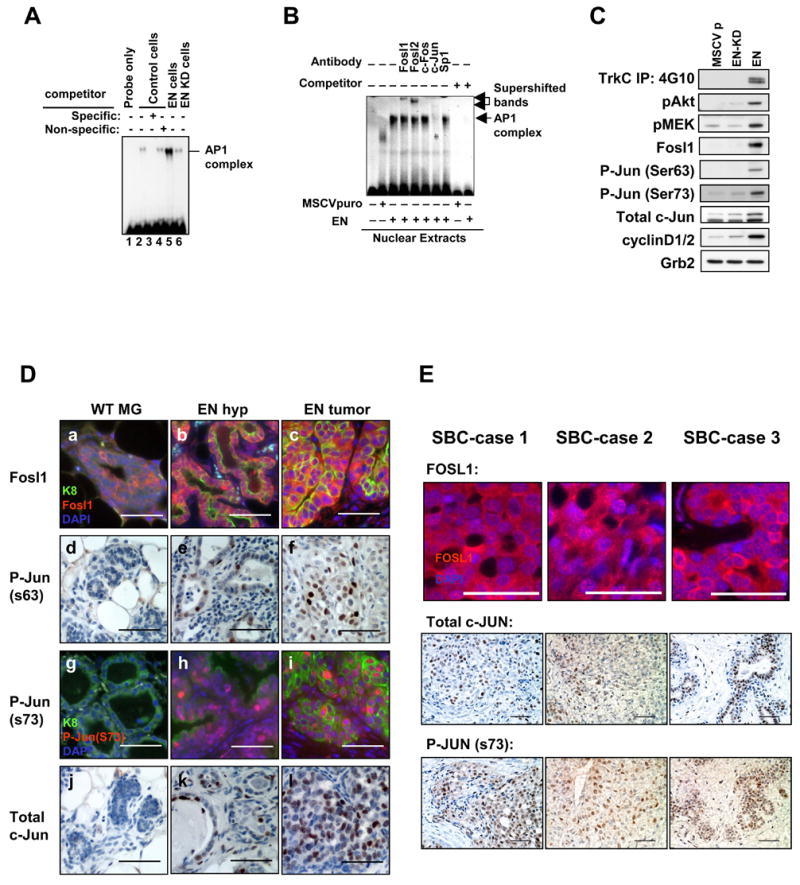
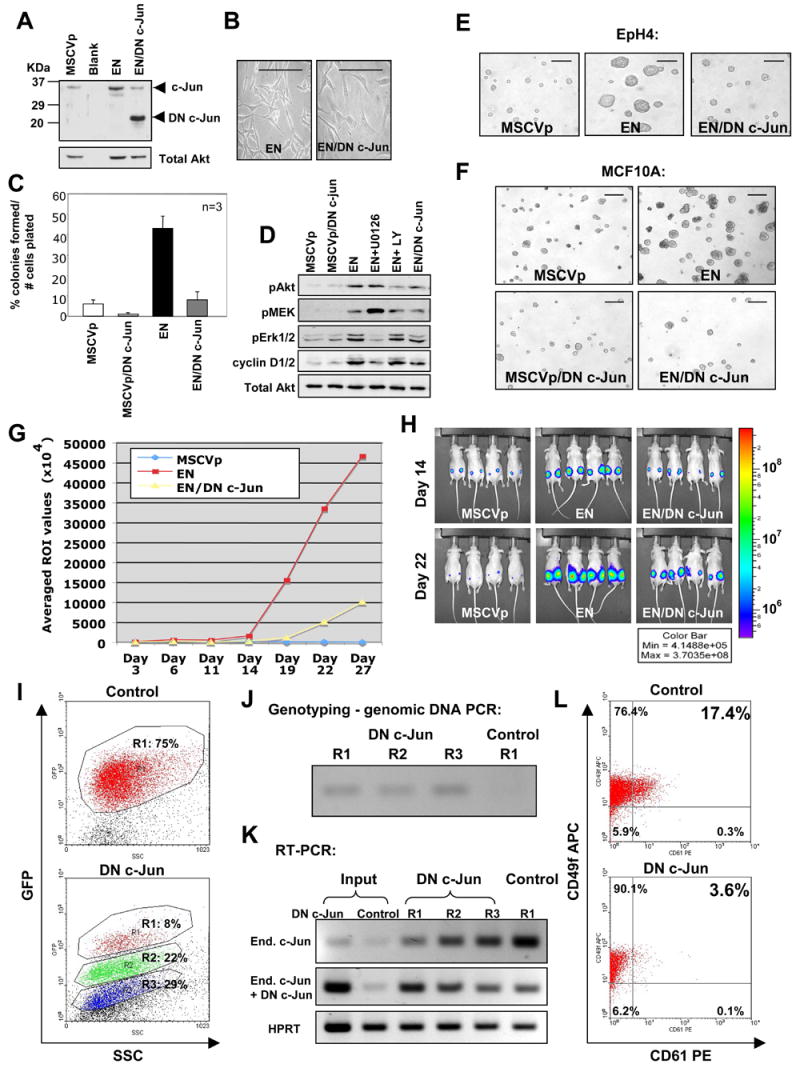
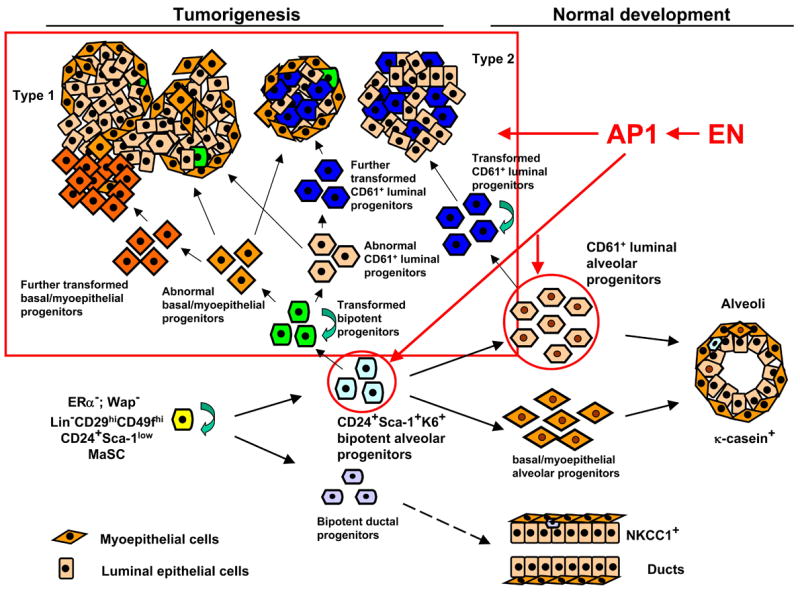
To better understand the cellular origin of breast cancer, we developed a mouse model that recapitulates expression of the ETV6-NTRK3 (EN) fusion oncoprotein, the product of the t(12;15)(p13;q25) translocation characteristic of human secretory breast carcinoma. Activation of EN expression in mammary tissues by Wap-Cre leads to fully penetrant, multifocal malignant breast cancer with short latency. We provide genetic evidence that, in nulliparous Wap-Cre;EN females, committed alveolar bipotent or CD61(+) luminal progenitors are targets of tumorigenesis. Furthermore, EN transforms these otherwise transient progenitors through activation of the AP1 complex. Given the increasing relevance of chromosomal translocations in epithelial cancers, such mice serve as a paradigm for the study of their genetic pathogenesis and cellular origins, and generation of preclinical models.


Figures

Figure 1
Figure 1. Generating the Etv6-NTRK3 (EN) conditional knockin allele
(A) Schematic diagrams of the endogenous WT Etv6 allele, the EN conditional knockin allele, the activated EN allele upon Cre-mediated excision of the floxed Neo-stopper cassette (ST: stopper), and the EN fusion protein produced from the activated EN allele. The 5′ and 3′ probes for southern blot are shown. X: XhoI, S: SpeI, A: ApaI, E: EcoRV, N: NotI, VI, VII, VIII: exon 6, 7, and 8 of Etv6, p(A): poly(A) signal, SAM(PNT): sterile alpha motif/pointed domain, PTK: protein tyrosine kinase domain. (B) Southern blot screen and confirmation of correctly targeted ES cell clones. The 5′ probe recognizes a 16.1kb XhoI fragment from the WT Etv6 allele, a 13.3kb XhoI fragment (due to incomplete digestion of NotI) and an 11kb XhoI-NotI fragment (complete digestion) from the EN knockin allele. The 3′ probe recognizes a 7.6kb EcoRV fragment from the WT allele, and a 12.2kb EcoRV fragment from the EN allele. (C) RT-PCR analysis showing greatly elevated expression of the EN fusion transcript from the “stopper”-excised ES cells (EN28.12). Note EN has slightly leaky expression in the parental EN28 ES cells (without excision of the “stopper”). (D) Western blot showing detection of the EN fusion protein (tyrosine phosphorylated doublet) from the “stopper”-excised ES cells (EN28.12, EN28.19), but not from the parental EN28 ES cells. EN-3T3 cells were used as the positive control.
Figure 2
Figure 2. Wap-Cre;EN mice develop mammary tumors with antecedent alveolar hyperplasia
(A) Tumor free curves. (B) Mammary glands (MGs) of WCEN females (a,c) exhibit extensive lobuloalveolar hyperplasia compared to WT (b,d). a–b: MG whole mounts stained with hematoxylin; c–d: hematoxylin & eosin (H&E) stained MG sections (scale bars=200μm). Red arrows: alveolar hyperplasia. Blue arrows: dilated ducts and accumulation of secretions within ducts. (C) PCR analysis on genomic DNA shows excision of the Neo-stopper cassette only in the tumor. Locations of PCR primers (1–4) are indicated. (D) Western blot analysis of the WCEN tumor. EN-3T3 cells were used as the positive control. IP/Western confirms EN expression in both the tumor and EN-3T3 cells. (E) Histology (H&E stained sections, scale bars=100μm) of mammary tumors developed in WCEN mice. Panel c shows squamous metaplasia; Panels e and f were from a nulliparous female, e shows a primary mammary tumor and f shows metastasis in a lymph node; Panels g and h were from a male, g shows a primary mammary tumor and h shows metastasis in the lung.
Figure 3
Figure 3. Target cells of mammary tumors developed in Wap-Cre;EN virgins are transient mammary progenitors, rather than MaSCs
(A) Schematic diagram of the lacZ-marking experiment. Normal WCLZ virgin MGs contain a transient wave of lacZ+ MECs. In WCENLZ mutant MGs, the transient lacZ+ MECs appear to be rescued from death and lead to lacZ+ alveolar hyperplasia and eventually lacZ+ mammary tumors. (B–E) B and D show whole mounts of WCENLZ MG and tumor stained for lacZ activity. C and E are lacZ-stained tissue sections counterstained with nuclear fast red. Note in B and C, lacZ+ cells are mainly restricted to the alveolar compartment. Scale bars=100μm. (F) Flow cytometry analysis of a WT MG, a WCEN hyperplastic MG, and a WCEN tumor. The profiles shown here have already been gated for lineage-negative (Lin) cells. Percentages of positive cells are from a representative experiment.
Figure 4
Figure 4. Two major types of Wap-Cre;EN tumors characterized by immunostaining and microarray analysis
(A) EN type 1 (bipotent: a,c,e) and type 2 (CD61+: b,d,f) tumors based on K5/K8 (a–b), K14/K8 (c–d), and CD61/CD29 (e–f) staining patterns. Scale bars=50μm. (B) Flow cytometry analysis showing that K8+K14+ cells in EN type 2 tumors are CD61+. In normal MGs, almost all CD61+ MECs (gates R1-3) are K14+. Gate R4 represents non-epithelial cells in MGs. (C) Hierarchical cluster analysis of 12 WCEN tumors (Type 1 and 2, blue lines) together with 122 samples from other murine models of breast cancer and normal MGs. MMTV-Wnt1 tumors (clusters I and II) are highlighted by yellow lines. MMTV-Neu and MMTV-PyVT tumors are highlighted by red lines. Heat maps of 3 representative gene clusters (K5, K14, and Xbp1) are shown (heat maps showing all genes in the intrinsic gene list are shown in Figure S5). Gene names for each cluster are listed in Table S8. In the heat map, red, black, and green represent above average, average, and below average levels of expression, respectively. Gray indicates no data recorded.
Figure 5
Figure 5. Enrichment of c-Jun/Fosl1 and AP1 targets in EN-transformed cells
(A–C) GSEAs show enrichment of c-Jun/Fosl1 and AP1 target genes in sorted EN tumor cells compared to unsorted tumors (A) and sorted hyperplastic cells (C), and in EN-3T3 cells (B). Genes expressed at higher levels in both sorted tumors and EN-3T3 cells are highlighted with green lines. Genes expressed at higher levels in both sorted hyperplastic MECs and EN-3T3 cells are indicated by red arrows.
Figure 6
Figure 6. Upregulation and activation of the c-Jun/Fosl1 AP1 complex is associated with EN-mediated transformation
(A) AP1 EMSAs on nuclear lysates from control, EN, or EN kinase dead (KD) transduced 3T3 cells. Incubation with a specific unlabelled competitor blocks bandshift (lane 3). EN-3T3 nuclear lysates produced a significantly larger bandshift compared to control or EN KD-3T3 lysates (Compare Lane 5 to Lane 2 and 6). (B) Antibodies specific to Fosl1, Fosl2, and c-Jun bandshifted or destroyed the AP1 bandshift produced by EN nuclear extracts whereas antibodies to c-Fos and Sp1 had no effect. (C) Western blot analysis performed on lysates from serum starved control (MSCVp), kinase dead EN (EN-KD), and EN 3T3 cells. EN cells possessed a tyrosine phosphorylated oncoprotein doublet and elevated levels of phosphorylated Akt, MEK, and c-Jun (ser 63 and 73) as well as elevated levels of Fosl1, total c-Jun and cyclin D1/2. Loading control: Grb2. (D) Immunofluorescence (a–c, g–i) and immunohistochemical (d–f, j–l) staining of WT MGs (a, d, g, j), EN hyperplastic MGs (b, e, h, k), and EN mammary tumors (c, f, i, l) with antibodies against Fosl1 (a–c), phosphorylated c-Jun at Ser63 (d–f) and at Ser73 (g–i), and total c-Jun (j–l). WT MGs in a, d, and j were from nulliparous female mice. WT MG in g was from a lactating female. Scale bars=50μm. (E) Immunostaining of 3 SBC cases confirms presence/activation of the c-JUN/FOSL1 AP1 complex. Scale bars=50μm.
Figure 7
Figure 7. Expression of a dominant negative (DN) c-Jun blocks EN-mediated transformation
(A) Expression of DN c-Jun in EN expressing cells confirmed by western blot analysis. Loading control: total Akt. (B–C) DN c-Jun expression reverts EN-mediated morphological transformation (B, scale bars =50μm) and soft agar colony formation (C, error bars=mean +/− SD) in 3T3 cells. (D) Western blot analysis of serum starved control cells (MSCVp) and EN cells [alone; co-expressing DN c-Jun; or treated with either MEK inhibitor U0126 or PI3K inhibitor LY294002 (LY) (25μM)]. Both U0126 treatment and co-expression of DN c-Jun had a significant effect upon cyclin D1/2 levels in EN cells. Loading control: total Akt. (E) Effects of EN and DN c-Jun expression on EpH4 cell growth after 4 days in 3-D Matrigel cultures. Scale bars=500μm. (F) Effects of EN and DN c-Jun expression on human MCF10A cell growth in 3-D Matrigel cultures. Scale bars=1000μm. (G) Tumor growth curves of luciferase expressing cells injected subcutaneously into nude mice. ROI= regions of interest values in photons/sec/cm2/sr. (H) Comparison of bioluminescent images of mice at day 14 and day 22. (I) Top panel shows Gfp+ cells in an empty-vector transduced EN tumor developed in the Rag2−/− host. Lower panel shows 3 distinct populations of Gfp+ cells (R1–R3: express high, medium, and low levels of Gfp, respectively) in a DN c-Jun transduced EN tumor developed in the Rag2−/−host. (J) PCR genotyping (using a forward primer in the DN c-Jun and a reverse primer in the PGK promoter of the viral vector) confirms integration of DN c-Jun viruses in all 3 populations (R1–R3) of the DN c-Jun/EN tumor. This primer set does not detect the control viruses (vector only). (K) Expression levels of DN c-Jun are estimated indirectly by comparing expression levels of the endogenous c-Jun to those of total c-Jun (endogenous+DN c-Jun). Expression of the endogenous c-Jun is detected by a PCR primer set located in the region deleted in DN c-Jun. Expression of total c-Jun is detected by a second primer set located in the common region. (L) Flow cytometry analysis shows reduced number of CD61+ cells in the DN c-Jun/EN tumor compared to the control tumor. A representative experiment is shown.
Figure 8
Figure 8. The mammary epithelial cell hierarchy in normal mammary glands and in mammary tumors from Wap-Cre;EN females
Proposed target cells of EN in WCEN females are indicated (red circles). Red arrows indicate EN-initiated tumorigenesis (both tumor initiation and progression) is mediated through AP1.

References

    1. Asselin-Labat ML, Sutherland KD, Barker H, Thomas R, Shackleton M, Forrest NC, Hartley L, Robb L, Grosveld FG, van der Wees J, et al. Gata-3 is an essential regulator of mammary-gland morphogenesis and luminal-cell differentiation. Nat Cell Biol. 2007;9:201–209. - PubMed
    1. Bakiri L, Lallemand D, Bossy-Wetzel E, Yaniv M. Cell cycle-dependent variations in c-Jun and JunB phosphorylation: a role in the control of cyclin D1 expression. Embo J. 2000;19:2056–2068. - PMC - PubMed
    1. Belguise K, Kersual N, Galtier F, Chalbos D. FRA-1 expression level regulates proliferation and invasiveness of breast cancer cells. Oncogene. 2005;24:1434–1444. - PubMed
    1. Booth BW, Boulanger CA, Smith GH. Alveolar progenitor cells develop in mouse mammary glands independent of pregnancy and lactation. J Cell Physiol. 2007;212:729–736. - PubMed
    1. Boulanger CA, Wagner KU, Smith GH. Parity-induced mouse mammary epithelial cells are pluripotent, self-renewing and sensitive to TGF-beta1 expression. Oncogene. 2005;24:552–560. - PubMed

Publication types

MeSH terms

Associated data