. 2024 Oct 29;15(1):9334.
doi: 10.1038/s41467-024-53601-x.

Protein O-GlcNAcylation coupled to Hippo signaling drives vascular dysfunction in diabetic retinopathy

Affiliations

Protein O-GlcNAcylation coupled to Hippo signaling drives vascular dysfunction in diabetic retinopathy

Yi Lei et al. Nat Commun. .

Abstract

Metabolic disorder significantly contributes to diabetic vascular complications, including diabetic retinopathy, the leading cause of blindness in the working-age population. However, the molecular mechanisms by which disturbed metabolic homeostasis causes vascular dysfunction in diabetic retinopathy remain unclear. O-GlcNAcylation modification acts as a nutrient sensor particularly sensitive to ambient glucose. Here, we observe pronounced O-GlcNAc elevation in retina endothelial cells of diabetic retinopathy patients and mouse models. Endothelial-specific depletion or pharmacological inhibition of O-GlcNAc transferase effectively mitigates vascular dysfunction. Mechanistically, we find that Yes-associated protein (YAP) and Transcriptional co-activator with PDZ-binding motif (TAZ), key effectors of the Hippo pathway, are O-GlcNAcylated in diabetic retinopathy. We identify threonine 383 as an O-GlcNAc site on YAP, which inhibits its phosphorylation at serine 397, leading to its stabilization and activation, thereby promoting vascular dysfunction by inducing a pro-angiogenic and glucose metabolic transcriptional program. This work emphasizes the critical role of the O-GlcNAc-Hippo axis in the pathogenesis of diabetic retinopathy and suggests its potential as a therapeutic target.


Conflict of interest statement

The authors declare no competing interests.

Figures

Fig. 1
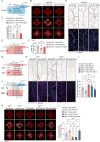
Fig. 1. Elevated O-GlcNAc-modified protein levels in diabetic retinopathy.
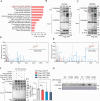
A ELISA analysis of UDP-GlcNAc levels in the vitreous fluid of proliferative diabetic retinopathy (PDR) and non-diabetic patients (n = 7/11 patients). Values are shown as mean ± SEM, with statistical significance at p < 0.0001 (two-tailed Student’s t-test). B Schematic of the streptozotocin (STZ)-induced diabetic model. The upper timeframe represents postnatal weeks, while the lower depicts the duration of diabetes induction by STZ. C Schematic diagram illustrating the oxygen-induced retinopathy (OIR) mouse model. RA: room air. D Western blot and quantification showing elevated O-GlcNAc-modified protein levels in the retina of diabetic mice compared to controls (n = 5/5 mice). Values as mean ± SEM, p = 0.0478 (two-tailed Student’s t-test). E Western blot and quantification showing O-GlcNAc-modified proteins in OIR pups compared to controls (n = 6/6 pups). Values as mean ± SEM, p = 0.046 (two-tailed Student’s t-test). F, G Flat-mounted retinas stained for O-GlcNAc (green) and CD31/IsoB4 (red), illustrating O-GlcNAc levels in control and diabetic/OIR mice. Representative images of O-GlcNAc (green), CD31 (red), and DAPI (blue) staining in frozen eye sections (H) and quantification of O-GlcNAc-modified protein levels in retinal vessels (CD31+ area) (I) from diabetic and control mice at different time points (n = 6/5, 6/5, 6/6 mice). Mean ± SEM, p-values < 0.0001 (two-tailed Student’s t-test). Representative images (J) and quantification (K) of O-GlcNAc-modified proteins in retinal vessels (IsoB4+ area) from OIR pups and controls (n = 6/6 mice). Mean ± SEM, p = 0.0071 (two-tailed Student’s t-test). L Western blot and quantification of O-GlcNAc-modified proteins in HRCECs exposed to varying glucose concentrations (n = 3 independent experiments). Mean ± SEM, p = 0.0054, p = 0.0007 (one-way ANOVA with Dunnett’s test). M Western blot and quantification of O-GlcNAc-modified proteins in HRCECs under hypoxia for 0, 12, and 24 h (n = 3 independent experiments). Mean ± SEM, p = 0.0051, p = 0.0007 (one-way ANOVA with Dunnett’s test). *p < 0.05; **p < 0.01; ***p < 0.001; scale bars: 100 µm (F, G), 30 µm (H, J). Source data provided as a Source Data file.
Fig. 2
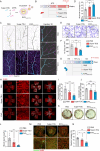
Fig. 2. O-GlcNAcylation in ECs affects physiological and pathological retinal angiogenesis.
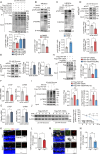
A BrdU incorporation in HRCECs treated with DMSO or 25 μM PUGNAc for 24 h. B Quantification of BrdU+ cells (red) as a percentage of total cell number in (A) (n = 3/3 independent experiments). Mean ± SEM, p = 0.0249 (two-tailed Student’s t-test). C Representative images of mouse aortic rings treated with DMSO or 25 μM PUGNAc for 5 days, stained with Phalloidin (red). D Quantification of microvascular sprouting area / total ring area in (C) (n = 6/7 aortic rings). Mean ± SEM, p = 0.0271 (two-tailed Student’s t-test). E Paracellular resistance in HRCECs treated with DMSO or 25 μM PUGNAc for 12 h. (n = 4/4 independent experiments). Multiple unpaired t-tests using two-stage step-up (Benjamini, Krieger, and Yekutieli) method. F Schematic of STZ and 4-OHT injections in OgtWT and OgtiΔEC mice. G Desmin (Cyan) and CD31 (Magenta) staining of retinas 9 weeks after STZ onset. Arrowheads indicate vessels without mural cell coverage. H Quantification of mural cell coverage (%) in (G) (n = 6/6 mice). Mean ± SEM, p = 0.0038 (two-tailed Student’s t-test). I Retinal trypsin digestion showing acellular capillaries (Ac-Cap) in STZ mice. Black arrowheads indicate acellular capillaries. J Quantification of Ac-Cap in (I). Ac-Caps were quantified in 3 random fields per retina (n = 6/6 retinas). Mean ± SEM, p = 0.0018 (two-tailed Student’s t-test). K Collagen-lV (green) and CD31 (red) staining of retinas from (G). Arrowheads indicate CollV+CD31- sleeves. L Quantification of CollV+CD31- sleeves per field of retina (n = 3/3 mice, 15 fields per retina). Mean ± SEM, p = 0.0311 (two-tailed Student’s t-test). M Schematic of tamoxifen injections in the OIR model. N Representative images of retinal vasculature stained with IsoB4 (red) in OIR pups at P17. Quantification of retinal neovascularization (O) and avascular area (P) in (N) (n = 13/8 pups). Mean ± SEM, p = 0.0489 (two-tailed Student’s t-test). *p < 0.05; **p < 0.01. Scale bars: 200 µm in (A), (C), 100 µm in (G), 50 µm in (I), (K), and 500 µm in (N). Source data are provided as a Source Data file.
Fig. 3
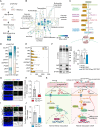
Fig. 3. O-GlcNAcylation regulates Hippo pathway in ECs.
A HRCECs were treated with DMSO or 25 μM PUGNAc for 24 h, and total RNA was harvested for RNA-seq. The enriched pathways for significantly upregulated genes under PUGNAc treatment are shown. The p-value for the Hippo-Yap signaling pathway (WP4537) is 0.0005, computed using the Fisher exact test. B, C HRCECs were infected with Ad-Flag-YAP and Ad-Flag-TAZ for 24 h, followed by treatment with 5.5 mM or 25 mM glucose for an additional 24 h. YAP and TAZ O-GlcNAcylation was analyzed via immunoprecipitation using anti-Flag beads and western blot (n = 3 independent experiments). D, E YAP was purified from HRCECs and analyzed by MS to identify the O-GlcNAcylation sites. Two different O-GlcNAcylation sites in YAP are shown (T358 and T383). F HEK 293T cells were transfected with Flag-YAP-T358A, Flag-YAP-T383A, or Flag-YAP-2TA (T358A and T383A) plasmids. YAP O-GlcNAcylation was analyzed via immunoprecipitation followed by western blot (n = 3 independent experiments). Mean ± SEM, p-values = 0.4728, 0.0488, and 0.0221 (one-way ANOVA with Dunnett’s multiple comparisons test). G Identification of the O-GlcNAcylation modification sites of YAP by in vitro O-GlcNAcylation assay. Purified wild-type or mutant YAP was used as substrates. Coomassie blue staining shows the YAP protein used in the assay. Three independent experiments were performed. *p < 0.05. Source data are provided as a Source Data file.
Fig. 4
Fig. 4. YAP O-GlcNAcylation regulates its phosphorylation at S397.
A HEK 293T cells transfected with indicated plasmids. pYAP-S397 was analyzed via immunoprecipitation followed by western blot (n = 3 independent experiments). Mean ± SEM, p-values = 0.0068, 0.004 (one-way ANOVA, Dunnett’s test). B Western blot and quantification of pYAP-S397 in HRCECs treated with DMSO or 25 μM PUGNAc for 24 h (n = 3 independent experiments). Mean ± SEM, p = 0.0002 (two-tailed Student’s t-test). C pYAP-S397 in HRCECs treated with DMSO or 15 μM OSMI-1 for 24 h in 25 mM glucose medium (n = 3 independent experiments). Mean ± SEM, p = 0.0053 (two-tailed Student’s t-test). D, E YAP O-GlcNAcylation in HRCECs infected with Ad-Flag-YAP, transfected with siCtrl or siOGT/siOGA under 25 mM glucose (n = 3 independent experiments). Mean ± SEM, p-values: (D) = 0.0091, 0.0318; (E) = 0.0336, 0.0339 (two-tailed Student’s t-test). F, G Relative CTGF and CYR61 mRNA in HRCECs treated as in (D) analyzed by qRT-PCR (n = 3 independent experiments). Mean ± SEM, p-values: (F) = 0.0191, 0.0458; (G) = 0.0298, 0.0443 (two-tailed Student’s t-test). H HRCECs infected with indicated adenovirus, treated with DMSO or 25 μM PUGNAc, and analyzed for pYAP-S397 (n = 3 independent experiments). Mean ± SEM, p = 0.0012 (one-way ANOVA, Dunnett’s test). I Ubiquitination and β-TRCP levels in HRCECs infected with indicated adenovirus and treated with MG132 or vehicle (n = 3 independent experiments). Mean ± SEM, p-values = 0.0011, 0.0002, 0.0196, 0.0125 (one-way ANOVA, Tukey’s test). J YAP stability in HRCECs infected with indicated adenovirus and treated with 50 µg/ml CHX for western blot. Flag-YAP protein levels were quantified as Flag-YAP/β-Actin (n = 3 independent experiments). Mean ± SEM, p-values: 0.0064, <0.0001 (two-way ANOVA, Šídák’s test). KN Images and quantification of YAP/TAZ (green) within vessels (CD31+ or IsoB4+ areas, red) from OgtWT and OgtiΔEC STZ or OIR mice (n = 4/4 mice in L, 6/6 mice in N). Mean ± SEM, p-values: (L) = 0.0443; (N) = 0.0002 (two-tailed Student’s t-test). *p < 0.05; **p < 0.01; ***p < 0.001. Scale bars: 30 µm in (K, M). Source data provided as a Source Data file.
Fig. 5
Fig. 5. Endothelial YAP/TAZ expression is elevated in DR and plays a critical role in pathological angiogenesis.
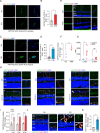
A Proximity ligation assay (PLA) of YAP/TAZ and OGT interaction in frozen eyeball sections from control and STZ-induced diabetic mice. CD31 was stained for blood vessels. B Quantification of PLA counts (red) in CD31+ areas (green) (n = 3/3 mice). Mean ± SEM, p = 0.016 (two-tailed Student’s t-test). C PLA of YAP/TAZ and OGT interaction in frozen eyeball sections from control and OIR model pups. CD31 was stained for blood vessels. D Quantification of PLA counts in CD31+ areas (n = 3/3 mice). Mean ± SEM, p = 0.0033 (two-tailed Student’s t-test). E Immunostaining of YAP/TAZ (green), UEA1 (red), and DAPI (blue) in paraffin-embedded eyeball sections from non-diabetic control and PDR patients. Arrowheads indicate YAP/TAZ localization in EC nuclei. F Quantification of YAP/TAZ fluorescence intensity within vessels (UEA1+ areas) from non-diabetic controls and PDR patients (n = 4/4 individuals). Mean ± SEM, p = 0.008 (two-tailed Student’s t-test). G Relative expression of CTGF and CYR61 in retinal microvascular ECs from PDR patients compared to non-diabetic controls, analyzed from the Omnibus Database (GSE94019) (n = 4/9 individuals). Mean ± SEM, p = 0.0268 (two-tailed Student’s t-test). H Immunostaining of YAP/TAZ (green) and CD31 (red) in sagittal retinal sections from STZ-induced diabetic mice at different stages and age-matched controls. I Quantification of YAP/TAZ fluorescence intensity in CD31+ areas (n = 3/3 mice per time point). Mean ± SEM, p-values = 0.0175, 0.0008, 0.0007 (two-tailed Student’s t-test). J Immunostaining of YAP/TAZ (green) and IsoB4 (red) in sagittal retinal sections from OIR model mice and age-matched controls. K Quantification of YAP/TAZ fluorescence intensity in IsoB4+ areas (n = 6/6 mice). Mean ± SEM, p < 0.0001 (two-tailed Student’s t-test). *p < 0.05; **p < 0.01. Scale bars: 5 µm in (A, C); 30 µm in (E, H, J). Source data are provided as a Source Data file.
Fig. 6
Fig. 6. Endothelial YAP/TAZ is essential for regulating pathological retinal angiogenesis.
A Schematic showing the generation of EC-specific Yap/Taz knockout mice. B Intravitreal 4-OHT injection and STZ administration in EC-specific Yap/Taz knockout (Yap/TaziΔEC) and littermate control (Yap/TazWT) mice. C Desmin (Cyan) and CD31 (magenta) staining in retinas of Yap/TazWT and Yap/TaziΔEC mice, 9 weeks post-STZ onset. Arrowheads indicate vessels lacking mural cell coverage. D Quantification of mural cell coverage (%) within CD31+ vessel areas from (C) (n = 6/6 mice). Mean ± SEM, p = 0.0484 (two-tailed Student’s t-test). E Retinal trypsin digestion showing acellular capillaries in Yap/TazWT and Yap/TaziΔEC STZ mice. Black arrowheads indicating acellular capillaries. F Acellular capillaries (Ac-Cap) in (E), based on 3 random fields per retina (n = 6/6 retinas). Mean ± SEM, p = 0.0484 (two-tailed Student’s t-test). G Collagen lV (green) and CD31 (red) staining in retinas, 9 weeks post-STZ-induced diabetes. Arrowheads indicate Ac-Caps. H Quantification of CollV+CD31- sleeves in (G) (15 random fields per retina, n = 3/3 mice). Mean ± SEM, p = 0.0479 (two-tailed Student’s t-test). I Schematic of Tamoxifen injection in the OIR model. J IsoB4 staining of retinal vasculature in P17 OIR retinas from Yap/TazWT and Yap/TaziΔEC pups. K, L Quantification of neovascularization and avascular areas in Yap/TazWT and Yap/TaziΔEC OIR retinas (n = 7/8 pups). Mean ± SEM, p < 0.0001 in (K), p = 0.9361 in (L) (two-tailed Student’s t-test). M, N Images and quantification of blood island areas in P17 OIR retinas (n = 10/14 pups). Mean ± SEM, p = 0.0013 (two-tailed Student’s t-test). O, P Images and quantification of TER119+ red blood cell (RBC) (Cyan) leakage in flat-mounted retinas of OIR pups (n = 8/9 pups). Mean ± SEM, p = 0.0003 (two-tailed Student’s t-test). Q, R Images and quantification of extravasated FITC-dextran (70 kDa) (green) in IsoB4-stained (red) flat-mounted retinas (n = 5/8 pups). Mean ± SEM, p = 0.001 (two-tailed Student’s t-test). *p < 0.05; **p < 0.01; ***p < 0.001. Scale bars: 100 µm in (C), 50 µm in (G), 500 µm in (J, O, Q), and 1 mm in (M). Source data are provided as a Source Data file.
Fig. 7
Fig. 7. YAP-T383/YAP-S397 regulatory axis is essential in O-GlcNAcylation-modulated pathological retinal angiogenesis.
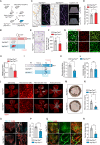
A Schematic showing AAV-BR1 injection in the OIR model. AAV-BR1 was injected retro-orbitally at P7, followed by tamoxifen intraperitoneal injections at P12, P13, P14, and P16 in Yap/TaziΔEC pups. B IsoB4-stained images of retinal vasculature in OIR retinas from AAV-BR1-injected Yap/TaziΔEC pups at P17. C Quantification of retinal neovascularization area in (B) (n = 6/6/7 pups). Values are mean ± SEM, p = 0.0023, p = 0.0097 (one-way ANOVA with Tukey’s multiple comparisons test). D Schematic of AAV-BR1 injection in the STZ model. One week after STZ onset, 4-OHT was injected intravitreally into Yap/TaziΔEC mice, with AAV-BR1 injected into the tail vein. Retinas were harvested after 8 weeks for analysis. E Desmin (Cyan) and CD31 (magenta) staining of retinas from AAV-BR1-injected Yap/TaziΔEC mice. Arrowheads show vessels lacking mural cell coverage. F Quantification of mural cell coverage (%) in CD31+ vessel areas from (E) (n = 6/6/5 mice). Values are mean ± SEM, p = 0.003, p = 0.0424 (one-way ANOVA with Tukey’s test). G Schematic of AAV-BR1 injection in STZ model. 4-OHT was intravitreally injected into OgtWT and OgtiΔEC mice one week after STZ onset, with AAV-BR1 injected intravenously. Retinas were harvested after 8 weeks. H Desmin (Cyan) and CD31 (magenta) staining of retinas from AAV-BR1-injected OgtWT and OgtiΔEC mice. Arrowheads indicate vessels lacking mural cell coverage. I Quantification of mural cell coverage (%) in CD31+ vessel areas from (H) (n = 8/7/7/9/8 mice). Values are mean ± SEM, p = 0.0051, p = 0.0002, p < 0.0001 (one-way ANOVA with Tukey’s test). J Schematic of AAV-BR1 injection in OIR model, with AAV-BR1 injected retro-orbitally at P7 into OgtWT and OgtiΔEC pups. K Representative IsoB4-stained images of retinal vasculature from AAV-BR1-injected OgtWT and OgtiΔEC OIR pups. L Quantification of retinal neovascularization in AAV-BR1-injected OgtWT and OgtiΔEC pups (n = 5/6/6/6/5 pups). Values are mean ± SEM, p = 0.0059, p = 0.0018, p < 0.0001 (one-way ANOVA with Tukey’s test). *p < 0.05; **p < 0.01; ***p < 0.001. Scale bars: 500 µm in (B, K), 100 µm in (E, H). Source data are provided as a Source Data file.
Fig. 8
Fig. 8. Exosome-based delivery of YAP/TAZ inhibitor alleviates vascular dysfunction in DR.
A Schematic showing the preparation of EXOSuper-TDU, where Super-TDU is anchored to EC-derived exosomes using the CP05 peptide. B Schematic of Super-TDU and EXOSuper-TDU administration in the STZ model. PBS, Super-TDU, or EXOSuper-TDU were injected retro-orbitally one week after STZ onset, with vascular phenotypes analyzed 8 weeks later. C Desmin (Cyan) and CD31 (magenta) staining of retinas from STZ mice treated as indicated. Arrowheads indicate vessels lacking mural cell coverage. D Quantification of mural cell coverage (%) in CD31+ vessels from (C) (n = 6 mice per group). Mean ± SEM, p = 0.0319, p < 0.0001, p = 0.0217 (one-way ANOVA with Tukey’s test). E Retinal trypsin digestion showing acellular capillaries in STZ mice. Black arrowheads indicate acellular capillaries. F Quantification of acellular capillaries (Ac-Cap) in (E). Three random fields per retina were quantified (n = 6 mice per group). Mean ± SEM, p = 0.0108, p < 0.0001, p = 0.0177 (one-way ANOVA with Tukey’s test). G Schematic of Super-TDU treatment in the OIR model. PBS, Super-TDU, or EXOSuper-TDU were injected retro-orbitally at P12, and retinas were harvested at P17. H IsoB4-stained images of retinal vasculature in OIR retinas from treated pups. I, J Quantification of neovascularization and avascular areas in OIR retinas (n = 6/6 pups). Mean ± SEM, p = 0.0349, p = 0.0002, p = 0.0499 (one-way ANOVA with Tukey’s test). K, L Images of the retinal cup inner surface and quantification of blood island area (n = 8/7/7 pups). Mean ± SEM, p = 0.003, p < 0.0001, p = 0.0374 (one-way ANOVA with Tukey’s test). M, N Confocal images and quantification of extravasated FITC-dextran and IsoB4 in flat-mounted OIR retinas. FITC-dextran+ and IsoB4 areas indicate vessel leakage (n = 6 pups per group). Mean ± SEM, p = 0.0487, p < 0.0001, p = 0.0074 (one-way ANOVA with Tukey’s test). *p < 0.05; **p < 0.01; ***p < 0.001. Scale bars: 100 µm (C), 50 µm (E), 1 mm (K), 500 µm (H, M). Source data are provided as a Source Data file.
Fig. 9
Fig. 9. YAP/TAZ regulates glucose metabolism and O-GlcNAcylation in ECs.
A HRCECs were transfected with siCtrl or siYAP/TAZ and cultured in 25 mM glucose medium for 48 h. Total RNA was then harvested for RNA-seq. B Network visualization of GO terms for genes downregulated by YAP/TAZ knockdown. C Schematic representation of the hexosamine biosynthetic pathway (HBP), with key enzymes and O-GlcNAcylation processes highlighted in yellow boxes. D Heatmap of RNA-seq data from (A), displaying expression levels of key enzymes involved in HBP and O-GlcNAcylation. E Relative expression levels of key enzymes in the HBP and O-GlcNAcylation in retinal microvascular ECs from PDR patients compared to non-diabetic controls. Data from GSE94019 (n = 4/9 individuals). Mean ± SEM, p = 0.0466, p = 0.0234 (multiple unpaired Student’s t-tests). F Western blot and quantification of overall O-GlcNAc-modified proteins in HRCECs transfected with siCtrl or siYAP/TAZ, followed by infection with Ad-Flag-YAP/TAZ and cultured in 25 mM glucose medium (n = 3 independent experiments). Mean ± SEM, p = 0.036, p = 0.0341 (one-way ANOVA with Tukey’s test). G, H O-GlcNAc (green) and CD31 (red) staining with DAPI (blue) in frozen sections of eyeballs from Yap/TazWT and Yap/TaziΔEC mice 9 weeks after the onset of STZ-induced diabetes (n = 8/6 mice). Mean ± SEM, p = 0.002 (two-tailed Student’s t-test). I, J O-GlcNAc and IsoB4 (red) staining with DAPI (blue) in frozen sections of eyeballs from Yap/TazWT and Yap/TaziΔEC OIR pups at P17 (n = 4/5 pups). Mean ± SEM, p = 0.0084 (two-tailed Student’s t-test). K The proposed working model demonstrates the role of O-GlcNAcylation in regulating vascular dysfunction in DR through the modulation of YAP/TAZ. Exposure to high glucose or hypoxia results in O-GlcNAcylation of YAP/TAZ at site T383, which impedes phosphorylation at S397, leading to the stabilization and activation of YAP/TAZ. This modification ultimately contributes to vascular dysfunction in DR. Additionally, YAP/TAZ also exerts regulatory control over EC metabolism and protein O-GlcNAcylation, establishing a reciprocal interplay between the Hippo signaling pathway and protein O-GlcNAcylation. *p < 0.05; **p < 0.01. Scale bars: 30 µm in (G) and (I).

References

    1. Ogurtsova, K. et al. IDF diabetes atlas: global estimates for the prevalence of diabetes for 2015 and 2040. Diabetes Res. Clin. Pract.128, 40–50 (2017). - PubMed
    1. Antonetti, D. A., Klein, R. & Gardner, T. W. Diabetic retinopathy. N. Engl. J. Med.366, 1227–1239 (2012). - PubMed
    1. Duh, E. J., Sun, J. K. & Stitt, A. W. Diabetic retinopathy: current understanding, mechanisms, and treatment strategies. JCI Insight2, e93751 (2017). - PMC - PubMed
    1. Borrelli, E. et al. Long-term visual outcomes and morphologic biomarkers of vision loss in eyes with diabetic macular edema treated with anti-VEGF Ttherapy. Am. J. Ophthalmol.235, 80–89 (2022). - PubMed
    1. Grunwald, J. E. et al. Risk of geographic atrophy in the comparison of age-related macular degeneration treatments trials. Ophthalmology121, 150–161 (2014). - PMC - PubMed

Publication types

MeSH terms

Substances

Associated data