. 2024 Nov 13;15(1):9837.
doi: 10.1038/s41467-024-54003-9.

Pharmacogenomic screening identifies and repurposes leucovorin and dyclonine as pro-oligodendrogenic compounds in brain repair

Affiliations

Pharmacogenomic screening identifies and repurposes leucovorin and dyclonine as pro-oligodendrogenic compounds in brain repair

Jean-Baptiste Huré et al. Nat Commun. .

Erratum in

Abstract

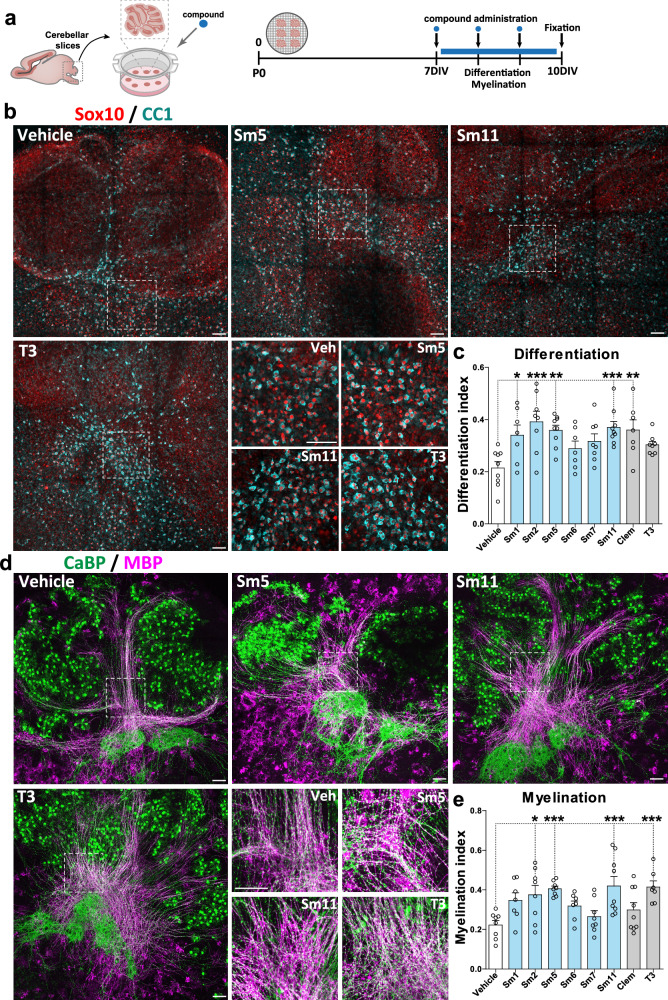
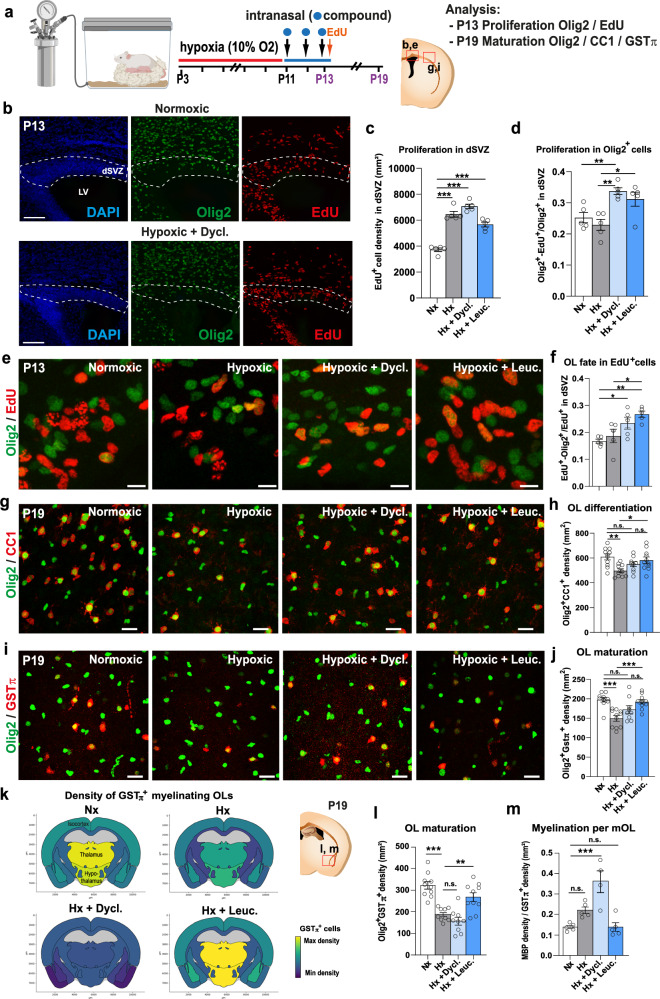
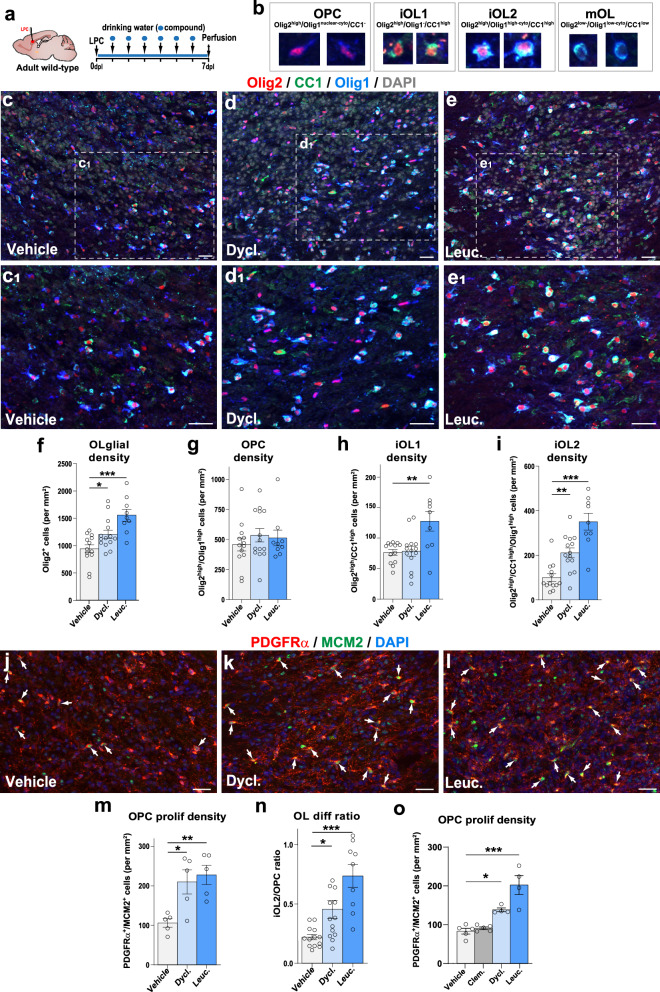
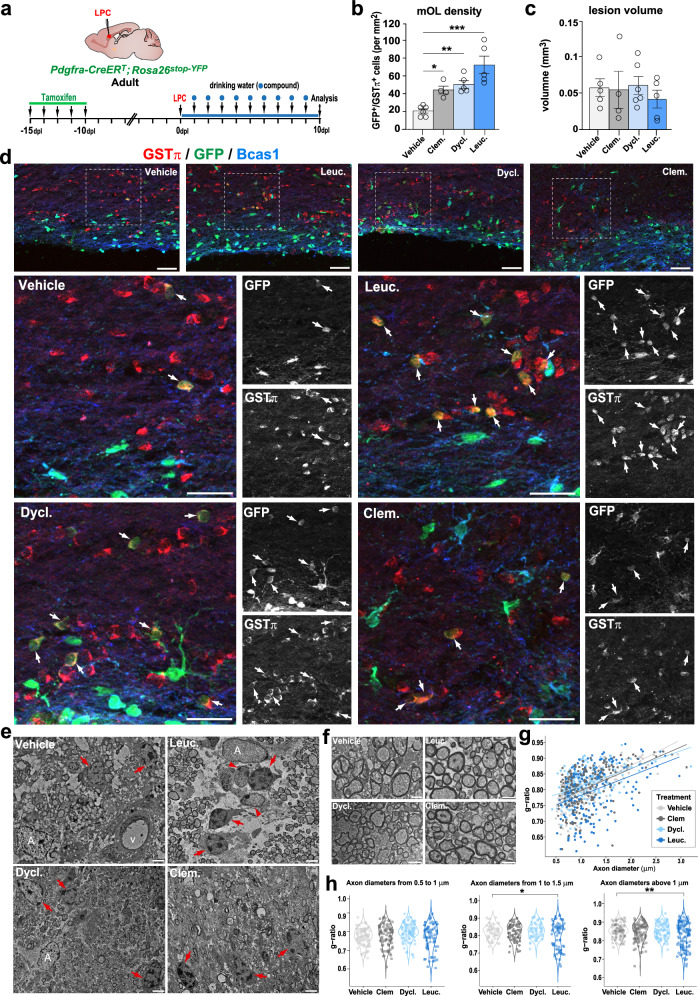
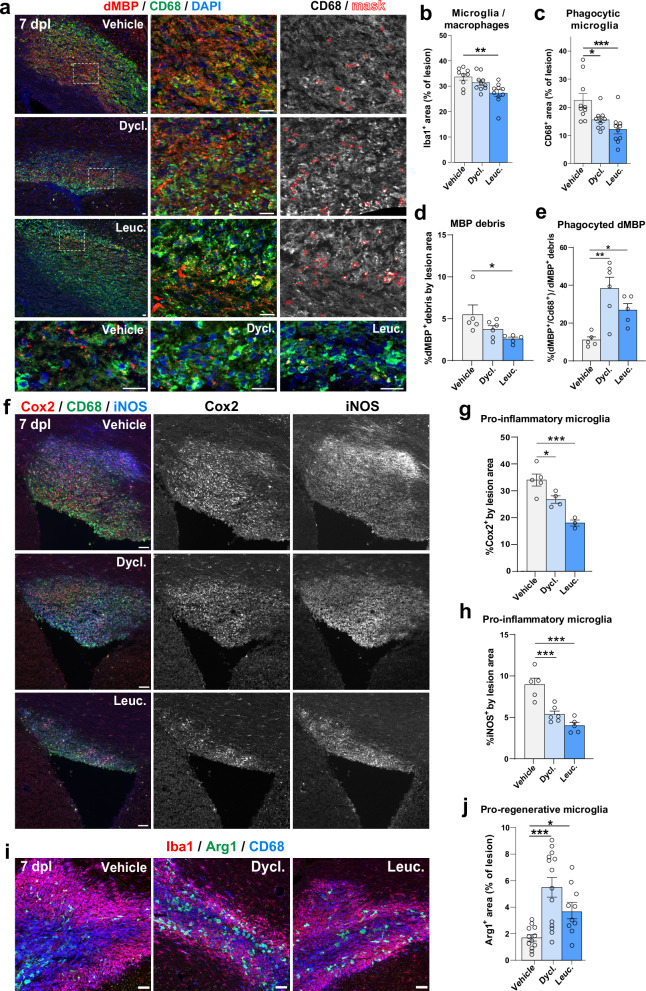
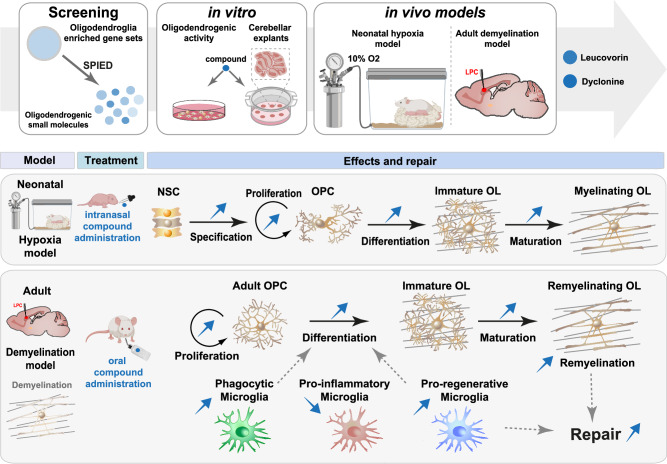
Oligodendrocytes are critical for CNS myelin formation and are involved in preterm-birth brain injury (PBI) and multiple sclerosis (MS), both of which lack effective treatments. We present a pharmacogenomic approach that identifies compounds with potent pro-oligodendrogenic activity, selected through a scoring strategy (OligoScore) based on their modulation of oligodendrogenic and (re)myelination-related transcriptional programs. Through in vitro neural and oligodendrocyte progenitor cell (OPC) cultures, ex vivo cerebellar explants, and in vivo mouse models of PBI and MS, we identify FDA-approved leucovorin and dyclonine as promising candidates. In a neonatal chronic hypoxia mouse model mimicking PBI, both compounds promote neural progenitor cell proliferation and oligodendroglial fate acquisition, with leucovorin further enhancing differentiation. In an adult MS model of focal de/remyelination, they improve lesion repair by promoting OPC differentiation while preserving the OPC pool. Additionally, they shift microglia from a pro-inflammatory to a pro-regenerative profile and enhance myelin debris clearance. These findings support the repurposing of leucovorin and dyclonine for clinical trials targeting myelin disorders, offering potential therapeutic avenues for PBI and MS.


Conflict of interest statement

Competing interests Jean-Baptiste Hure, Carlos Parras, Olivier Raineateau, and Louis Foucault are inventors in the patent entitled ‘Organic molecules for 1312 treating myelin pathologies’, published on September 28th, 2023 (WO2023180474) that is based on most of the data published in this study. Patent applicants: ICM - Paris Brain Institute, INSERM, CNRS, AAPHP, Sorbonne Université, Université Claude Bernard Lyon 1. The other authors declare no competing interests.

Figures

Fig. 1
Fig. 1. In-silico strategy to generate oligodendroglial-enriched gene sets and their use in pharmacogenomics to identify new hub genes.
a Use of both bulk and single-cell RNA-seq datasets from different brain cell types and oligodendroglial stages, together with the transcriptomic comparison of dorsal (gliogenic) vs. ventral (neurogenic) neonatal forebrain progenitors to identify gene sets enriched either in progenitors, more mature cells, or both, depicted as circles indicating the number of genes. b Heat map showing the differential expression of the 3372 genes set in different neural cell types. c Top gene ontology biological processes related to the 3372 genes. d Schematics representing the interrogation of the SPIED platform with the 3372 genes to identify hub genes correlated (positive hub genes) or anti-correlated (negative hub genes). Note that most of the positively correlated hub genes are included in the 3372 genes set, whereas only a few of the anti-correlated ones. e, f Heatmap visualization of the expression of correlated- (e) and anticorrelated-hub genes (f) in different brain cells indicates that most of the correlated genes are expressed in oligodendroglia while many anticorrelated hub genes are enriched in microglia, astrocytes, and endothelial cells.
Fig. 2
Fig. 2. Expert curation ranking and selection of small molecules.
a Table illustrating the scoring of selected genes for their regulation in different oligodendrogenesis processes (positive in green or negative in red), based on bibliographic curation of functional studies. b Curated genes subsets promoting (green) or inhibiting (red) each oligodendrogenesis process. c Using both curated and oligodendroglial-enriched gene sets to interrogate the SPIED platform and generate a list of small molecules/compounds regulating their expression. Shared compounds were then ranked by the scoring of their curated gene signatures, in order to select 40 compounds with pro-oligodendrogenic transcriptional activity. d Table listing the top 11 small molecules (Sm) alongside two positive controls (T3 and clemastine) exemplifying some of their curated gene targets and their corresponding scoring values (green: positive, red: negative) for each oligodendrogenesis process. e, f Barplots illustrating the score of selected compounds in the differentiation (e) and myelination (f) processes, respectively. g Table and (h) schematics illustrating the pharmacological filtering criteria (BBB permeability, mutagenicity, reprotoxicity, cardiotoxicity, etc.) used to select the top 11 compounds. The green-to-red gradient highlights the probability values from positive to negative activity on each pharmacological parameter. BBB: Blood-Brain-Barrier, hERG: ether-a-go-go related gene potassium channel.
Fig. 3
Fig. 3. Pro-oligodendrogenic activity of small molecules in neonatal neural progenitor cultures.
a Schematics representing the protocol of neurosphere-derived neural progenitor cell cultures and small molecule administration. b Representative images illustrating the immunodetection of neurons (ß-III-tubulin+ cells, red), astrocytes (GFAP+ cells, blue), and oligodendroglia (PDGFRα+ OPCs and CNP+ OLs, green) in vehicle vs. Sm11 treated cultures after 2 days of differentiation. Note the increase of oligodendroglial cells in the Sm11-treated condition. cg Quantifications showing the increase of oligodendroglial cells (PDGFRα+ and CNP+ cells) in cultures treated with each of the selected compounds, but not upon T3 and clemastine treatment (c), no changes in the number of astrocytes (GFAP+ cells, d), neuronal cells (β-III-tubulin+ cells, e), or in cell density (f), with an increase in cell differentiation (more cells labeled by any of the markers and less DAPI-only cells) for most selected compounds (g). h Representative images of the immunofluorescence for Sox10high (iOLs, green) and DAPI (blue) illustrating the increase in treated cultures (Sm5) compared to vehicle cultures after 2 days of differentiation. i Quantification showing the increase of Sox10high cells in most compound-treated cultures, including T3. Data was obtained from at least 3 independent experiments, and it is presented as mean ± SEM of fold change normalized to vehicle. Each dot represents a biological replication. Statistical analysis used linear mixed-effects models followed by Type II Wald chi-square tests. *p < 0.05; **p < 0.01; ***p < 0.001. Exact p-values, sample sizes (represented in the dot plots), and source data are provided in the Source Data file and in Supplementary Data 2 - Methods Table 3. Scale bars: (b), 20 μm; (h), 50 μm.
Fig. 4
Fig. 4. Cell-autonomous effect of selected compounds in OPC differentiation.
a Schematic representing the protocol of OPC purification, culture, and compound treatment. b Representative images illustrating the immunodetection of OPCs (PDGFRα+ cells, magenta) and differentiating OLs (MBP+ cells, green). c, d Quantification of the number of OPCs (PDGFRα+ cells, c) and number of OLs (MBP+ cells, d) per mm2 in different treated conditions, showing that most compounds present a significant increase in the number of differentiating OLs compared to the vehicle treatment. Data are presented as mean +/− SEM from 3 independent experiments. Each dot represents a biological replication. N = 3. Statistics were performed using One-way ANOVA to compare the cell counts across different treatments, followed by Dunnett’s test to compare each treatment with Vehicle (control group). *p < 0.05; **p < 0.01; ***p < 0.001. Exact p-values and source data are provided in the Source Data file. Scale bars: 20 μm.
Fig. 5
Fig. 5. Selected compounds promote oligodendrocyte differentiation and myelination ex vivo in cerebellar explant cultures.
a Schematic illustrating the protocol of the cerebellar explant culture model and timing of compound administration. b Images of explants illustrating the effects of compounds (Sm5, Sm11, and T3) on oligodendrocyte differentiation by immunodetection of Sox10+ oligodendroglia (red) and CC1+ OLs (blue). c Quantification of the differentiation index (SOX10+CC1+/SOX10+ cells) shows an increase following treatment with Sm1, Sm2, Sm5, Sm11, and clemastine compounds. d Immunofluorescence of explants illustrating compound effects (Sm5, Sm11, and T3) on myelination of Purkinje axons by immunodetection of CaBP+ axons/cells (green) and MBP (pink). e Quantification of the myelination index (surface MBP+ CaBP+/ surface CaBP+) showing an increase following treatment with Sm2, Sm5, Sm11, and T3 compounds. Data are presented as mean ± SEM. Each dot represents a biological replication. Statistical unpaired bilateral Wilcoxon Mann Whitney test. *p < 0.05; **p < 0.01; ***p < 0.001. Exact p-values, sample sizes (represented in the dot plots), and source data are provided in the Source Data file and in Supplementary Data 2 - Methods Table 3. Scale bars: 100 μm.
Fig. 6
Fig. 6. Dyclonine and leucovorin promote oligodendroglial regeneration in a mouse model of preterm birth brain injury.
a Schematic illustrating the workflow used to assess the capacity of dyclonine and leucovorin to promote OPC proliferation and rescue OL maturation following neonatal chronic hypoxia. b Images of dorsal SVZ at P13, delimited by DAPI counterstaining, showing Olig2 and EdU immunodetection in brain sections of control animals (i.e., normoxic) and following hypoxia and dyclonine treatment. c Quantification of EdU+ cell density (i.e., proliferative cells) in the dorsal SVZ at P13, illustrating the increase in proliferation observed following hypoxia with or without treatment. df Olig2/EdU immunodetection and corresponding quantifications showing that dyclonine and leucovorin increase (d) the ratio of proliferative OPCs (Olig2+EdU+ cells) and (f) the OL fate of EdU+ cells in the dorsal SVZ at P13. g Olig2 and CC1 immunodetection and quantification (h) showing that dyclonine and leucovorin rescue the reduced density of differentiating OLs (CC1+ cells) induced by neonatal chronic hypoxia within the cortex at P19, compared to the density found in the normoxic group, with leucovorin reaching statistical difference with the hypoxic group. i Olig2 and GSTπ immunodetection and quantification (j) showing that only leucovorin rescues the density of myelinating OLs (GSTπ+ cells) following hypoxia within the cortex at P19. k Heatmap representations depicting quantifications of Olig2+/GSTπ+ cell density in distinct regions of P19 coronal brain sections. Note the reduced density induced by hypoxia (Hx) in most brain regions with a pronounced effect in the thalamus and hypothalamus, compared to normoxic (Nx) control brains, and the rescue of Olig2+/GSTπ+ cell density following leucovorin (Hx + Leuc.) but not dyclonine (Hx + Dycl.) treatment. l Quantification of Olig2+/GSTπ+ cells in the hypothalamic lateral zone of P19 animals confirming that leucovorin, but not dyclonine, treatment rescues the reduced density of hypoxic animals. m Quantification of the ratio between MBP immunodetection (shown in Fig. 6 extended data f, g) and GSTπ+ cell density showing an increased myelination per mOL in dyclonine-treated animals. Dyc., dyclonine; Leuc., leucovorin; Data are presented as Mean ± SEM. Statistics were performed using One-way ANOVA to compare the cell counts across different treatments, followed by Dunnett’s test to compare each treatment with either Normoxia (Nx) or Hypoxia considered as control groups. Each dot represents a biological replication. *p < 0.05; **p < 0.01; ***p < 0.001, n.s., non-significant. Exact p-values, sample sizes (represented in the dot plots), and source data are provided in the Source Data file and in Supplementary Data 2 - Methods Table 3. scale bars: 100 µm in b, 10 µm in e; 20 µm in (g) and (i).
Fig. 7
Fig. 7. Dyclonine and leucovorin promote both OPC proliferation and differentiation in a mouse model of adult demyelination.
a Schematics illustrating the protocol for LPC demyelination in the corpus callosum, the timing of compound administration in drinking water and analysis. b Images illustrating the 4 oligodendroglial stages obtained combining Olig2/CC1/Olig1 immunofluorescence: OPCs (Olig2high/Olig1high), iOL1 (Olig2high /CC1high), iOL2 (Olig2high/CC1high/Olig1high) and mOLs (Olig2low/CC1low/Olig1low). ce1 Representative images of Olig2/CC1/Olig1 immunofluorescence in the lesion site (depicted by the high cellularity with DAPI) in control mice (c,c1, N = 13), dyclonine-treated (d,d1, N = 14), and leucovorin-treated (e,e1, N = 9) representative of the quantifications shown in (fi). (fi) Quantification showing the increase in the density of Olig2+ oligodendroglia in dyclonine- and leucovorin-treated lesions (f), no changes in OPC density (g), the increase in iOL1 density only in leucovorin treated lesions (h), and the increased iOL2 density in dyclonine- and leucovorin-treated lesions (i). (jl) Representative images showing the increase in proliferation (Mcm2+ cells, green) of OPCs (PDGFRα+ cells, red) in the lesion area in dyclonine-treated (k) and leucovorin-treated (l) compared to vehicle controls (j) (N = 5 per group). The white arrow indicates proliferating OPCs (PDGFRα+/Mcm2+ cells). m Quantification of the proliferating OPC density showing a 2-fold increase in the compound-treated groups. n Quantification of the OL differentiation ratio showing 2 to 3 times differentiation increase in dyclonine- and leucovorin-treated lesions, respectively. o Quantification of the proliferating OPC density in a replicated experiment comparing with clemastine, showing that contrary to clemastine, both dyclonine and leucovorin increase the OPC proliferation density in the lesion. Dycl., dyclonine; Leuc., leucovorin; Clem., clemastine. Data are presented as Mean ± SEM. Each dot corresponds to a biological replicate. Statistics were performed using One-way ANOVA to compare the cell counts across different treatments, followed by Dunnett’s test to compare each treatment with Vehicle (control group). *p < 0.05; **p < 0.01; ***p < 0.001. Exact p-values, sample sizes (represented in the dot plots), and source data are provided in the Source Data file and in Supplementary Data 2 - Methods Table 3. Scale bars: 20 μm.
Fig. 8
Fig. 8. Leucovorin and dyclonine accelerate oligodendrocyte formation and remyelination in a mouse model of adult demyelination.
a Schematics illustrating the protocol used for tracing OPCs and newly formed OLs by YFP-reporter induction prior to LPC demyelination by tamoxifen mediated Cre-recombination of a stop cassette in Pdgfra-CreERT; Rosa26stop-YFP mice, followed by compounds’ administration in the drinking water and analysis at 10 days post-lesion (dpl). b Quantification of the density of newly formed (GFP+) myelinating OLs (GSTπ+), showing that dyclonine and leucovorin, like clemastine, increase the generation of remyelinating OLs compared to vehicle. c Quantification of the lesion volume indicating no major reduction at 10 dpl in treated animals. d Representative images of adult-generated YFP+ immature OLs (Bcas1+ cells, blue) or myelinating OLs (GSTπ+ cells, red). e Electron microscopy images at 10 dpl illustrating the increase in mOLs (red arrows) identified by their typical ultrastructural traits (round- or oval-shape nucleus having densely packed chromatin and processes wrapping around axons presenting compact myelin traits) in compounds’ treated lesions compared to controls (Vehicle). Note that leucovorin-treated lesions have more frequent iOLs (arrowheads) in the lesion area, characterized by showing less densely packed chromatin. f Representative micrographs illustrating remyelinated axons in the lesion area in different treatments. g Scatter plot representing the quantification of myelin sheath thickness (g-ratio) per axon diameter in the lesion area of vehicle- (light gray), clemastine- (gray), dyclonine- (light blue), and leucovorin-treated (blue) animals indicating a tendency to increase myelin thickness (lower g-ratios) in compound-treated animals compared to vehicle, with leucovorin-treated animals showing the strongest effect. h Violin plots quantifications of g-ratios in axons with different thicknesses indicating a significant decrease in g-ratio (thicker myelin) of axons above one micrometer in the lesion area of leucovorin-treated animals. A, astrocytes. V, vessel. Clem., clemastine; Dycl., dyclonine; Leuc., leucovorin. Data are presented as Mean ± SEM. Each dot corresponds to a biological replicate. Statistics were performed using One-way ANOVA to compare the cell counts across different treatments, followed by Dunnett’s test to compare each treatment with Vehicle (control group). *p < 0.05; **p < 0.01; ***p < 0.001. Exact p-values, sample sizes (represented in the dot plots), and source data are provided in the Source Data file and in Supplementary Data 2 - Methods Table 3. Scale bars: (d) 20 μm; (e, f) 1 μm.
Fig. 9
Fig. 9. Leucovorin and dyclonine accelerate myelin debris clearance and transition from pro-inflammatory to pro-regenerative microglial profiles in a mouse model of adult demyelination.
a Representative images of the lesion territory immunodetection myelin debris with MBP (dMBP, red) and phagocytic microglia with CD68 (green), showing increased dMBP signal inside CD68+ cells in dyclonine- and leucovorin-treated lesions (yellow dots) and vs. more dMBP outside CD68+ cells (red dots) in vehicle-treated lesions at 7 days post-lesion (dpl). The right panels illustrate the mask of automatic quantification for CD68 and dMBP colocalization (red labels). The bottom panels are higher magnification images for dMBP dot visualization in different treated lesions. be Barplots and dot plots representing the quantification in the lesion of Iba1+ microglial area (b), CD68+ phagocytic area (c), myelin debris as a percentage of dMBP area (d), and phagocyted myelin debris as the percentage of dMBP area inside CD68+ cells from the total dMBP area (e). Note the strong increase of phagocyted myelin debris within dyclonine- and leucovorin-treated lesions. f Representative pictures showing immunodetection of microglia/macrophages (CD68+ cells, green) in the lesion area expressing inflammatory markers (Cox2 in red, and iNOS in blue). g, h Quantification of the percentage of lesion area labeled by Cox2 (g) and iNOS (h) immunofluorescence, in dyclonine-treated (N = 5) and leucovorin-treated (N = 4) mice compared to vehicle (N = 5). Note the decrease in the pro-inflammatory profiles of microglia in leucovorin- and dyclonine-treated conditions. i Representative pictures showing immunodetection of microglia/macrophages (Iba1+ cells, red) in the lesion area presenting phagocytic (CD68+ cells, blue) and pro-regenerative (Arg1+ cells, green) profiles. Note the increase in the pro-regenerative profiles of microglia in leucovorin and dyclonine-treated conditions. j Histograms representing the density of pro-regenerative microglia, in dyclonine-treated and leucovorin-treated mice compared to vehicle. Data are presented as Mean ± SEM. *p < 0.05; **p < 0.01; ***p < 0.001. Statistics were performed using One-way ANOVA to compare the cell counts across different treatments, followed by Dunnett’s test to compare each treatment with Vehicle (control group). Exact p-values, sample sizes (represented in the dot plots), and source data are provided in the Source Data file and in Supplementary Data 2 - Methods Table 3. Scale bars: 20 μm.
Fig. 10
Fig. 10. Summary of the study strategy and main findings.
Schematics of the pharmacogenomic approach leading to the identification of small bioactive molecules (compounds) with potential pro-oligodendrogenic activity, followed by the in vitro validation of the top compounds using neural and oligodendrocyte progenitor cell (OPC) cultures as well as organotypic cerebellar explants. The therapeutic efficacy of the top two compounds, leucovorin and dyclonine, both approved by the Food and Drug Administration (FDA), was assessed in vivo using two clinically relevant mouse models of myelin pathologies. In the neonatal hypoxia mouse model, mimicking some aspects of preterm brain injury, both leucovorin and dyclonine promoted neural stem cell (NSC) differentiation into OPCs and OPC proliferation, with leucovorin additionally restoring the density of myelinating OLs found in normoxic conditions. In an adult focal de/remyelination mouse model of multiple sclerosis, both compounds significantly improved lesion repair in adult mice by promoting OPC differentiation while preserving the pool of OPCs, and by accelerating myelin debris clearance and shifting microglia from pro-inflammatory to pro-regenerative profiles.

References

    1. Harrison, M. S. & Goldenberg, R. L. Global burden of prematurity. Semin. Fetal Neonatal Med.21, 74–79 (2016). - PubMed
    1. Luu, T. M., Rehman Mian, M. O. & Nuyt, A. M. Long-term impact of preterm birth: Neurodevelopmental and physical health outcomes. Clin. Perinatol.44, 305–314 (2017). - PubMed
    1. Walani, S. R. Global burden of preterm birth. Int. J. Gynecol. Obstet.150, 31–33 (2020). - PubMed
    1. Back, S. A. et al. Late oligodendrocyte progenitors coincide with the developmental Window of vulnerability for human perinatal white matter injury. J. Neurosci.21, 1302–1312 (2001). - PMC - PubMed
    1. Volpe, J. J. Brain injury in premature infants: a complex amalgam of destructive and developmental disturbances. Lancet Neurol.8, 110–124 (2009). - PMC - PubMed

Publication types

MeSH terms

LinkOut - more resources