. 2008 May 27;5(5):e114.
doi: 10.1371/journal.pmed.0050114.

Convergence of mutation and epigenetic alterations identifies common genes in cancer that predict for poor prognosis

Affiliations

Convergence of mutation and epigenetic alterations identifies common genes in cancer that predict for poor prognosis

Timothy A Chan et al. PLoS Med. .

Abstract

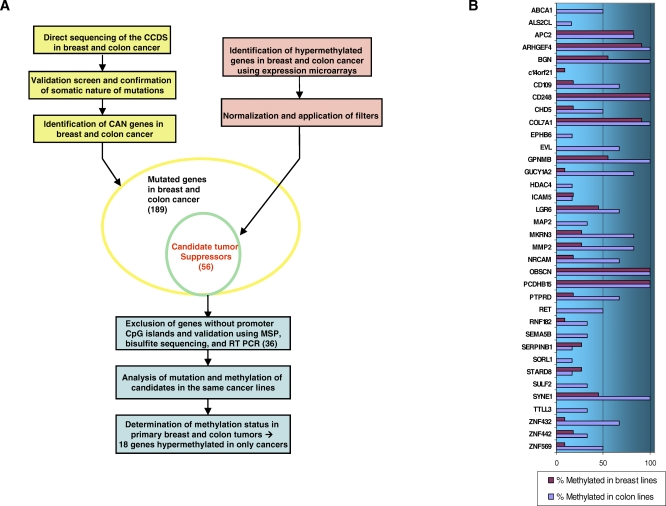
Background: The identification and characterization of tumor suppressor genes has enhanced our understanding of the biology of cancer and enabled the development of new diagnostic and therapeutic modalities. Whereas in past decades, a handful of tumor suppressors have been slowly identified using techniques such as linkage analysis, large-scale sequencing of the cancer genome has enabled the rapid identification of a large number of genes that are mutated in cancer. However, determining which of these many genes play key roles in cancer development has proven challenging. Specifically, recent sequencing of human breast and colon cancers has revealed a large number of somatic gene mutations, but virtually all are heterozygous, occur at low frequency, and are tumor-type specific. We hypothesize that key tumor suppressor genes in cancer may be subject to mutation or hypermethylation.

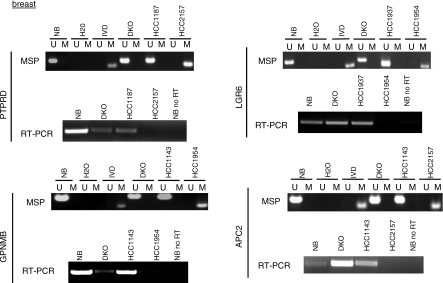
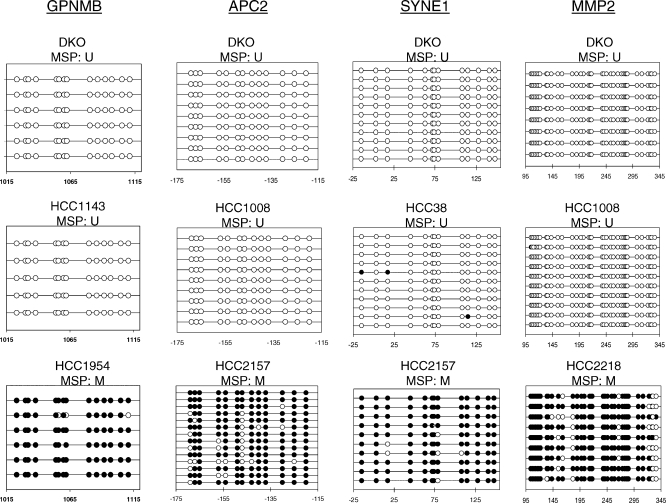
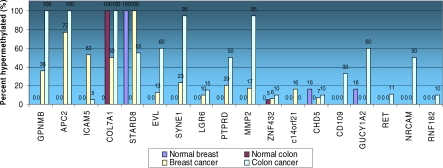
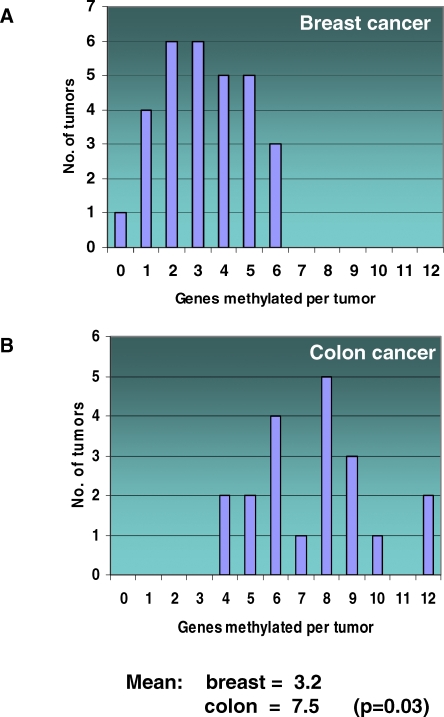
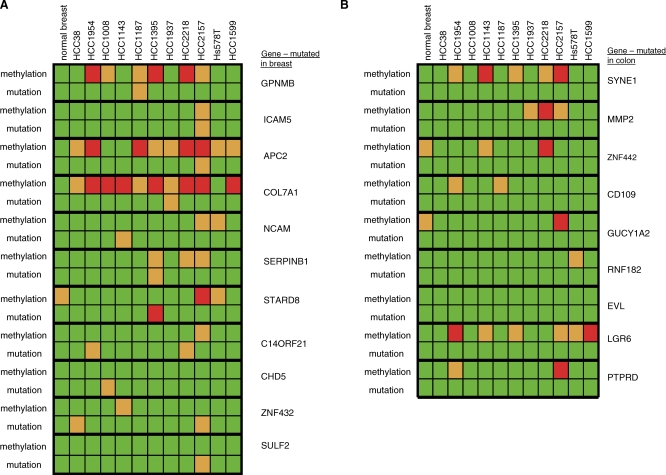
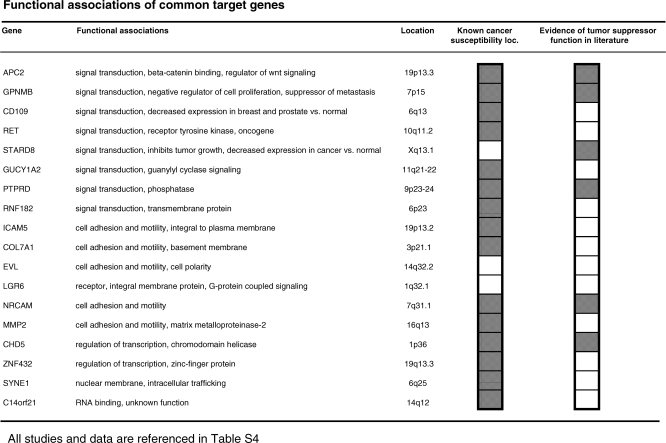
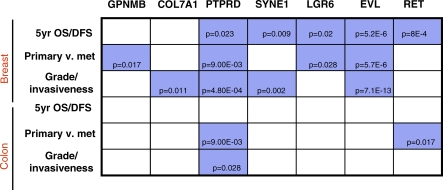
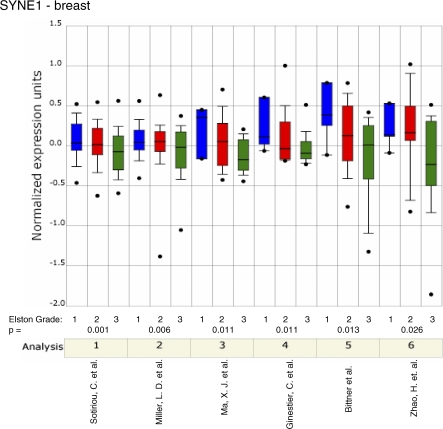
Methods and findings: Here, we show that combined genetic and epigenetic analysis of these genes reveals many with a higher putative tumor suppressor status than would otherwise be appreciated. At least 36 of the 189 genes newly recognized to be mutated are targets of promoter CpG island hypermethylation, often in both colon and breast cancer cell lines. Analyses of primary tumors show that 18 of these genes are hypermethylated strictly in primary cancers and often with an incidence that is much higher than for the mutations and which is not restricted to a single tumor-type. In the identical breast cancer cell lines in which the mutations were identified, hypermethylation is usually, but not always, mutually exclusive from genetic changes for a given tumor, and there is a high incidence of concomitant loss of expression. Sixteen out of 18 (89%) of these genes map to loci deleted in human cancers. Lastly, and most importantly, the reduced expression of a subset of these genes strongly correlates with poor clinical outcome.

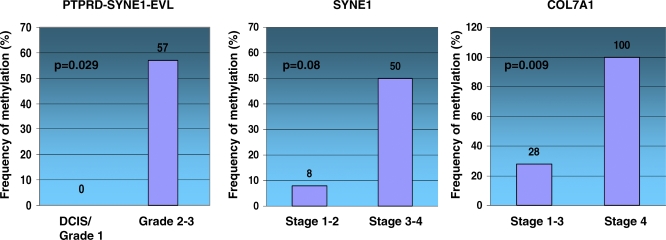
Conclusions: Using an unbiased genome-wide approach, our analysis has enabled the discovery of a number of clinically significant genes targeted by multiple modes of inactivation in breast and colon cancer. Importantly, we demonstrate that a subset of these genes predict strongly for poor clinical outcome. Our data define a set of genes that are targeted by both genetic and epigenetic events, predict for clinical prognosis, and are likely fundamentally important for cancer initiation or progression.


Conflict of interest statement

Competing Interests: The authors have declared that no competing interests exist.

Figures

Figure 1
Figure 1. Strategy to Identify Common Gene Targets of Mutation and Promoter Hypermethylation in Cancer
(A) Large-scale sequencing of breast and colon cancers identified 189 CAN genes as reported by Sjoblom et al. [7]. Candidate hypermethylated genes were identified via expression microarray analysis as described in the text. The cell lines used in the analyses were the breast cancer lines MCF7, MDA-MB-231, MDA-MB-468, and T-47D; and the colon cancer lines SW480, RKO, HCT116, Caco-2, Colo320, and HT-29. Filters were used as discussed in the text. Genes without promoter CpG islands were excluded. (B) Frequency of promoter methylation in the 36 CAN genes that are subject to hypermethylation. x-Axis denotes percent methylation. Methylation status was determined in the six colorectal cancer cell lines and in the 15 breast cancer lines described in the text (four lines used for microarray analysis plus 11 “Discovery Phase” breast cancer lines).
Figure 2
Figure 2. Common Gene Targets of Mutation and Hypermethylation in Breast Cancer
MSP and RT-PCR expression analysis of selected genes. Each set of MSP and expression analyses are labeled with the corresponding gene name. U denotes the unmethylated band, and M denotes the methylated band. In vitro methylated DNA (IVD) was used as a positive control for methylation. cDNA from normal breast (NB) and normal colon (NC) (Figure 3) was used to determine the expression of the genes in normal tissue. DKO corresponds to DNMT 1/3b double knockout HCT116 cells. All RT-PCR experiments were performed in parallel without reverse transcriptase as a control, and in all cases, no PCR product was generated (unpublished data). The control experiment performed without RT for normal breast is shown (NB no RT) for each gene. RT-PCR was performed for all cancer lines with beta-actin primers to control for the amount of cDNA (Figure 3, bottom).
Figure 3
Figure 3. Common Gene Targets of Mutation and Hypermethylation in Colon Cancer
MSP and RT-PCR expression analysis of selected genes. Each set of MSP and expression analyses are labeled with the corresponding gene name. U denotes the unmethylated band, and M denotes the methylated band. In vitro methylated DNA (IVD) was used as a positive control for methylation. cDNA from normal breast (NB) and normal colon (NC) was used to determine the expression of the genes in normal tissue. DKO corresponds to DNMT 1/3b double knockout HCT116 cells. All RT-PCR experiments were performed in parallel without reverse transcriptase as a control, and in all cases, no PCR product was generated (unpublished data). The control experiment performed without RT for normal colon is shown (NC no RT) for each gene. RT-PCR was performed for all cancer lines with beta-actin primers to control for the amount of cDNA.
Figure 4
Figure 4. Bisulfite-Sequencing Results
Location relative to the transcriptional start site is shown on the x-axis of each plot. Empty circles represent unmethylated CpGs, and black circles represent methylated CpGs. The corresponding results obtained with MSP are noted above each plot.
Figure 5
Figure 5. Frequency of Cancer-Specific Methylation of CAN Genes in Primary Breast and Colon Tumors
For each gene, results are shown in the following order: normal breast, normal colon, breast cancer, colon cancer.
Figure 6
Figure 6. Patterns of Mutation and Hypermethylation in Breast and Colon Cancer
(A) Frequency of cancer-specific hypermethylation of CAN genes. Data were generated from analysis of only the 18 genes demonstrating cancer-specific hypermethylation. Results for breast cancer. p-Value was calculated using Student's t-test. (B) Results for colon cancer.
Figure 7
Figure 7. Concomitant Mapping of Mutation and Methylation of CAN Genes in Human Breast and Colon Cancers
(A) Results for breast CAN genes. Gene names are listed at the right of the map. For each gene, the methylation and mutational status is shown for the 11 breast cell lines that were subject to large-scale sequencing described by Sjoblom et al. [7] and normal breast tissue. Green indicates no methylation or mutation detected. Red indicates complete methylation or homozygous mutation. Orange denotes heterozygous mutation or partial methylation. (B) Results for colon CAN genes. Data are presented in the same format as in (A).
Figure 8
Figure 8. Functional Associations of Common Target Genes
Functional associations of genes were determined using Gene Ontology (GO) groups and available literature. Evidence for tumor suppressor function was scored positive if reports in the literature show that the gene of interest can suppress growth of cancer cells in vitro, in vivo, or in murine genetic models, or modulate known tumor suppressor function. loc., location. Known cancer susceptibility location was scored positive if evidence exists in the literature for LOH or homozygous deletion in primary human tumors at the region shown using either standard genetic mapping or comparative genomic hybridization (CGH) analysis (shaded).
Figure 9
Figure 9. Hypermethylation of Selected “Common Target” Genes Predict for Poor Clinical Prognosis
Hypermethylation of selected common target genes by grade and stage in primary breast tumors. The first graph shows the frequency of methylation of at least one of the three genes listed in low- versus high-grade breast tumors. The second (SYNE1) and third (COL7A1) graphs show the frequency of methylation of the indicated genes in different stages of breast cancer. p-Values are adjusted using the Holm method.
Figure 10
Figure 10. Decreased Expression of Hypermethylated “Common Target” Genes Predict for Poor Clinical Prognosis
Summary of results from analysis of expression microarray data. p-Values from representative analyses for specific genes are shown. Blue indicates that a decrease in expression of the indicated gene is significantly associated with the following: overall survival or disease-specific survival less than 5 y, metastasis versus primary tumor, and/or increased grade or invasiveness. The p-value was calculated using the Student's t-test with adjustment for multiple testing as described previously [21].
Figure 11
Figure 11. Decreased Expression of Selected “Common Target” Genes Predict for Poor Clinical Prognosis
Box-plots showing decreased expression of candidate genes correlate with unfavorable clinical features. The y-axis represents normalized expression. Shaded boxes represent the interquartile range (25th–75th percentile). Whiskers represent the 10th–90th percentile. The bars denote the median.
Figure 12
Figure 12. SYNE1 Expression Is Decreased with Increasing Tumor Grade in Breast Carcinoma
Representative data are shown across multiple independently published microarray studies as indicated. p-Values for correlation are shown below. References refer to those listed in Table S2.
Figure 13
Figure 13. EVL Expression Is Decreased with Increasing Tumor Grade in Breast Carcinoma
Representative data are shown across multiple independently published microarray studies as indicated. p-Values for correlation are shown below. References refer to those listed in Table S2.

References

    1. Vogelstein B, Kinzler KW. Cancer genes and the pathways they control. Nat Med. 2004;10:789–799. - PubMed
    1. Futreal PA, Coin L, Marshall M, Down T, Hubbard T, et al. A census of human cancer genes. Nat Rev Cancer. 2004;4:177–183. - PMC - PubMed
    1. Ponder BA. Cancer genetics. Nature. 2001;411:336–341. - PubMed
    1. Herman JG, Baylin SB. Gene silencing in cancer in association with promoter hypermethylation. N Engl J Med. 2003;349:2042–2054. - PubMed
    1. Jones PA, Baylin SB. The epigenomics of cancer. Cell. 2007;128:683–692. - PMC - PubMed

Publication types

Associated data