. 2013 Sep 26;4(6):1116-30.
doi: 10.1016/j.celrep.2013.08.022. Epub 2013 Sep 19.

Endocrine-therapy-resistant ESR1 variants revealed by genomic characterization of breast-cancer-derived xenografts

Affiliations

Endocrine-therapy-resistant ESR1 variants revealed by genomic characterization of breast-cancer-derived xenografts

Shunqiang Li et al. Cell Rep. .

Abstract

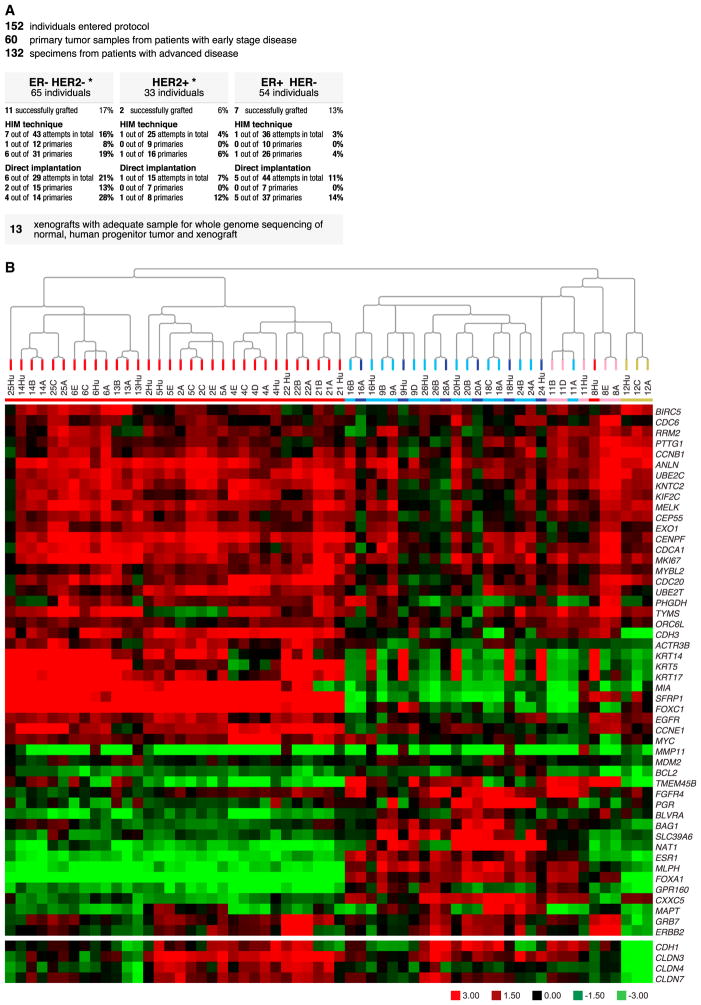
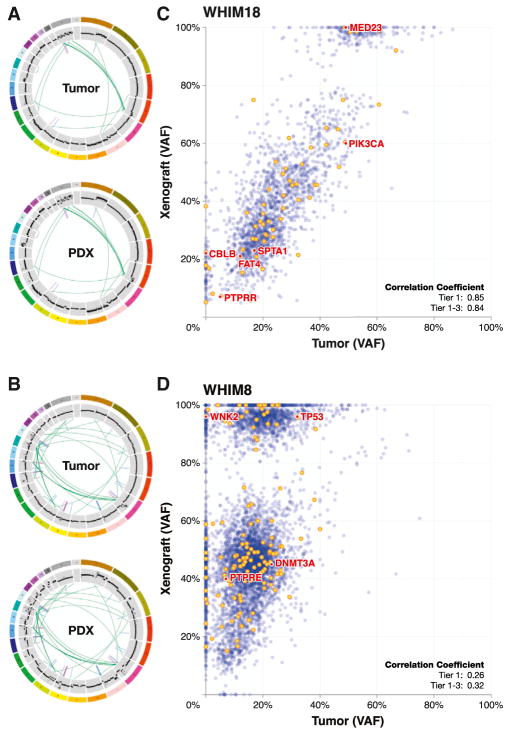
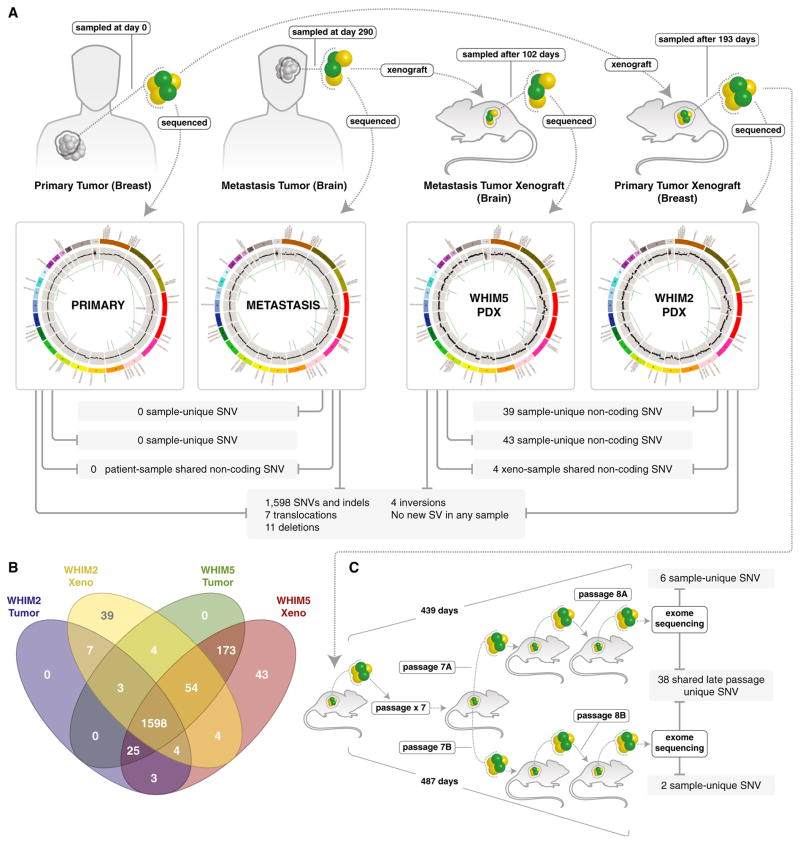
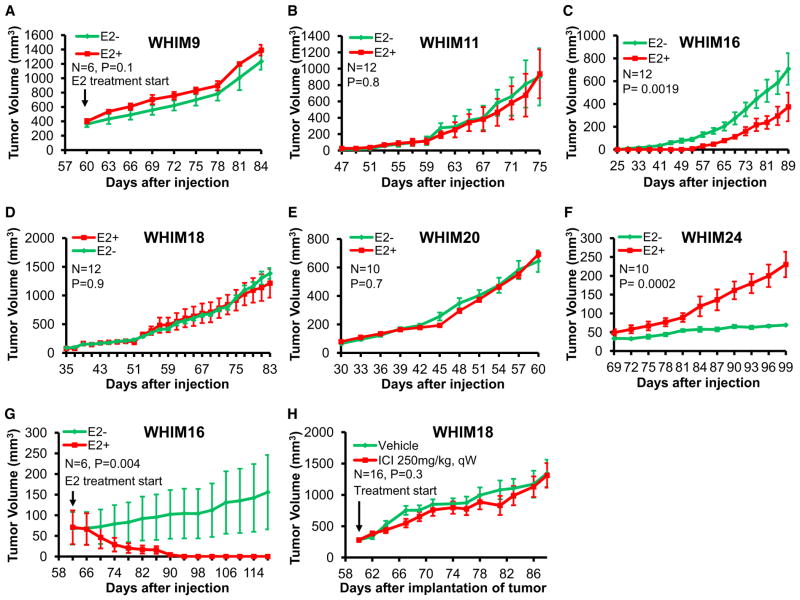
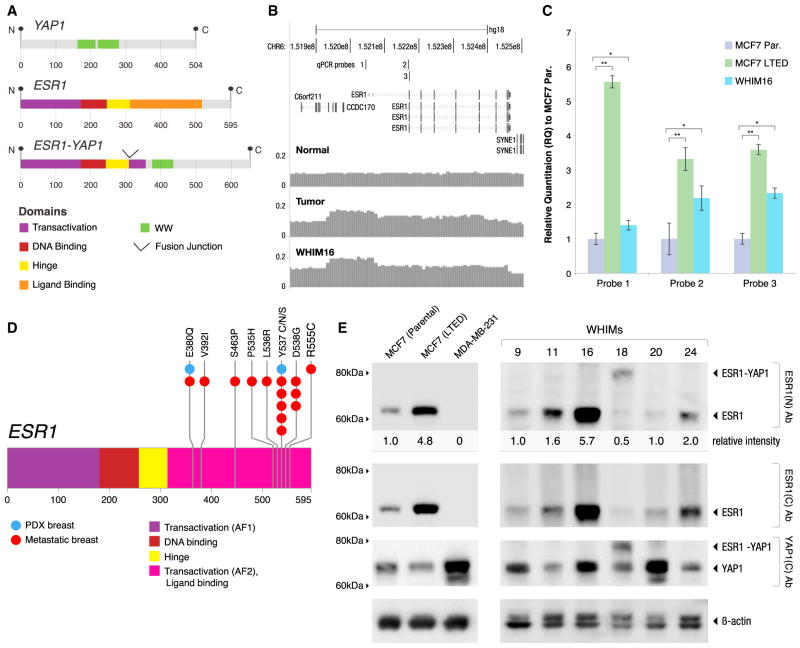
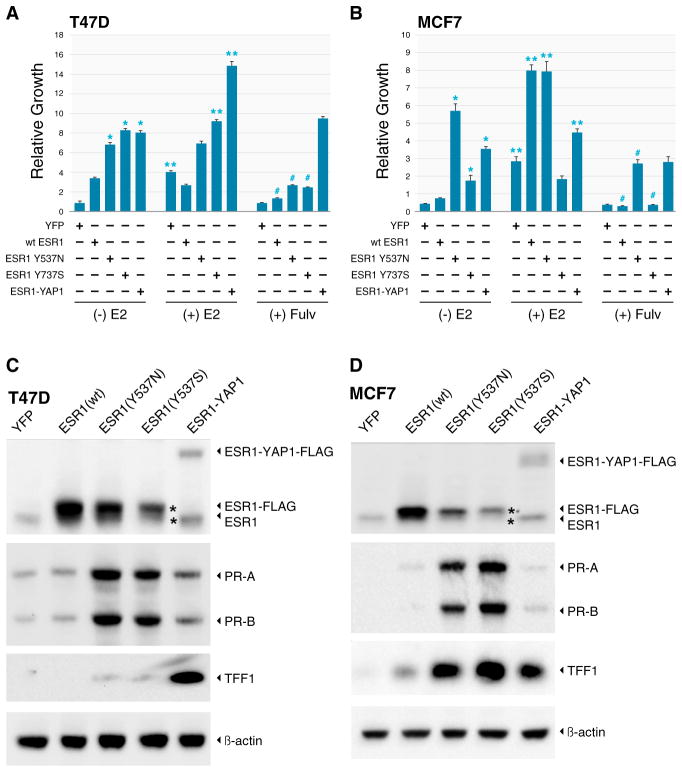
To characterize patient-derived xenografts (PDXs) for functional studies, we made whole-genome comparisons with originating breast cancers representative of the major intrinsic subtypes. Structural and copy number aberrations were found to be retained with high fidelity. However, at the single-nucleotide level, variable numbers of PDX-specific somatic events were documented, although they were only rarely functionally significant. Variant allele frequencies were often preserved in the PDXs, demonstrating that clonal representation can be transplantable. Estrogen-receptor-positive PDXs were associated with ESR1 ligand-binding-domain mutations, gene amplification, or an ESR1/YAP1 translocation. These events produced different endocrine-therapy-response phenotypes in human, cell line, and PDX endocrine-response studies. Hence, deeply sequenced PDX models are an important resource for the search for genome-forward treatment options and capture endocrine-drug-resistance etiologies that are not observed in standard cell lines. The originating tumor genome provides a benchmark for assessing genetic drift and clonal representation after transplantation.


Figures

Figure 1
Figure 1. Generation of a Biologically Diverse Panel of PDX Models from Patients with Advanced Breast Cancer
(A) Diagram indicating the genesis of the PDX models from patients with primary and advanced breast cancer, using two different implantation techniques (human in mouse [Kuperwasser et al., 2004] and simple orthotopic). (B) Unsupervised hierarchical clustering of samples using all genes of the microarrays except the stromal-related genes. The colors of the array tree and the squares below the tree denote the subtype call of each sample. Red, basal-like; pink, HER2-enriched; dark blue, lumenal A; light blue, lumenal B; yellow, Claudin-low. Below the array tree and the subtype identification row, the heatmap of the 50 PAM50 genes as well as selected tight-junction-related genes (E-cadherin [CDH1], claudin 3 [CLDN3], CLDN4, and CLDN7) are shown. The stromal-related genes were identified after a two-class paired SAM was performed with an FDR of 0% between 18 paired progenitor human tumors and xenografts. The complete list of up- and down-regulated genes can be found in Table S2B. See also Figures S3 and S4.
Figure 2
Figure 2. Pairwise Genome-Wide VAF, CNV, and SV Analyses
(A and B) The circos plots for (A) WHIM18 and (B) WHIM8 show the closely matched SVs and CNVs in the tumor of origin and the paired WHIM line. To compare differences in mutant allele frequency between the originating tumor and the PDX counterpart, the read counts for each mutant and wild-type allele were expressed as a percentage of all reads at that position and analyzed by scatterplot and simple correlation coefficient. (C) WHIM18 has a high correlation coefficient (0.84) in both the coding region (yellow) and noncoding region (blue). The VAF stability was maintained across all six SMG mutations. (D) WHIM8 represented the opposite extreme with a low correlation coefficient (0.32) and a relatively large number of xenograft-specific mutations in the homozygous range of 80% or higher. Related to this figure are analyses for the other whole-genome sequenced originating tumor/PDX pairs that are displayed in Figures S7A–S9. See also Figure S6.
Figure 3
Figure 3. Whole-Genome Comparisons of Breast Primary Tumor and Brain Metastasis with their Counterpart PDX Model Xenografts from the Same Patient
(A) The majority of the validated somatic SNVs were shared by the breast primary tumor, brain metastasis, and xenografts (1,598). In addition, seven translocations, 11 large deletions, and four inversions were present in all samples, without any SV detected or lost upon engraftment. (B) The breast primary tumor and brain metastasis contained no sample-unique SNVs, i.e., all of the SNVs were noted in at least one other sample. However in every comparison, more SNVs were observed in the later time sample than in the earlier sample. In a comparison of the two human specimens, 13 were unique to the primary tumor and 231 were unique to the metastasis. Additionally, both WHIM lines harbored additional sample-unique noncoding SNVs (39 in the case of WHIM2 and 43 in the case of WHIM5). (C) Exome sequencing of two separate DNA samples isolated from WHIM2 passage 8, after expansion for therapeutic studies. Mutations in coding space have accumulated, but a study of the 38 mutations observed in both samples suggests that most are passengers rather than biological drivers.
Figure 4
Figure 4. Estradiol Dependency and Tumor Doubling Times for the ER+ WHIM Lines
(A and G) WHIM9 cells (A) or WHIM16 cells (G) were allowed to establish tumor nodules in ovariectomized nonobese diabetic (NOD)/severe combined immunodeficiency (SCID) mice and then treated with or without 17β-estradiol pellets. (B–F) Tumor cells were subcutaneously injected into ovariectomized NOD/SCID mice and then immediately treated with 17β-estradiol pellets or observed. (H) Fragments of WHIM18 tumor tissue were subcutaneously engrafted into female CB.17 SCID mice. Tumor-bearing mice were treated in the presence or absence of fulvestrant when tumor size reached 300 mm3. All data were analyzed in SAS using the PROC MIXED function.
Figure 5
Figure 5. ESR1 Gene Rearrangements and Point Mutations in Lumenal PDX Models
(A) WHIM18 and the originating tumor harbored a balanced translocation between 6q and 11q in WHIM18 that created a fusion-transcript-defected mRNA-seq that encodes the 5′ four exons of ESR1 (amino acids 1–365, including the DNA-binding domain but not the steroid-binding domain) fused to the C terminus of YAP1 (amino acids 230–504), thereby excluding the TEAD domain and the first WW motif of YAP1, but retaining the second WW motif, the SH3 domain, the YES phosphorylation site, and the transactivation domain. (B) WHIM16 and the originating tumor harbor amplification of the ESR1 gene that extends from the promoter region throughout the coding sequence that was mapped using read counts obtained during WGS. (C) qPCR on genomic DNA using three separate probes was used to confirm gene amplification in WHIM16 cells. The negative control was MCF7 cells. In a screen for ESR1-gene-amplified cell lines, MCF7 cells that were adapted after LTED were found to have developed ESR1 gene amplification. qPCR results were normalized relative to parental MCF7 (Par.). The positions of probes 1, 2, and 3 are displayed in (B). Error bars are ±1 SD of the mean relative quantification (RQ); *p < 0.05, ** is p < 0.01. (D) WHIM20 cells harbored and expressed a mutation in ESR1-Y537S, and WHIM24 harbors ESR1-E380Q (indicated in blue). The finding of ESR1-V537S and ESR1-E380Q in these PDX lines complements a recent report on ESR1 sequencing of advanced disease samples in which multiple mutations in the AF2/ligand-binding domain (in pink) were observed (Piccart et al., 2013; mutation positions from this report are indicated in red). (E) Tumor lysates from six ESR1+ WHIM lines (WHIM9, WHIM11, WHIM16, WHIM18, WHIM20, and WHIM24) were analyzed by western blot using antibodies targeting the N terminus or C terminus of ESR1 or the C terminus of YAP1. In parallel, lysates from three breast cancer cell lines (parental MCF7, LTED MCF7, and MDA-MB-231) were analyzed as controls. All blots were replicated four times. ESR1 intensity detected by the N-terminal ER antibody was quantified and normalized against the actin level. For WHIM lines, the normalized ESR1 levels were averaged from four replicate blots and expressed as relative intensities using WHIM9 as the internal reference (arbitrarily set at one). For cell lines, ESR1 levels were similarly normalized against actin and expressed as relative values using parental MCF7 as the internal reference. Lysates from cell lines and WHIM tumors were analyzed in the same blot, but the images displayed reflect different exposure times. See also Figure S15.
Figure 6
Figure 6. Point Mutations and a Translocation in ESR1 Induce Estradiol-Independent Growth
(A and B) T47D(A) and MCF7 (B) cells stably transduced with lentiviral vectors expressing the YFP control gene (YFP), wild-type ESR1 (WT ESR1), ESR1 point mutants (ESR1-Y537N and ESR1-Y537S), and the ESR1-YAP1 fusion gene (ESR1-YAP1) were grown in CSS medium for at least 2 weeks. Cells were then plated in CSS medium containing no supplemental estrogen (−E2), 10 nM estradiol (+E2), or medium without estrogen +500 nM fulvestrant (+ Fulv), and growth was measured after 10 days by Alamar blue assay. Mean results, with standard SEM as error bars, are shown for four experiments (T47D) and three experiments (MCF7), with each experiment conducted in quadruplicate. Cell growth in each line was normalized to baseline values obtained the day after the cells were plated, prior to the beginning of treatment. Expression of the ESR1 point mutants and ESR1-YAP1 fusion significantly promoted the growth of estrogen-deprived cells compared with WT ESR1 or YFP control (*p < 0.05 indicates significant growth stimulation versus YFP or WT ER). The effect of estradiol was then assessed for each lentivirus construct (**p < 0.05 indicates a significant stimulatory effect for each construct with and without estradiol). In T47D cells, estradiol stimulated the growth of YFP, ESR1-Y537S (minimally), and ESR1-YAP1, but not WT-ESR1 or ESR1-Y537N. In contrast, in MCF7 cells, estradiol promoted the growth of WT-ESR1, ESR1-Y537N, and to a much lesser extent ESR1-YAP1, but not ESR1-Y537S. Treatment with fulvestrant significantly inhibited estrogen-independent growth of cells expressing WT ER and ER point mutants (#p < 0.05), but not the ER-YAP1 fusion. (C and D) T47D (C) and MCF7(D) cells were cultured for 8 days in CSS medium, followed by western blot for the expression of endogenous and exogenous ESR1 using an N-terminal antibody and two direct ESR1 downstream targets (progesterone receptor [PR-A and PR-B] and TFF1) with an actin loading control. Due to the substantially lower basal TFF1 expression in T47D cells compared with MCF7 cells, the T47D TFF1 blot was intentionally exposed for a longer time for visualization. See also Figures S13 and S14.

Comment in

References

    1. Bornstein S, White R, Malkoski S, Oka M, Han G, Cleaver T, Reh D, Andersen P, Gross N, Olson S, et al. Smad4 loss in mice causes spontaneous head and neck cancer with increased genomic instability and inflammation. J Clin Invest. 2009;119:3408–3419. - PMC - PubMed
    1. Cancer Genome Atlas Network. Comprehensive molecular portraits of human breast tumours. Nature. 2012a;490:61–70. - PMC - PubMed
    1. Cancer Genome Atlas Research Network. Comprehensive genomic characterization of squamous cell lung cancers. Nature. 2012b;489:519–525. - PMC - PubMed
    1. Chin K, de Solorzano CO, Knowles D, Jones A, Chou W, Rodriguez EG, Kuo WL, Ljung BM, Chew K, Myambo K, et al. In situ analyses of genome instability in breast cancer. Nat Genet. 2004;36:984–988. - PubMed
    1. DeRose YS, Wang G, Lin YC, Bernard PS, Buys SS, Ebbert MT, Factor R, Matsen C, Milash BA, Nelson E, et al. Tumor grafts derived from women with breast cancer authentically reflect tumor pathology, growth, metastasis and disease outcomes. Nat Med. 2011;17:1514–1520. - PMC - PubMed

Publication types

MeSH terms

Associated data