. 2012 Jan 18;31(2):257-66.
doi: 10.1038/emboj.2011.458. Epub 2011 Dec 16.

Extraordinary transgressive phenotypes of hybrid tomato are influenced by epigenetics and small silencing RNAs

Affiliations

Extraordinary transgressive phenotypes of hybrid tomato are influenced by epigenetics and small silencing RNAs

Padubidri V Shivaprasad et al. EMBO J. .

Abstract

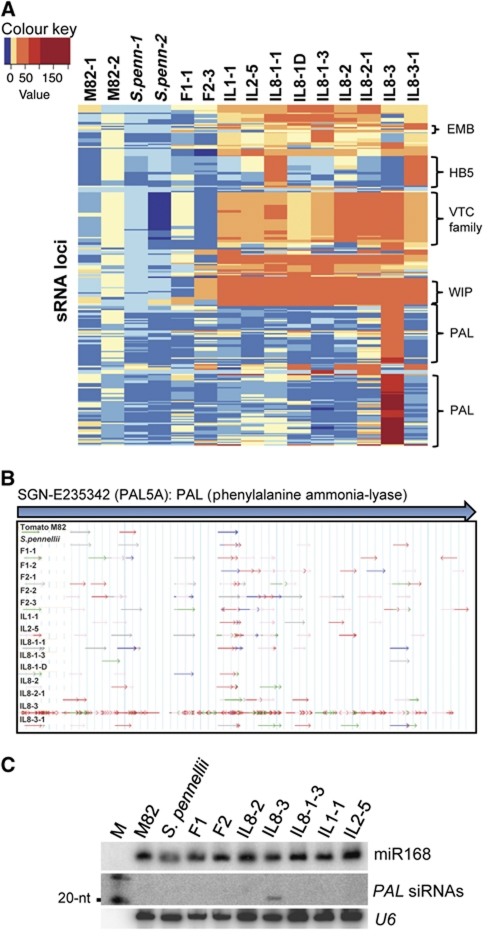
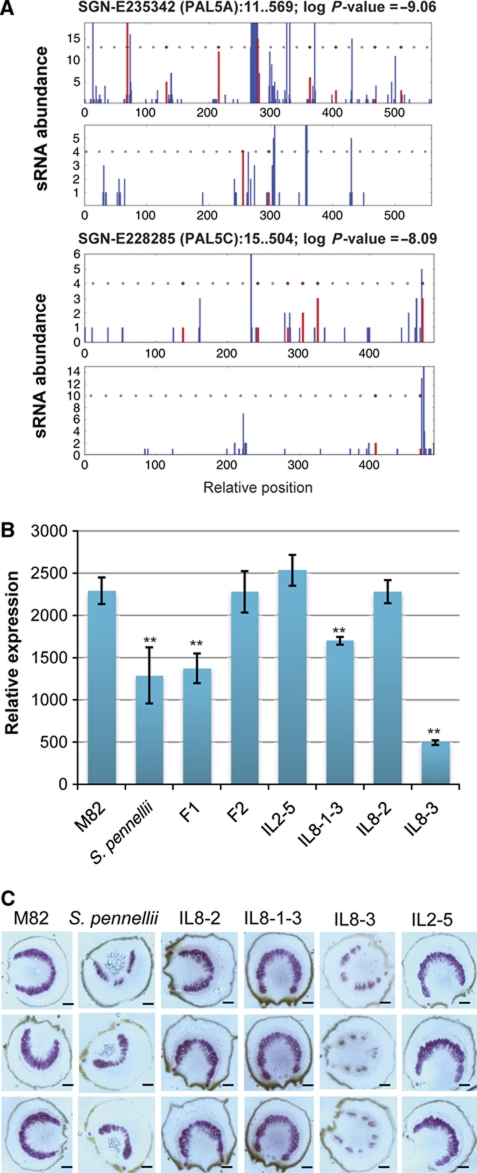
Hybrid organisms may fail to develop, be sterile or they may be more vigorous than either of the parents. Examples of hybrid vigour or hybrid necrosis in the F1 are often not inherited stably in subsequent generations if they are associated with overdominance. There can also be transgressive phenotypes that are inherited stably in these later generations, but the underlying mechanisms are not well understood. Here we have investigated the possibility that stable transgressive phenotypes in the progeny of crosses between cultivated tomato (Solanum lycopersicum cv. M82) and a wild relative (Solanum pennellii, accession LA716) are associated with micro or small interfering(si) RNAs. We identified loci from which these small(s)RNAs were more abundant in hybrids than in either parent and we show that accumulation of such transgressive sRNAs correlated with suppression of the corresponding target genes. In one instance this effect was associated with hypermethylation of the corresponding genomic DNA. Our results illustrate a potential role of transgressive sRNAs in plant breeding and in natural evolution with wild plants.


Conflict of interest statement

The authors declare that they have no conflict of interest.

Figures

Figure 1
Figure 1
Transgressive expression of miR395. (A) Bar chart showing the abundance of miR395, normalised to the sizes of the sRNA data sets. Relative abundance was calculated using miRprof (UEA sRNA tool kit (Moxon et al, 2008)). (B) Accumulation of miR395 in parents and selected ILs. About 15 μg of total RNA from young seedlings were used for analysis of each sample. Total RNA was electrophoresed in 15% polyacrylamide gel, transferred to membrane and probed with corresponding DNA oligonucleotides (Supplementary Table SI) labelled with γ-32P-ATP. U6 serves as loading control. M, Size marker.
Figure 2
Figure 2
miR395 expression contributes to a transgressive phenotype. (A) miR395 accumulation in salt treated (NaCl in mM) plants from parental lines (M82 and S. pennellii), IL8-1-3 and three other ILs. (B) Transcript analysis for APS1. RNA extraction and qRT–PCR was performed as described. GAPDH served as control. Data are mean±s.d. of three replicates. (C) Chlorophyll accumulation in salt-treated and control plants. Chlorophyll accumulation without salt treatment was normalised to 100%. Chlorophyll (μg/g fresh tissue weight) from three independent experiments (n>30) is shown. Data are mean±s.d. The double asterisks in B and C represent significance (one-way (B) or two-way (C) analysis of variance test (Holm-Sidak method; α=0.05)) at P<0.01.
Figure 3
Figure 3
Transgressive siRNA locus H06. (A) Heatmap showing changes in the level of sRNA from the most transgressive genomic loci in IL samples. The H06 locus is marked with *. Replicates of M82 (M82-1 and M82-2) and S. pennellii (S. penn-1 and S. penn-2) were used. Details of TI for each siRNA loci presented in the heatmap are given in Supplementary Table SII. (B) sRNAs from M82, S. pennellii, F1, F2 and introgression line samples aligned to the H06 genomic locus in M82 DNA. Arrows indicate direction of sRNA alignment, and the colour of the arrow indicates length: blue, 24-nt; red, 21-nt; and green, 22-nt. (C) Northern blot analysis of H06 siRNAs in parental lines, F1, F2 and in ILs in four different chromosomes. M, size marker. Oligonucleotide probe sequences (H06a and b) are given in Supplementary Table SI.
Figure 4
Figure 4
DNA methylation and expression analysis of H06 locus. (A) Methylation of H06 genomic DNA using restriction enzyme McrBC. Completely digested DNA indicates hypermethylation. Error bars indicate the 95% confidence intervals of three replicates. The assay was performed as described in Materials and methods section. (B) Sodium bisulphite analysis of H06 locus. Each sample had at least 10 clones analysed for cytosine methylation in replicate experiments. (C) Expression analysis of H06 mRNA using quantitative RT–PCR.
Figure 5
Figure 5
Transgressive PAL siRNA accumulate in IL8-3. (A) Heatmap showing changes in the level of sRNA from the most transgressive cDNA loci in the IL samples. The major families of transgressive siRNAs correspond to the following genetic loci: PAL, phenylalanine ammonia–lyase; EMB, Embryo defective; HB5,Homeobox protein family; VTC, ‘Vitamin C deficient’ family; WIP, Wound inducible protein family. Transgressive siRNA loci are listed in Supplementary Table SIII. (B) sRNAs aligning to the PAL locus in M82, S. pennellii, F1, F2 and ILs. Arrows indicate direction of sRNA alignment, and the colour of the arrow indicates length: blue, 24-nt; red, 21-nt; and green, 22-nt. (C) Northern blot analysis of small RNAs hybridising to a PAL-specific probe.
Figure 6
Figure 6
PAL silencing results in reduced lignification. (A) Phasing of PAL-derived siRNAs along the PAL sequences. Two PAL ESTs with significant P-values (PAL5A, log P value=−9.06; PAL5C, log P-value=−8.09) for phasing are shown. Red bars indicate the start position of sRNAs in phase; and blue, the start position for those out of phase. Rectangles indicate expected phased positions and those in red indicate phased sequences. (B) PAL mRNA expression of parental and hybrid lines. See Materials and methods section for details. Data are mean±s.d. of three biological replicates. The double asterisks represent significance determined by one-way ANOVA at P<0.01 (α=0.05). (C) Phloroglucinol staining for total lignin in parental lines, IL8-3 and three other ILs. Violet stain indicates the presence and distribution of lignin. The micrographs are of sections derived from petioles of seedlings with staining concentrated in the vascular bundles. Size bar, 100 μM.

Comment in

References

    1. Allen E, Xie Z, Gustafson AM, Carrington JC (2005) microRNA-directed phasing during Trans-Acting siRNA biogenesis in plants. Cell 121: 207–221 - PubMed
    1. Anders S, Wolfgang H (2010) Differential expression analysis for sequence count data. Nat Precedings, http://hdl.handle.net/10101/npre.2010.4282.2 - PMC - PubMed
    1. Baack EJ, Rieseberg LH (2007) A genomic view of introgression and hybrid speciation. Curr Opin Genet Dev 17: 513–518 - PMC - PubMed
    1. Baulcombe D (2004) RNA silencing in plants. Nature 431: 356–363 - PubMed
    1. Birchler JA, Yao H, Chudalayandi S, Vaiman D, Veitia RA (2010) Heterosis. Plant Cell 22: 2105–2112 - PMC - PubMed

Publication types