. 2024 Sep 18;15(1):8209.
doi: 10.1038/s41467-024-52490-4.

Multiplex, single-cell CRISPRa screening for cell type specific regulatory elements

Affiliations

Multiplex, single-cell CRISPRa screening for cell type specific regulatory elements

Florence M Chardon et al. Nat Commun. .

Abstract

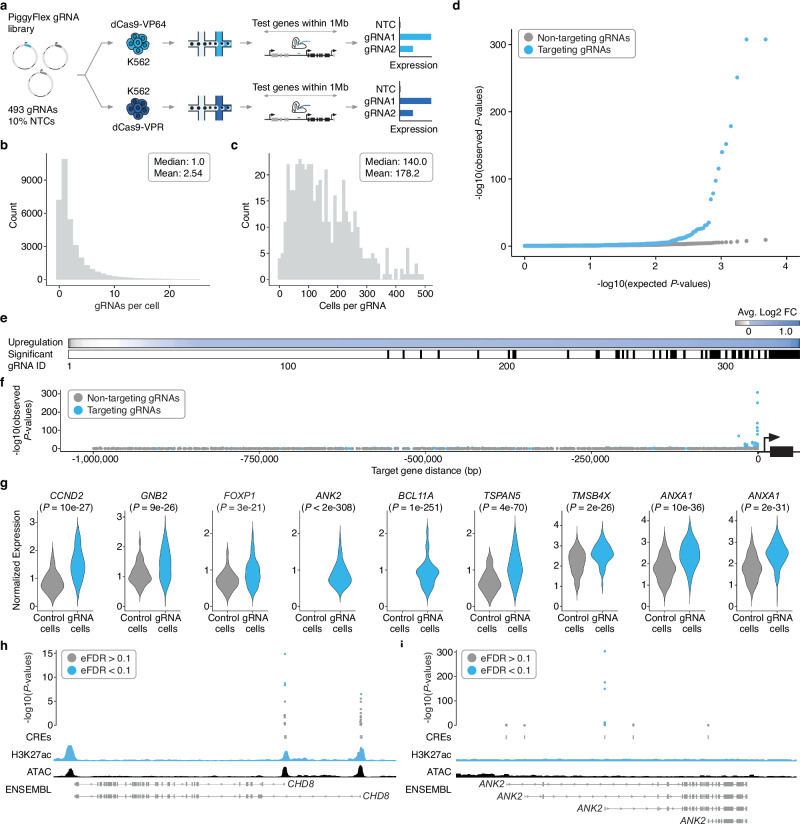
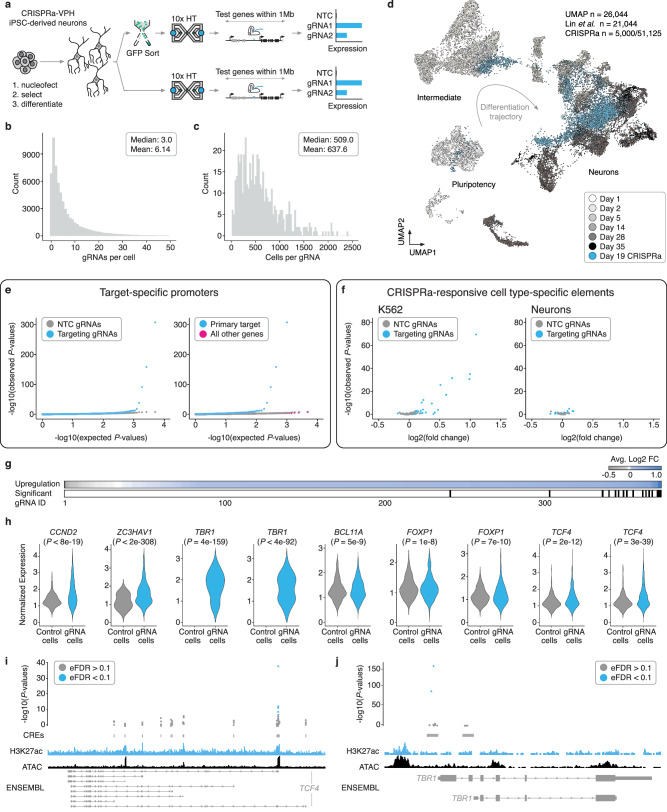
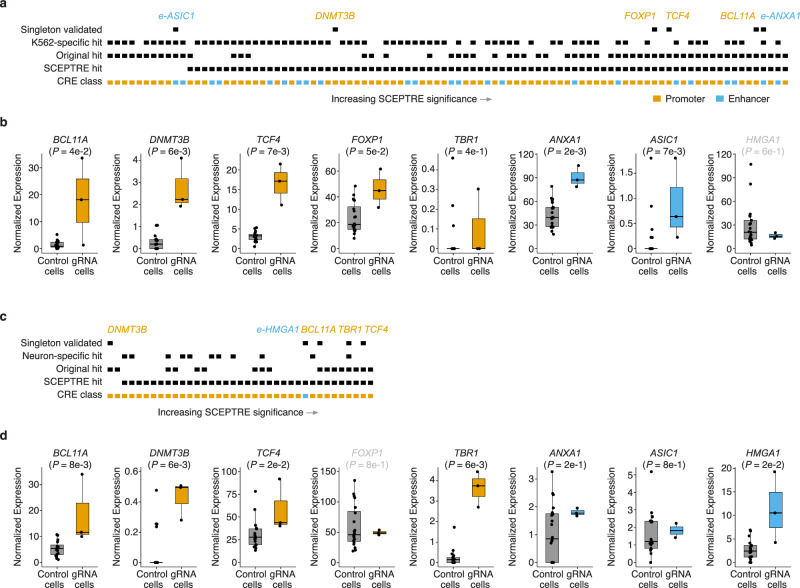
CRISPR-based gene activation (CRISPRa) is a strategy for upregulating gene expression by targeting promoters or enhancers in a tissue/cell-type specific manner. Here, we describe an experimental framework that combines highly multiplexed perturbations with single-cell RNA sequencing (sc-RNA-seq) to identify cell-type-specific, CRISPRa-responsive cis-regulatory elements and the gene(s) they regulate. Random combinations of many gRNAs are introduced to each of many cells, which are then profiled and partitioned into test and control groups to test for effect(s) of CRISPRa perturbations of both enhancers and promoters on the expression of neighboring genes. Applying this method to a library of 493 gRNAs targeting candidate cis-regulatory elements in both K562 cells and iPSC-derived excitatory neurons, we identify gRNAs capable of specifically upregulating intended target genes and no other neighboring genes within 1 Mb, including gRNAs yielding upregulation of six autism spectrum disorder (ASD) and neurodevelopmental disorder (NDD) risk genes in neurons. A consistent pattern is that the responsiveness of individual enhancers to CRISPRa is restricted by cell type, implying a dependency on either chromatin landscape and/or additional trans-acting factors for successful gene activation. The approach outlined here may facilitate large-scale screens for gRNAs that activate genes in a cell type-specific manner.


Conflict of interest statement

S.J.S. receives research funding from BioMarin Pharmaceutical Incorporated. N.A. is the cofounder and on the scientific advisory board of Regel Therapeutics and receives funding from BioMarin Pharmaceutical Incorporated. J.S. is a scientific advisory board member, consultant and/or co-founder of Cajal Neuroscience, Guardant Health, Maze Therapeutics, Camp4 Therapeutics, Phase Genomics, Adaptive Biotechnologies, Scale Biosciences, Sixth Street Capital, Prime Medicine, Somite Therapeutics and Pacific Biosciences. All other authors declare no competing interests.

Figures

Fig. 1
Fig. 1. Multiplex, single cell CRISPRa screening for cell type-specific regulatory elements.
(Left) A library of gRNAs targeting candidate cis-regulatory elements (cCREs) is introduced in a multiplex fashion to a population of cells expressing CRISPRa machinery, such that each cell contains a random combination of multiple CRISPRa-mediated perturbations. (Middle) Following single cell transcriptional profiling and gRNA assignment, cells are systematically computationally partitioned into those with or without a given gRNA and tested for upregulation of neighboring genes. (Right) CRISPRa perturbations can either result in target-specific upregulation, no detectable effect (e.g., for non-targeting controls) or, at least theoretically, broad cis-upregulation of multiple genes in the vicinity of the gRNA/CRISPRa machinery. Furthermore, patterns of upregulation can either be general or cell type-specific.
Fig. 2
Fig. 2. Multiplex single cell CRISPRa screening of regulatory elements in K562 cells.
a Screen workflow. b gRNAs/cell. c Cells/gRNA. d Quantile-quantile plot showing distribution of expected vs. observed P-values for targeting (blue) and non-targeting (gray, downsampled) differential expression tests. P-values are from a two-tailed Wilcoxon rank-sum test. e (Top) Average log2 fold change in expression between cells with each targeting gRNA vs. controls for each of the primary/programmed target genes. Tests are sorted left-to-right by increasing log2 fold change. (Bottom) Categorical heatmap showing which of the perturbations drove significant upregulation using an Empirical FDR approach (EFDR < 0.1). f Targeting gRNAs yielding significant upregulation are enriched for proximity to their target gene. We observe no such enrichment for NTCs tested for associations with target genes randomly selected from the same set. g Average log2 fold change between cells with a given gRNA and controls for select hit gRNAs. Number of cells bearing each targeting gRNA (from left to right): CCND2 (n = 73), GNB2 (n = 220), FOXP1 (n = 313), ANK2 (n = 403), BCL11A (n = 191), TSPAN5 (n = 48), TMSB4X (n = 260), ANXA1 (n = 166), ANXA1 (n = 128). Control cells are downsampled to have the same number of cells as the average number of cells detected per gRNA (n = 178) for visualization. Normalized expression values represent log normalized expression values from Seurat. Only cells with at least 1 target gene UMI are plotted. Note that some genes (e.g., ANK2) are typically not detected as expressed in this cell context, resulting in zero UMIs detected and thus no expression distribution plotted in downsampled control cell populations. P-values as in panel (d, h) Hits included multiple gRNAs targeting isoform-specific promoters of CHD8. P-values are visualized alongside tracks for K562 ATAC-seq (ENCODE), H3K27ac signal (ENCODE), and RefSeq validated transcripts (ENSEMBL/NCBI). P-values as in panel d EFDR sets as in panel (e). i The strongest hit gRNAs for ANK2 target the same promoter that is not prioritized by biochemical marks (e.g., accessibility or H3K27ac). Genomic tracks, P-values, and EFDR sets as in panel h Abbreviations: NTC non-targeting controls.
Fig. 3
Fig. 3. Multiplex single cell CRISPRa screening of regulatory elements in post-mitotic iPSC-derived neurons.
a Screen workflow. b gRNAs/cell. c Cells/gRNA. d UMAP projection of the neuron dataset from this study (blue, 51,183 cells downsampled to 5000 cells to aid with visualization) onto a sc-RNA-seq differentiation time-course from a similar differentiation protocol and NGN2 iPSC line (21,044 cells). e (Left) QQ-plot displaying observed vs. expected P-value distributions for targeting (blue) and NTC (downsampled) populations. (Right) QQ-plot for targeting tests against their intended/programmed target (blue) compared to targeting tests of all other genes with 1 Mb of each gRNA (pink) and NTCs (gray downsampled). P-values are from a two-tailed Wilcoxon rank-sum test. f Average log2 fold change and P-values exclusively for gRNAs that target putative enhancers in K562 cells (left) and iPSC-derived neurons (right). P-values as in panel (e). g (Top) Average log2 fold change in expression between cells with each targeting gRNA vs. controls for each of the primary/programmed target genes. (Bottom) Categorical heatmap showing which of the perturbations produced significant upregulation using an Empirical FDR approach (EFDR < 0.1). h Average log2 fold change between cells with a given gRNA and controls for select hit gRNAs (plotted as in Fig. 2d). Number of cells bearing each targeting gRNA (from left to right): CCND2 (n = 350), ZC3HAV1 (n = 765), TBR1 (n = 455), TBR1 (n = 655), BCL11A (n = 964), FOXP1 (n = 1198), FOXP1 (n = 917), TCF4 (n = 1051), TCF4 (n = 1253). Control cells are downsampled to have the same number of cells as the average number of cells detected per gRNA (n = 638) for visualization. P-values as in (e). i Of 14 targeted candidate promoters, five hit gRNAs for TCF4 target the same candidate promoter that aligns with biochemical marks of regulatory activity (ATAC-Seq and H3K27ac). Empirical P-values are visualized alongside tracks for iPSC-derived neuron ATAC-seq (accessibility), and H3K27ac, and RefSeq validated transcripts (ENSEMBL/NCBI). P-values as in panel (e). EFDR sets as in panel (g). j Hits included multiple gRNAs targeting TBR1. Genomic tracks, P-values, and EFDR sets as in panel (i).
Fig. 4
Fig. 4. Reanalysis with covariates and singleton experimental validations support and extend results.
a Singleton validation results for K562 cells. Categorical heatmap indicating whether a K562 hit gRNA was detected with SCEPTRE, our original approach, targeted a promoter or enhancer, drove K562-specific upregulation, and whether it was validated with singleton experiments. Hit CREs that drove upregulation in singleton validations are labeled and coloured according to target CRE class. b Boxplots displaying the average log2 fold change between cells with a given gRNA (n = 3 independent lines) and controls (n = 21 lines). Normalized expression displayed in transcripts per million (TPM). Boxes represent the 25th, 50th, and 75th percentiles. Whiskers extend from hinge to 1.5 times the inter-quartile range. All data points are also plotted on top of the box plot for transparency. P-values are from a two-tailed Wilcoxon rank-sum test with a significance threshold of 0.1. c Singleton validation results for iPSC-derived neurons. Categorical heatmap indicating whether a neuron hit gRNA was detected with SCEPTRE, our original approach, targeted a promoter or enhancer, drove iPSC-derived neuron-specific upregulation, and whether it was validated with singleton experiments. Hit CREs that drove upregulation in singleton validations are labeled and coloured according to target CRE class. d Boxplots displaying the average log2 fold change between cells with a given gRNA (n = 3 independent lines) and controls (n = 21 lines). Normalized expression displayed in transcripts per million (TPM). P-values as in panel (b). The two instances where expected upregulation was not observed in a particular cell context are labeled in gray above the corresponding box plot (specifically gRNAs targeting e-HMGA1 in K562 cells and a promoter of FOXP1 in neurons). Boxes as in panel (d). The 14/16 experiments where the expected result was observed are labeled in black above the corresponding box plot, while the 2/16 that are labeled in gray failed to validate.

Update of

References

    1. Gasperini, M., Tome, J. M. & Shendure, J. Towards a comprehensive catalogue of validated and target-linked human enhancers. Nat. Rev. Genet.21, 292–310 (2020). - PMC - PubMed
    1. Gasperini, M. et al. A genome-wide framework for mapping gene regulation via cellular genetic screens. Cell176, 377–390.e19 (2019). - PMC - PubMed
    1. Fulco, C. P. et al. Systematic mapping of functional enhancer–promoter connections with CRISPR interference. Science354, 769–773 (2016). - PMC - PubMed
    1. Xie, S., Duan, J., Li, B., Zhou, P. & Hon, G. C. Multiplexed engineering and analysis of combinatorial enhancer activity in single cells. Mol. Cell66, 285–299.e5 (2017). - PubMed
    1. Gilbert, L. A. et al. Genome-scale CRISPR-mediated control of gene repression and activation. Cell159, 647–661 (2014). - PMC - PubMed

Publication types

MeSH terms

Substances