. 2009 Dec 18;326(5960):1663-7.
doi: 10.1126/science.1178357.

Stepwise modification of a modular enhancer underlies adaptation in a Drosophila population

Affiliations

Stepwise modification of a modular enhancer underlies adaptation in a Drosophila population

Mark Rebeiz et al. Science. .

Abstract

The evolution of cis regulatory elements (enhancers) of developmentally regulated genes plays a large role in the evolution of animal morphology. However, the mutational path of enhancer evolution--the number, origin, effect, and order of mutations that alter enhancer function--has not been elucidated. Here, we localized a suite of substitutions in a modular enhancer of the ebony locus responsible for adaptive melanism in a Ugandan Drosophila population. We show that at least five mutations with varied effects arose recently from a combination of standing variation and new mutations and combined to create an allele of large phenotypic effect. We underscore how enhancers are distinct macromolecular entities, subject to fundamentally different, and generally more relaxed, functional constraints relative to protein sequences.


Figures

Fig. 1
Fig. 1
Variation in abdominal pigmentation within a Ugandan population of D. melanogaster. Each abdomen is derived from an extraction line bearing a homozygous third chromosome from a Ugandan population sample. The name of each line designates the percent darkness of the A4 abdominal tergite. ebony AFA is a null mutation.
Fig. 2
Fig. 2
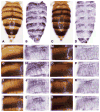
ebony expression correlates with abdominal pigmentation within the Ugandan population. Abdominal pigmentation phenotypes of U53 (A) and U76 (C). The region outlined in (A) marks the A4 hemitergite imaged in (E to T). Accumulation of ebony transcript in the abdomen of U53 (B) and U76 (D) flies within 1 hour after eclosion was revealed by in situ hybridization. The developing U76 fly (C) shows greatly reduced amounts of ebony mRNA throughout the abdomen (D). [(E), (G), (I), (K), (M), (O), (Q), and (S)] Images of A4 hemitergite, as outlined in (A), from eight lines. [(F), (H), (J), (L), (N), (P), (R), and (T)] The corresponding amount of ebony mRNA expression within 1 hour post-eclosion revealed by in situ hybridization. Alleles are as follows: for (E) and (F), U53; (G) and (H), U62; (I) and (J), U64; (K) and (L), U65; (M) and (N), U75a; (O) and (P), U75b; (Q) and (R), U76; and (S) and (T), U78.
Fig. 3
Fig. 3
Noncoding variation at ebony causes abdominal melanism. By using transgenic complementation, we localized abdominal pigmentation differences between light and dark ebony alleles to the 5′ noncoding region. (A) Schematic of the ebony gene, indicating the span of rescue transgenes tested. The asterisk denotes the location at which light/dark chimeric transgenes were fused. Rescue transgenes were transformed into D. melanogaster and crossed into an ebony null mutant background [(F), ebonyAFA]. (B) Rescue of the ebony mutant abdominal phenotype by one copy of a U62 (Light) ebony transgene. (C) Animal bearing one copy of a chimeric transgene consisting of the 5′ regulatory region from the light line and the transcription unit of the ebony gene of a dark line displays a light abdominal phenotype that is similar to the light line. (D) A fly bearing the dark line’s 5′ regulatory region fused to the transcription unit of the light allele shows a dark phenotype that is similar to the dark line rescue transgene phenotype. (E) A rescue transgene derived from the dark line U76 complements the ebony mutation to a much lesser degree than the light line transgene. (G) Quantification of the amount of abdominal phenotypic rescue by transgenes. Letters below each column label correspond to the images above. Bars indicate standard error of the mean.
Fig. 4
Fig. 4
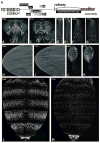
The divergence in ebony activity is confined to a modular enhancer. Localization of ebony regulatory sequences in a GFP reporter assay; the difference in activity between light and dark alleles is restricted to the abdomen. (A) Map of ebony locus displaying the location of enhancers mapped through reporter assays. Black bars denote regions required for activity, whereas gray areas delineate the area in which enhancer boundaries lie. br indicates bristles; male rep, male repression; halt, haltere; stripe, abdominal tergite stripe repression; brain, third instar larval brain; hooks, larval mouth hooks; and spir, larval spiracles. (B to M) Reporter activity driven by the complete regulatory region of the ebony locus from a light [U53 in (B), (D), (F), (H), (J), and (L)] or dark [U76 in (C), (E), (G), (I), (K), and (M)] chromosome extraction line. Shown in (B) and (C) is the head; (D) and (E), femur of T2 legs; (F) and (G), third instar brain; (H) and (I), wing; (J) and (K), haltere; (L) and (M), adult abdomen. Staging and fluorescence quantification are presented in SOM text.
Fig. 5
Fig. 5
Multiple mutations in the ebony abdominal cis regulatory element contribute to enhancer activity differences. Five mutations decrease ebony expression in the dark allele and show a varied distribution across Africa. (A) Schematic of ebony abdominal enhancer, showing the positions of the X, Y, and Z fragments and the relative position of identified causative mutations. (B) Candidate mutations in the core element and the dark-specific substitutions that were tested by reporter assay. Colored shading of residues highlights mutations with functional contribution to enhancer divergence. Numbers for core element substitutions correspond to the base pair position of each nucleotide within the minimal abdominal element. Numbers below dark-specific substitutions coincide with their order in the region of the abdominal element (see fig. S9 for a schematic representation). (C) Map of African continent displaying distribution of causative mutations identified in the study. The color coding for mutations corresponds to the shading and colored circles above each relevant mutation in (A).

Comment in

References

    1. Carroll SB, Grenier JK, Weatherbee SD. From DNA to Diversity: Molecular Genetics and the Evolution of Animal Design. 2. Blackwell; Malden, MA: 2005.
    1. Davidson EH. The Regulatory Genome: Gene Regulatory Networks in Development and Evolution. Academic Press; Burlington, MA: 2006. p. xi.
    1. Gompel N, Prud’homme B, Wittkopp PJ, Kassner VA, Carroll SB. Nature. 2005;433481 - PubMed
    1. Prud’homme B, et al. Nature. 2006;4401050
    1. Jeong S, Rokas A, Carroll SB. Cell. 2006;1251387 - PubMed

Publication types

MeSH terms

Associated data