

Identification of amino acid substitutions associated with neutralization phenotype in the human immunodeficiency virus type-1 subtype C gp120
- PMID: 21036380
- PMCID: PMC3007099
- DOI: 10.1016/j.virol.2010.09.031
Identification of amino acid substitutions associated with neutralization phenotype in the human immunodeficiency virus type-1 subtype C gp120
Abstract
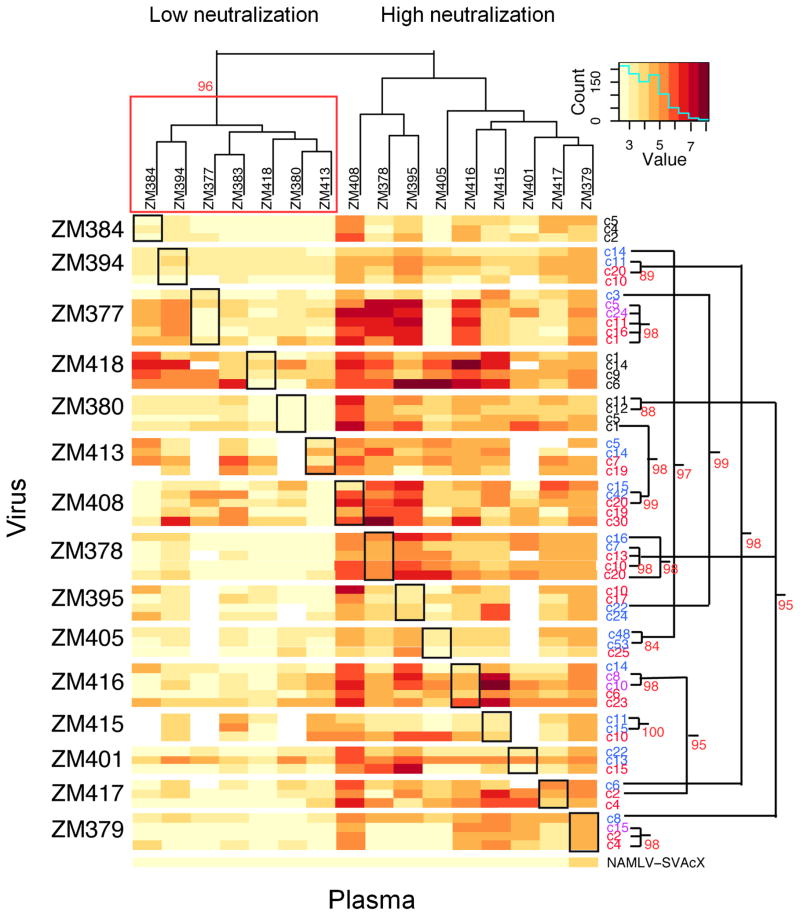
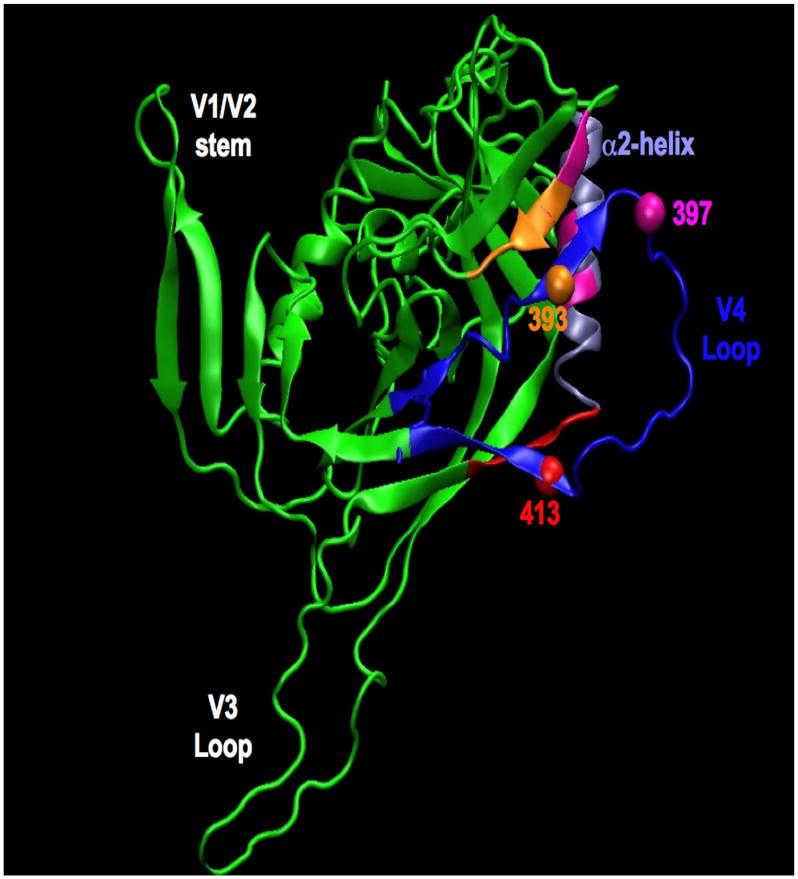
Neutralizing antibodies (Nabs) are thought to play an important role in prevention and control of HIV-1 infection and should be targeted by an AIDS vaccine. It is critical to understand how HIV-1 induces Nabs by analyzing viral sequences in both tested viruses and sera. Neutralization susceptibility to antibodies in autologous and heterologous plasma was determined for multiple Envs (3-6) from each of 15 subtype-C-infected individuals. Heterologous neutralization was divided into two distinct groups: plasma with strong, cross-reactive neutralization (n=9) and plasma with weak neutralization (n=6). Plasma with cross-reactive heterologous Nabs also more potently neutralized contemporaneous autologous viruses. Analysis of Env sequences in plasma from both groups revealed a three-amino-acid substitution pattern in the V4 region that was associated with greater neutralization potency and breadth. Identification of such potential neutralization signatures may have important implications for the development of HIV-1 vaccines capable of inducing Nabs to subtype C HIV-1.
Copyright © 2010 Elsevier Inc. All rights reserved.
Figures
References
-
- Abrahams MR, Anderson JA, Giorgi EE, Seoighe C, Mlisana K, Ping LH, Athreya GS, Treurnicht FK, Keele BF, Wood N, Salazar-Gonzalez JF, Bhattacharya T, Chu H, Hoffman I, Galvin S, Mapanje C, Kazembe P, Thebus R, Fiscus S, Hide W, Cohen MS, Karim SA, Haynes BF, Shaw GM, Hahn BH, Korber BT, Swanstrom R, Williamson C. Quantitating the multiplicity of infection with human immunodeficiency virus type 1 subtype C reveals a non-poisson distribution of transmitted variants. J Virol. 2009;83:3556–3567. - PMC - PubMed
-
- Bhattacharya T, Daniels M, Heckerman D, Foley B, Frahm N, Kadie C, Carlson J, Yusim K, McMahon B, Gaschen B, Mallal S, Mullins JI, Nickle DC, Herbeck J, Rousseau C, Learn GH, Miura T, Brander C, Walker B, Korber B. Founder effects in the assessment of HIV polymorphisms and HLA allele associations. Science. 2007;315:1583–1586. - PubMed
-
- Binley JM, Lybarger EA, Crooks ET, Seaman MS, Gray E, Davis KL, Decker JM, Wycuff D, Harris L, Hawkins N, Wood B, Nathe C, Richman D, Tomaras GD, Bibollet-Ruche F, Robinson JE, Morris L, Shaw GM, Montefiori DC, Mascola JR. Profiling the specificity of neutralizing antibodies in a large panel of plasmas from patients chronically infected with human immunodeficiency virus type 1 subtypes B and C. J Virol. 2008;82:11651–11668. - PMC - PubMed
-
- Binley JM, Wrin T, Korber B, Zwick MB, Wang M, Chappey C, Stiegler G, Kunert R, Zolla-Pazner S, Katinger H, Petropoulos CJ, Burton DR. Comprehensive cross-clade neutralization analysis of a panel of anti-human immunodeficiency virus type 1 monoclonal antibodies. J Virol. 2004;78:13232–13252. - PMC - PubMed
Publication types
MeSH terms
Substances
Associated data
- Actions
- Actions
- Actions
- Actions
- Actions
- Actions
- Actions
- Actions
- Actions
- Actions
- Actions
- Actions
- Actions
- Actions
- Actions
- Actions
- Actions
- Actions
- Actions
- Actions
- Actions
- Actions
- Actions
- Actions
- Actions
- Actions
- Actions
- Actions
- Actions
- Actions
- Actions
- Actions
- Actions
- Actions
- Actions
- Actions
- Actions
- Actions
- Actions
- Actions
- Actions
- Actions
- Actions
- Actions
- Actions
- Actions
- Actions
- Actions
- Actions
- Actions
- Actions
- Actions
- Actions
- Actions
- Actions
- Actions
- Actions
- Actions
- Actions
- Actions
- Actions
- Actions
- Actions
- Actions
- Actions
- Actions
- Actions
- Actions
- Actions
- Actions
- Actions
- Actions
- Actions
- Actions
- Actions
- Actions
- Actions
- Actions
- Actions
- Actions
- Actions
- Actions
- Actions
- Actions
- Actions
- Actions
- Actions
- Actions
- Actions
- Actions
- Actions
- Actions
- Actions
- Actions
- Actions
- Actions
- Actions
- Actions
- Actions
- Actions
- Actions
- Actions
- Actions
- Actions
- Actions
- Actions
- Actions
- Actions
- Actions
- Actions
- Actions
- Actions
- Actions
- Actions
- Actions
- Actions
- Actions
- Actions
- Actions
- Actions
- Actions
- Actions
- Actions
- Actions
- Actions
- Actions
- Actions
- Actions
- Actions
- Actions
- Actions
- Actions
- Actions
- Actions
- Actions
- Actions
- Actions
- Actions
- Actions
- Actions
- Actions
- Actions
- Actions
- Actions
- Actions
- Actions
- Actions
- Actions
- Actions
- Actions
- Actions
- Actions
- Actions
- Actions
- Actions
- Actions
- Actions
- Actions
- Actions
- Actions
- Actions
- Actions
- Actions
- Actions
- Actions
- Actions
- Actions
- Actions
- Actions
- Actions
- Actions
- Actions
- Actions
- Actions
- Actions
- Actions
- Actions
- Actions
- Actions
- Actions
- Actions
- Actions
- Actions
- Actions
- Actions
- Actions
- Actions
- Actions
- Actions
- Actions
- Actions
- Actions
- Actions
- Actions
- Actions
- Actions
- Actions
- Actions
- Actions
- Actions
- Actions
- Actions
- Actions
- Actions
- Actions
- Actions
- Actions
- Actions
- Actions
- Actions
- Actions
- Actions
- Actions
- Actions
- Actions
- Actions
- Actions
- Actions
- Actions
- Actions
- Actions
- Actions
- Actions
- Actions
- Actions
- Actions
- Actions
- Actions
- Actions
- Actions
- Actions
- Actions
- Actions
- Actions
- Actions
- Actions
- Actions
- Actions
- Actions
- Actions
- Actions
- Actions
- Actions
- Actions
- Actions
- Actions
- Actions
- Actions
- Actions
- Actions
- Actions
- Actions
- Actions
- Actions
- Actions
- Actions
- Actions
- Actions
- Actions
- Actions
- Actions
- Actions
- Actions
- Actions
- Actions
- Actions
- Actions
- Actions
- Actions
- Actions
- Actions
- Actions
- Actions
- Actions
- Actions
- Actions
- Actions
- Actions
- Actions
- Actions
- Actions
- Actions
- Actions
- Actions
- Actions
- Actions
- Actions
- Actions
- Actions
- Actions
- Actions
- Actions
- Actions
- Actions
- Actions
- Actions
- Actions
- Actions
- Actions
- Actions
- Actions
- Actions
- Actions
- Actions
- Actions
- Actions
- Actions
- Actions
- Actions
- Actions
- Actions
- Actions
- Actions
- Actions
- Actions
- Actions
- Actions
- Actions
- Actions
- Actions
- Actions
- Actions
- Actions
- Actions
- Actions
- Actions
- Actions
- Actions
- Actions
- Actions
- Actions
- Actions
- Actions
- Actions
- Actions
- Actions
- Actions
- Actions
- Actions
- Actions
- Actions
- Actions
- Actions
- Actions
- Actions
- Actions
- Actions
- Actions
- Actions
- Actions
- Actions
- Actions
- Actions
- Actions
- Actions
- Actions
- Actions
- Actions
- Actions
- Actions
- Actions
- Actions
- Actions
- Actions
- Actions
- Actions
- Actions
- Actions
- Actions
- Actions
- Actions
- Actions
- Actions
- Actions
- Actions
- Actions
- Actions
- Actions
- Actions
- Actions
- Actions
- Actions
- Actions
- Actions
- Actions
- Actions
- Actions
- Actions
- Actions
- Actions
- Actions
- Actions
- Actions
- Actions
- Actions
- Actions
- Actions
- Actions
- Actions
- Actions
- Actions
- Actions
- Actions
- Actions
- Actions
- Actions
- Actions
- Actions
- Actions
- Actions
- Actions
- Actions
- Actions
- Actions
- Actions
- Actions
- Actions
- Actions
- Actions
- Actions
- Actions
- Actions
- Actions
- Actions
- Actions
- Actions
- Actions
- Actions
- Actions
- Actions
- Actions
- Actions
- Actions
- Actions
- Actions
- Actions
- Actions
- Actions
- Actions
- Actions
- Actions
- Actions
- Actions
- Actions
- Actions
- Actions
- Actions
- Actions
- Actions
- Actions
- Actions
- Actions
- Actions
- Actions
- Actions
- Actions
- Actions
- Actions
- Actions
- Actions
- Actions
- Actions
- Actions
- Actions
- Actions
- Actions
- Actions
- Actions
- Actions
- Actions
- Actions
- Actions
- Actions
- Actions
- Actions
- Actions
Grants and funding
LinkOut - more resources
Full Text Sources
Molecular Biology Databases
