. 2016 Dec 15;17(1):165.
doi: 10.1186/s12931-016-0482-9.

Validated and longitudinally stable asthma phenotypes based on cluster analysis of the ADEPT study

Collaborators, Affiliations

Validated and longitudinally stable asthma phenotypes based on cluster analysis of the ADEPT study

Matthew J Loza et al. Respir Res. .

Abstract

Background: Asthma is a disease of varying severity and differing disease mechanisms. To date, studies aimed at stratifying asthma into clinically useful phenotypes have produced a number of phenotypes that have yet to be assessed for stability and to be validated in independent cohorts. The aim of this study was to define and validate, for the first time ever, clinically driven asthma phenotypes using two independent, severe asthma cohorts: ADEPT and U-BIOPRED.

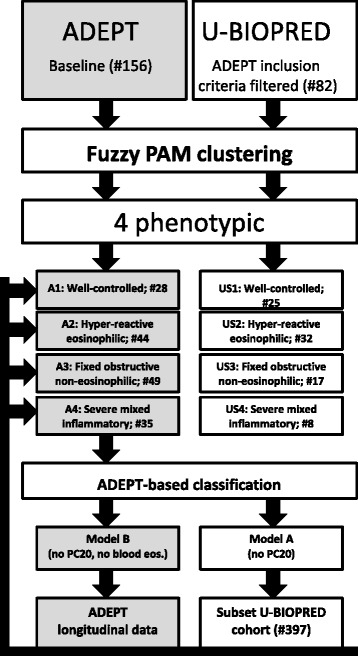
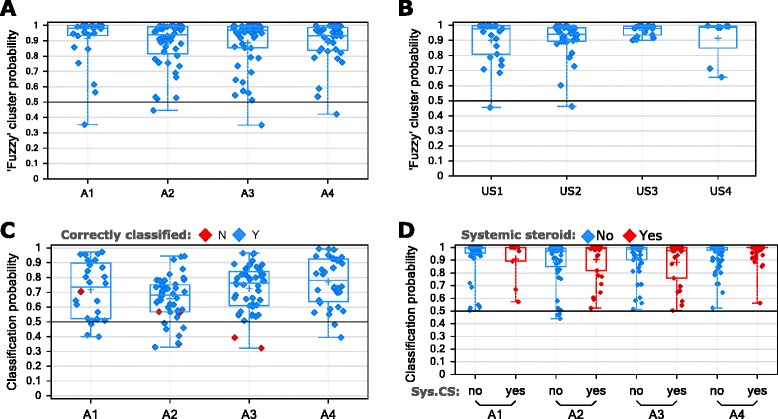
Methods: Fuzzy partition-around-medoid clustering was performed on pre-specified data from the ADEPT participants (n = 156) and independently on data from a subset of U-BIOPRED asthma participants (n = 82) for whom the same variables were available. Models for cluster classification probabilities were derived and applied to the 12-month longitudinal ADEPT data and to a larger subset of the U-BIOPRED asthma dataset (n = 397). High and low type-2 inflammation phenotypes were defined as high or low Th2 activity, indicated by endobronchial biopsies gene expression changes downstream of IL-4 or IL-13.

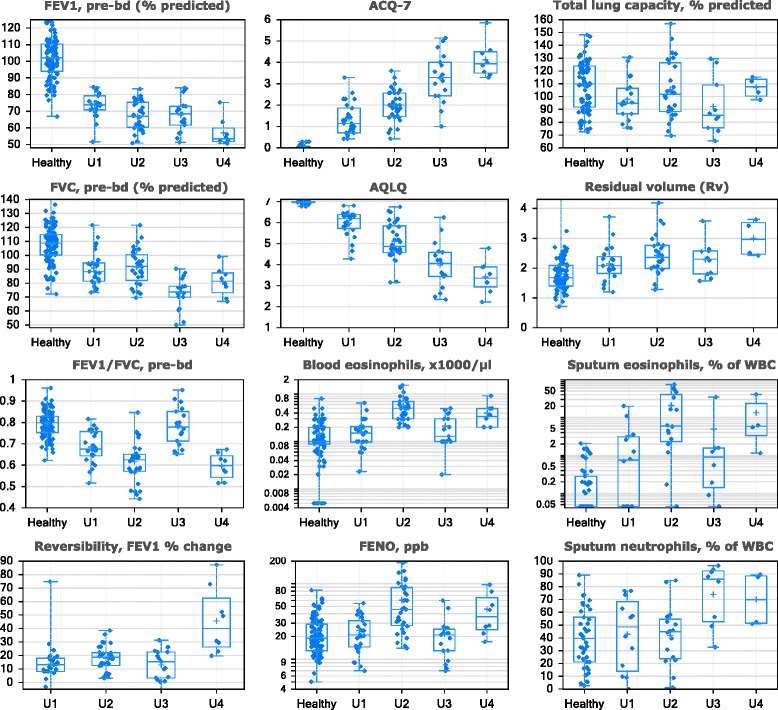
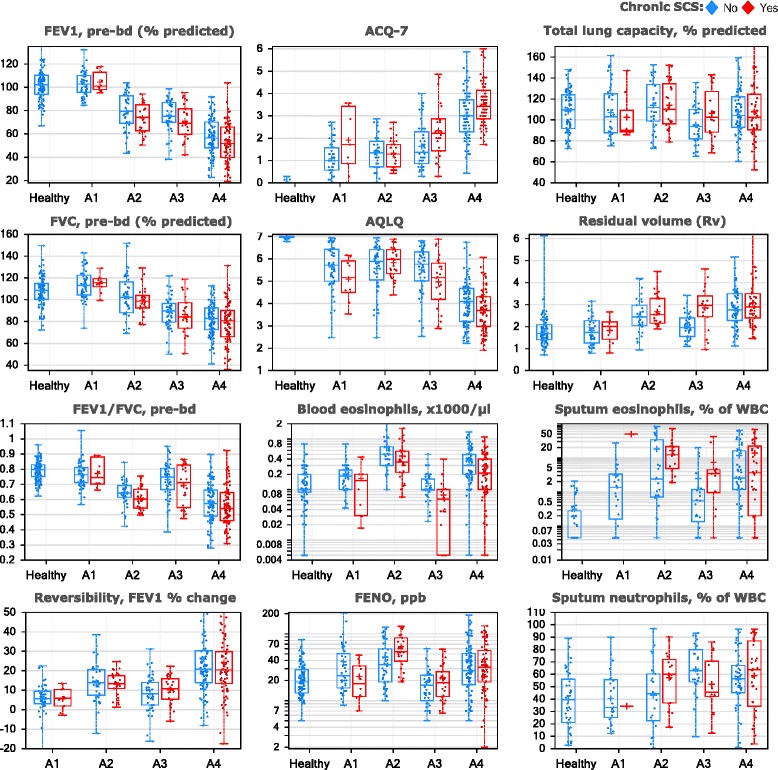
Results: Four phenotypes were identified in the ADEPT (training) cohort, with distinct clinical and biomarker profiles. Phenotype 1 was "mild, good lung function, early onset", with a low-inflammatory, predominantly Type-2, phenotype. Phenotype 2 had a "moderate, hyper-responsive, eosinophilic" phenotype, with moderate asthma control, mild airflow obstruction and predominant Type-2 inflammation. Phenotype 3 had a "mixed severity, predominantly fixed obstructive, non-eosinophilic and neutrophilic" phenotype, with moderate asthma control and low Type-2 inflammation. Phenotype 4 had a "severe uncontrolled, severe reversible obstruction, mixed granulocytic" phenotype, with moderate Type-2 inflammation. These phenotypes had good longitudinal stability in the ADEPT cohort. They were reproduced and demonstrated high classification probability in two subsets of the U-BIOPRED asthma cohort.

Conclusions: Focusing on the biology of the four clinical independently-validated easy-to-assess ADEPT asthma phenotypes will help understanding the unmet need and will aid in developing tailored therapies.

Trial registration: NCT01274507 (ADEPT), registered October 28, 2010 and NCT01982162 (U-BIOPRED), registered October 30, 2013.

Keywords: Biological markers; Cluster analysis; Observational study.


Figures

Fig. 1
Fig. 1
Schematic of clustering analyses. Fuzzy PAM clustering was used on 156 ADEPT and 82 U-BIOPRED asthma patients, defining analogous phenotypes, A1 to A4 for ADEPT and US1 to US4 for U-BIOPRED. GLMnet classification models for the ADEPT phenotypes was built and applied to either the ADEPT longitudinal samples (3, 6 and 12 month) or a large subset of the U-BIOPRED cohort (n = 397)
Fig. 2
Fig. 2
Probability of cluster membership. The probability of cluster membership for the assigned cluster (i.e., the cluster with maximum probability) output from the Fuzzy-PAM clustering algorithm is reported for each subject from a ADEPT-asthma cohorts (baseline) and b U-BIOPRED adult asthma cohorts. The classification probability from the GLMnet classification model A of the 8 clustering variables (excluding PC20 variable) is reported for (c) ADEPT asthma subjects (baseline), with discordantly classified subjects shown with red symbols, and d U-BIOPRED asthma, stratified for systemic corticosteroid use (blue, no; red, yes)
Fig. 3
Fig. 3
Clustering variables, sputum granulocytes, and biopsy CCL26 distributions in ADEPT clinical phenotypes. The values (y-axis) for the indicated variables (indicated at top of the plot) are shown for ADEPT asthma participants stratified by fuzzy-PAM clinical clusters (x-axis). Data presented as symbols representing individual participants and summarized by box (inter-quartile range and median) & whiskers (range), with ‘+’ indicating the mean. PreBD, pre-bronchodilator; WBC, white blood cells
Fig. 4
Fig. 4
Mean values of clustering and sputum granulocyte variables among clinical clusters. Relative mean values of the indicated variables are schematically represented for each clinical cluster from ‘best’ (blue) to ‘worst’ (red) values among clusters within the indicated study (coloring for high-to-low values of variable indicated in right-most column)
Fig. 5
Fig. 5
Longitudinal evaluation of ADEPT-asthma clinical phenotype classification. GLMnet-classification model of ADEPT-asthma baseline clinical phenotypes (7 clustering variables, excluding PC20 and blood eosinophils; Model B) was applied to classify the ADEPT-asthma participants based on data from the baseline and 3, 6, and 12 month follow-up visits. Each panel presents ADEPT asthma participants assigned to the indicated clinical phenotypes from the baseline clustering analysis, reporting the phenotype to which they are classified at the indicated follow-up visits
Fig. 6
Fig. 6
Clustering variables, sputum granulocytes, and plethysmography in U-BIOPRED clinical phenotypes. The values (y-axis) for the indicated variables (indicated at top of the plot) are shown for U-BIOPRED asthma participants stratified by fuzzy-PAM clinical phenotypes (x-axis). Data presented as symbols representing individual participants and summarized by box (inter-quartile range and median) & whiskers (range), with ‘+’ indicating mean. Pre-bd, pre-bronchodilator; WBC, white blood cells
Fig. 7
Fig. 7
Clustering variables in U-BIOPRED participants classified to ADEPT clinical phenotypes. The values (y-axis) for the indicated variables (indicated at top of plot) are shown U-BIOPRED healthy controls and asthma participants classified to ADEPT clinical phenotypes (Model A) (x-axis), stratified chronic systemic corticosteroid (SCS) use (blue, no; red, yes). Data presented as symbols representing individual participants and summarized by box (inter-quartile range and median) & whiskers (range), with ‘+’ indicating mean. Pre-bd, pre-bronchodilator; WBC, white blood cells

References

    1. Bel EH, Sousa A, Fleming L, et al. Diagnosis and definition of severe refractory asthma: an international consensus statement from the Innovative Medicine Initiative (IMI) Thorax. 2011;66:910–7. doi: 10.1136/thx.2010.153643. - DOI - PubMed
    1. Kupczyk M, ten Brinke A, et al. Frequent exacerbators--a distinct phenotype of severe asthma. Clin Exp Allergy. 2014;44(2):212–21. doi: 10.1111/cea.12179. - DOI - PubMed
    1. Pavord ID, Korn S, et al. Mepolizumab for severe eosinophilic asthma (DREAM): a multicentre, double-blind, placebo-controlled trial. Lancet. 2012;380(9842):651–9. doi: 10.1016/S0140-6736(12)60988-X. - DOI - PubMed
    1. Bel EH, Wenzel SE, et al. Oral glucocorticoid-sparing effect of mepolizumab in eosinophilic asthma. N Engl J Med. 2014;371(13):1189–97. doi: 10.1056/NEJMoa1403291. - DOI - PubMed
    1. Moore WC, Meyers DA, Wenzel SE, et al. Identification of asthma phenotypes using cluster analysis in the Severe Asthma Research Program. Am J Respir Crit Care Med. 2010;181:315–23. doi: 10.1164/rccm.200906-0896OC. - DOI - PMC - PubMed

Publication types

MeSH terms

Associated data