

Differential responses of cecal microbiota to fishmeal, Eimeria and Clostridium perfringens in a necrotic enteritis challenge model in chickens
- PMID: 25167074
- PMCID: PMC4148237
- DOI: 10.1371/journal.pone.0104739
Differential responses of cecal microbiota to fishmeal, Eimeria and Clostridium perfringens in a necrotic enteritis challenge model in chickens
Abstract
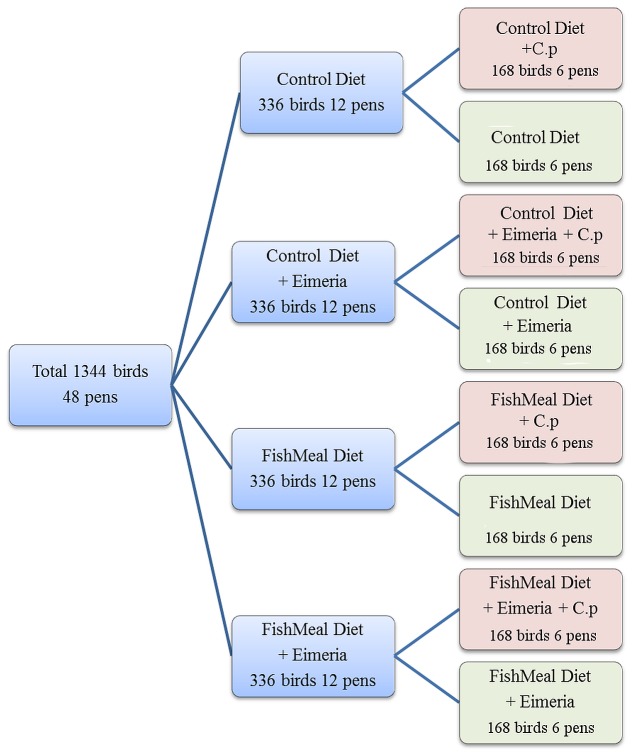
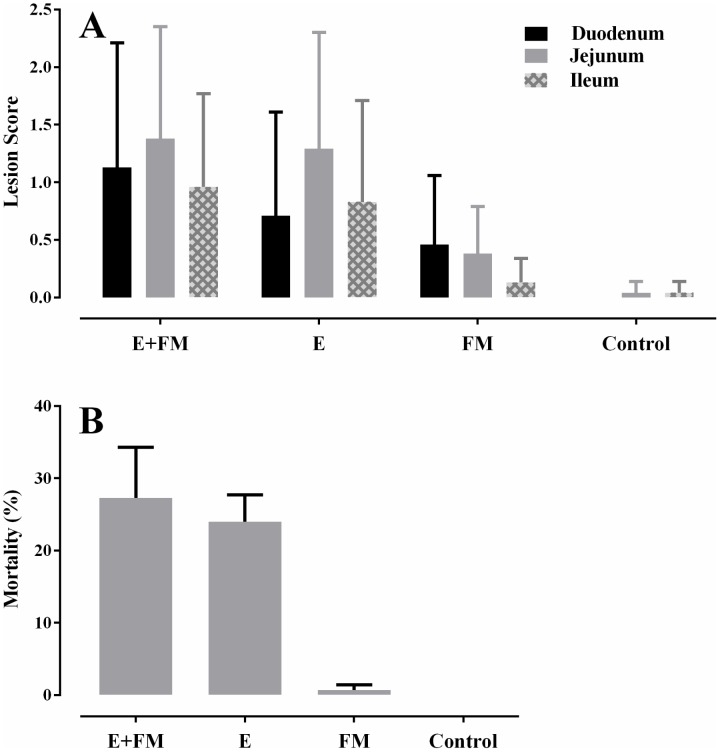
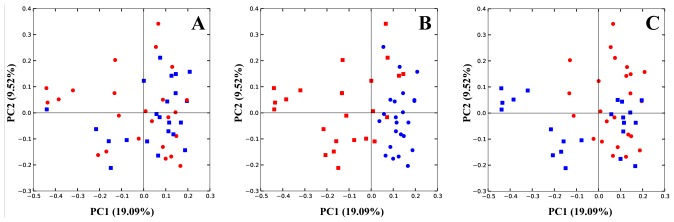
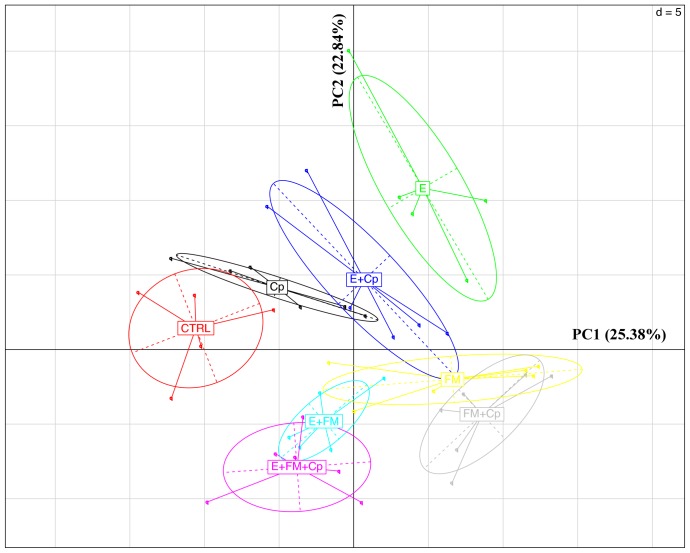
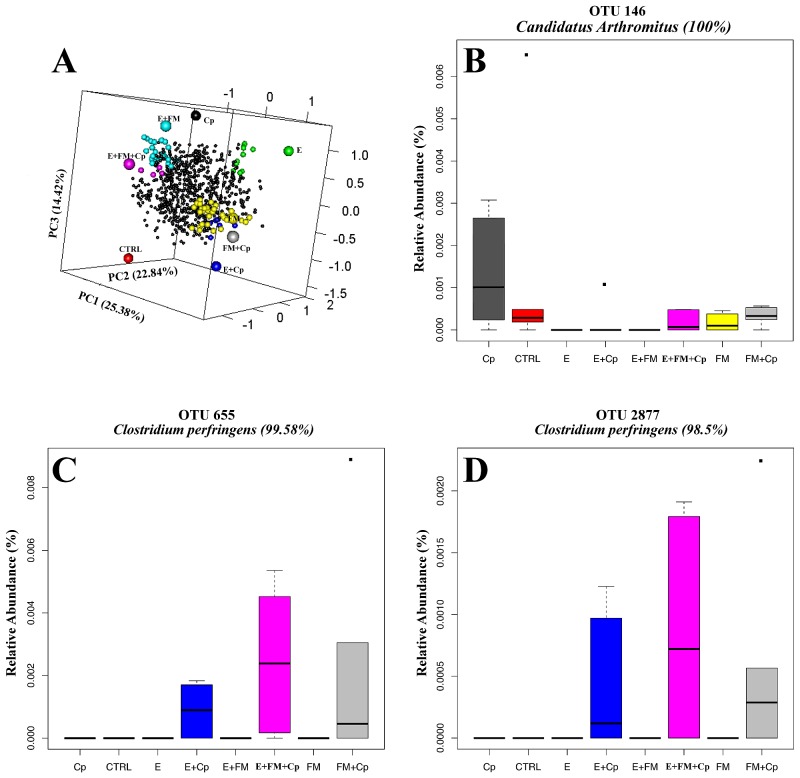
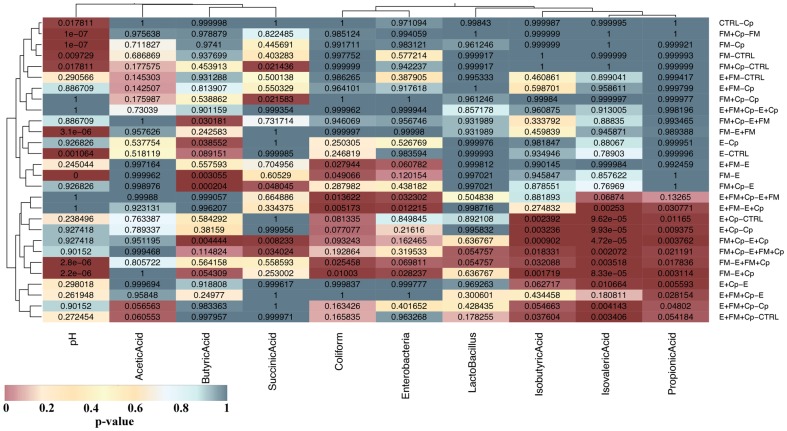
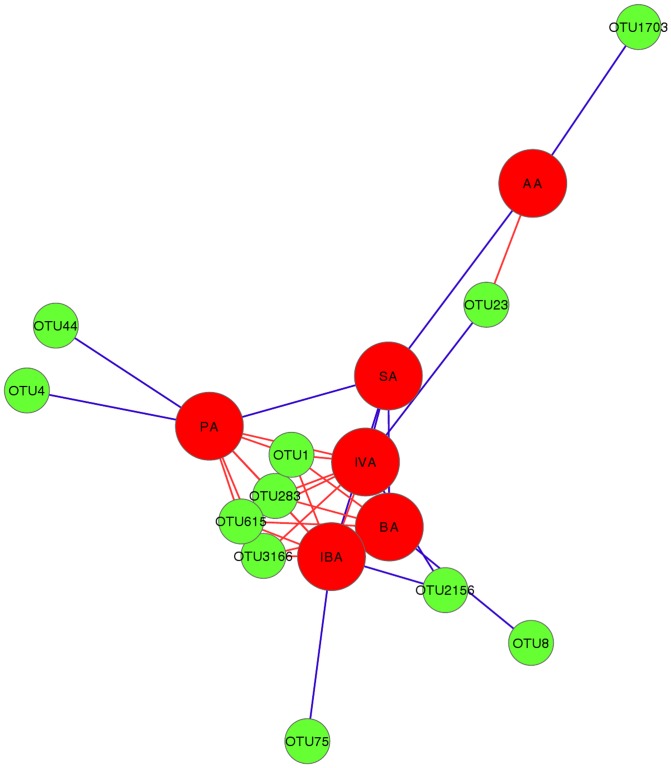
Clostridium perfringens causes enteric diseases in animals and humans. In poultry, avian-specific C. perfringens strains cause necrotic enteritis, an economically significant poultry disease that costs the global industry over $2 billion annually in losses and control measures. With removal of antibiotic growth promoters in some countries this disease appears to be on the rise. In experimental conditions used to study disease pathogenesis and potential control measures, reproduction of the disease relies on the use of predisposing factors such as Eimeria infection and the use of high protein diets, indicating complex mechanisms involved in the onset of necrotic enteritis. The mechanisms by which the predisposing factors contribute to disease progression are not well understood but it has been suggested that they may cause perturbations in the microbiota within the gastrointestinal tract. We inspected changes in cecal microbiota and short chain fatty acids (SCFA) induced by Eimeria and fishmeal, in birds challenged or not challenged with C. perfringens. C. perfringens challenge in the absence of predisposing factors did not cause significant changes in either the alpha or beta diversity of the microbiota nor in concentrations of SCFA. Moreover, there was no C. perfringens detected in the cecal microbiota 2 days post-challenge without the presence of predisposing factors. In contrast, both fishmeal and Eimeria caused significant changes in microbiota, seen in both alpha and beta diversity and also enabled C. perfringens to establish itself post challenge. Eimeria had its strongest influence on intestinal microbiota and SCFA when combined with fishmeal. Out of 6 SCFAs measured, including butyric acid, none were significantly influenced by C. perfringens, but their levels were strongly modified following the use of both predisposing factors. There was little overlap in the changes caused following Eimeria and fishmeal treatments, possibly indicating multiple routes for progressing towards clinical symptoms of necrotic enteritis.
Conflict of interest statement
Figures
References
-
- Parish WE (1961) Necrotic enteritis in the fowl (Gallus gallus domesticus). I. Histopathology of the disease and isolation of a strain of Clostridium welchii. J Comp Pathol 71: 377–393. - PubMed
-
- Van der Sluis W (2000) Clostridial enteritis is an often underestimated problem. World Poultry 16: 42–43.
-
- Van Immerseel F, Rood JI, Moore RJ, Titball RW (2009) Rethinking our understanding of the pathogenesis of necrotic enteritis in chickens. Trends Microbiol 17: 32–36. - PubMed
-
- Stanley D, Keyburn AL, Denman SE, Moore RJ (2012) Changes in the caecal microflora of chickens following Clostridium perfringens challenge to induce necrotic enteritis. Veterinary Microbiology 159: 155–162. - PubMed
Publication types
MeSH terms
Associated data
- Actions
- Actions
- Actions
- Actions
- Actions
- Actions
- Actions
- Actions
- Actions
- Actions
- Actions
- Actions
- Actions
- Actions
- Actions
- Actions
- Actions
- Actions
- Actions
- Actions
- Actions
- Actions
- Actions
- Actions
- Actions
- Actions
- Actions
- Actions
- Actions
- Actions
- Actions
- Actions
- Actions
- Actions
- Actions
- Actions
- Actions
- Actions
- Actions
- Actions
- Actions
- Actions
- Actions
- Actions
- Actions
- Actions
- Actions
- Actions
- Actions
- Actions
- Actions
- Actions
- Actions
- Actions
- Actions
- Actions
- Actions
- Actions
- Actions
LinkOut - more resources
Full Text Sources
Other Literature Sources
