. 2011 Mar 1;411(1):113-31.
doi: 10.1016/j.virol.2010.12.025. Epub 2011 Jan 15.

Multiple HIV-1 infections with evidence of recombination in heterosexual partnerships in a low risk Rural Clinical Cohort in Uganda

Affiliations

Multiple HIV-1 infections with evidence of recombination in heterosexual partnerships in a low risk Rural Clinical Cohort in Uganda

Deogratius Ssemwanga et al. Virology. .

Abstract

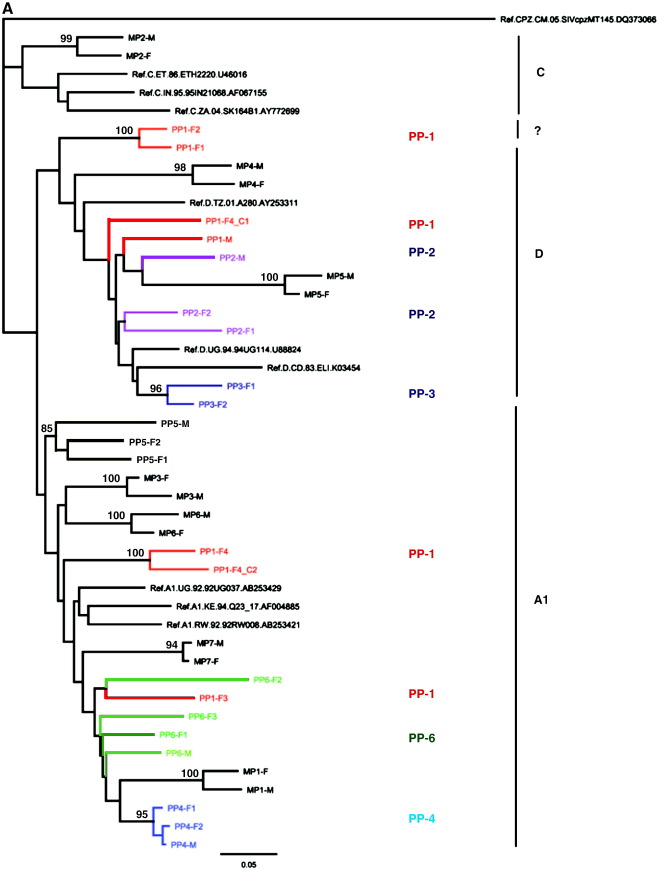
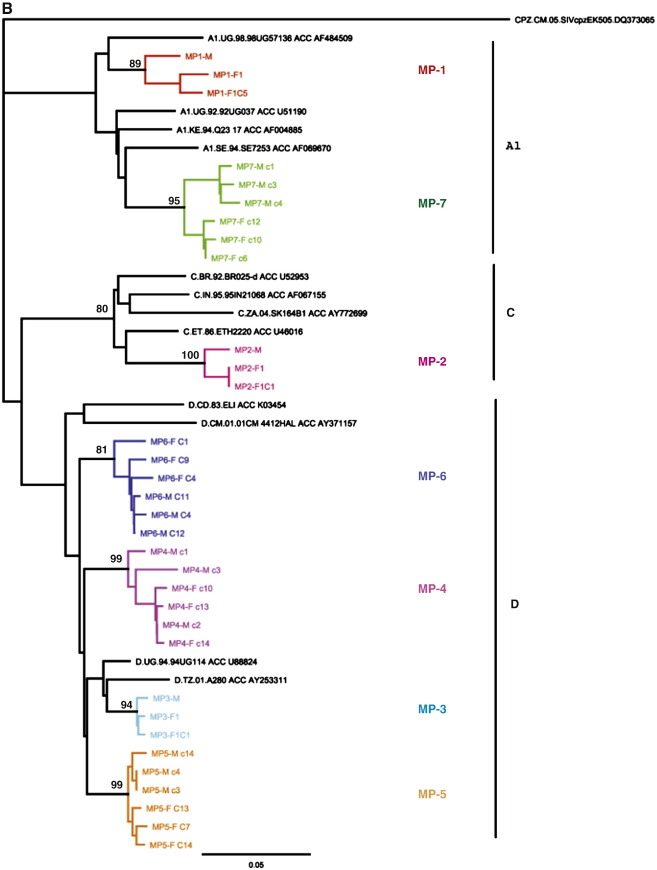
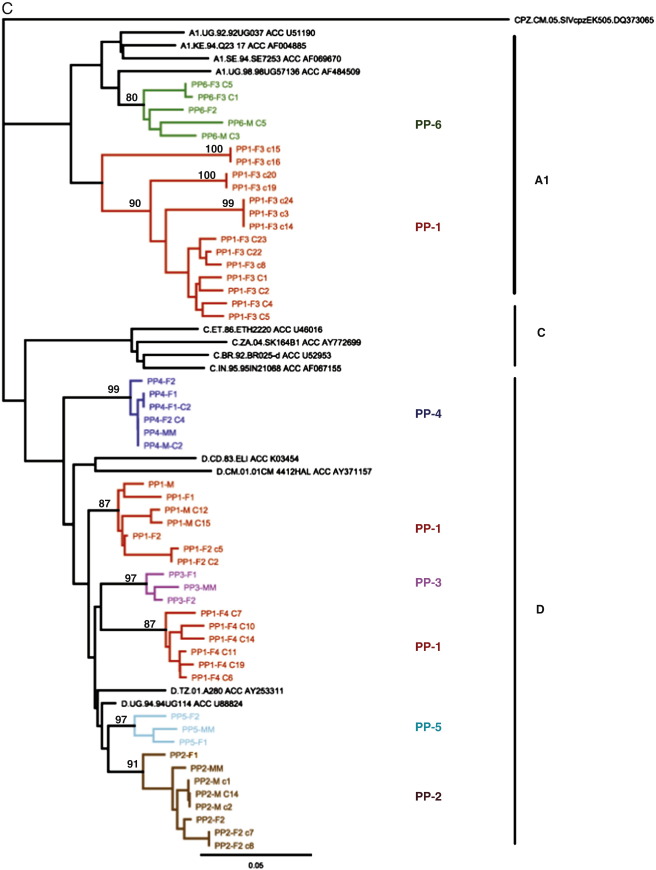
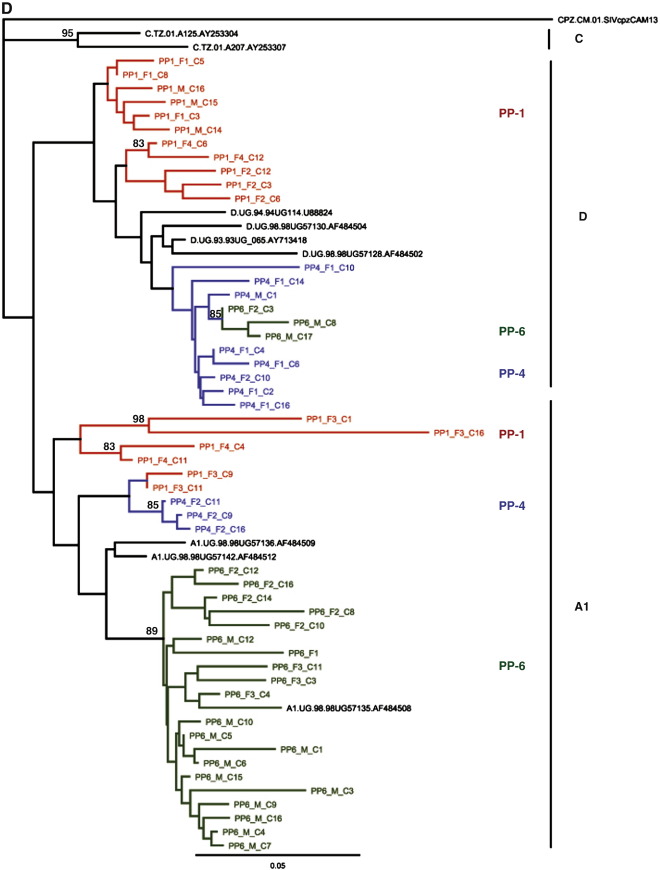
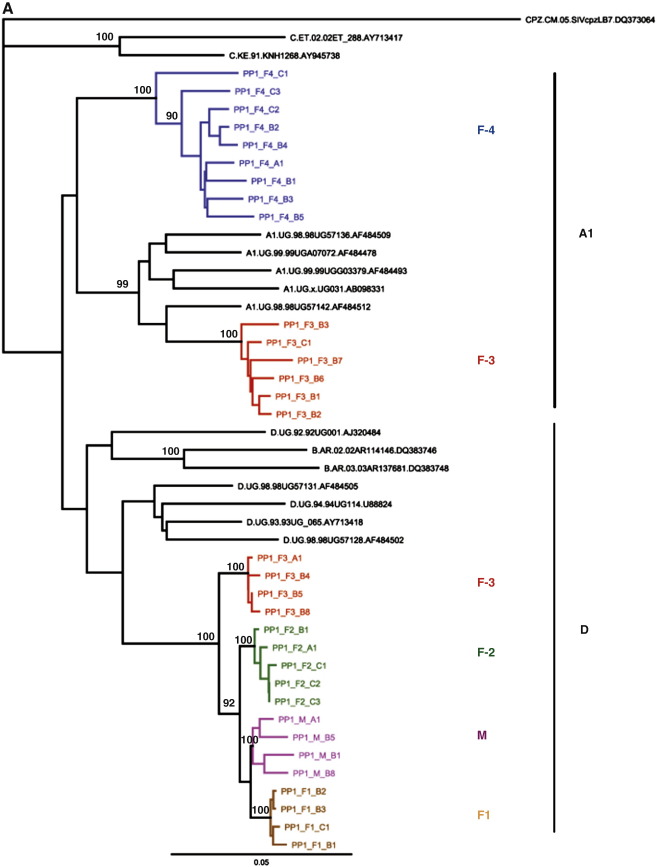
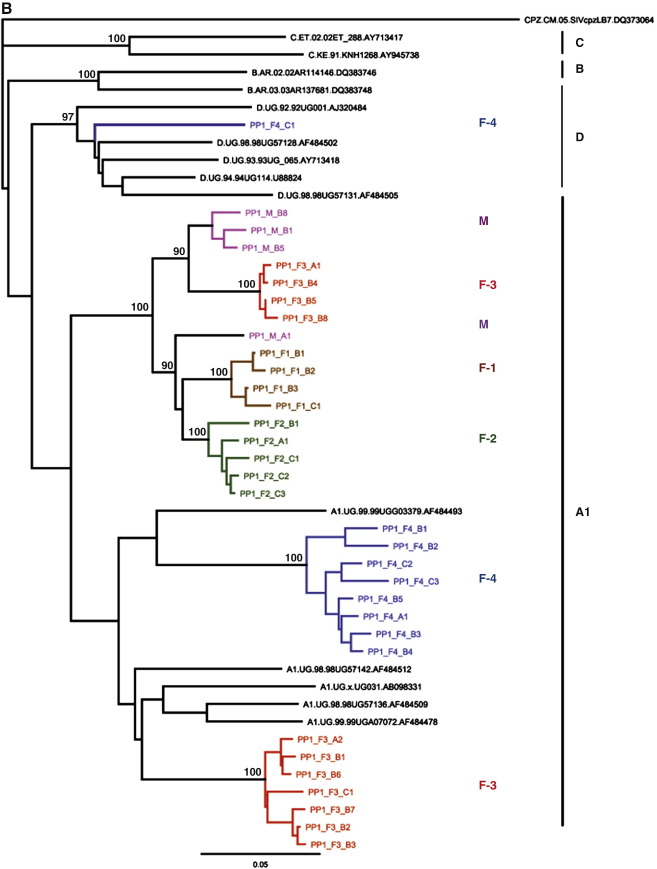
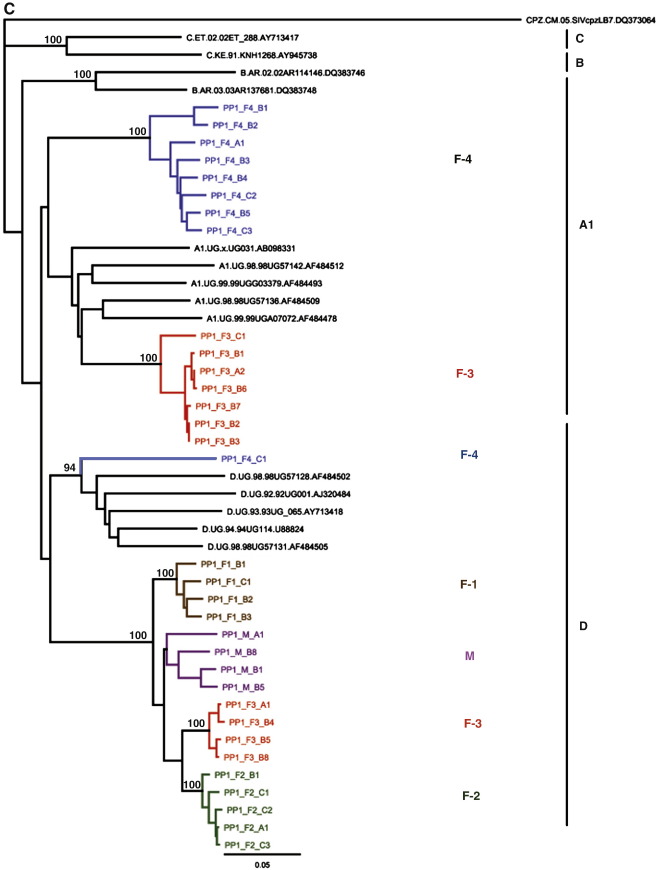
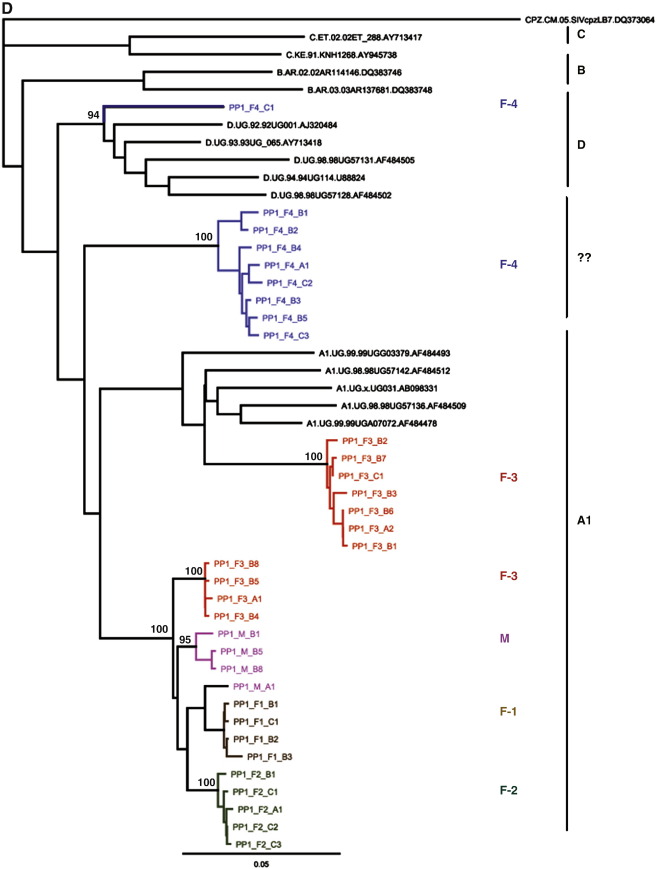
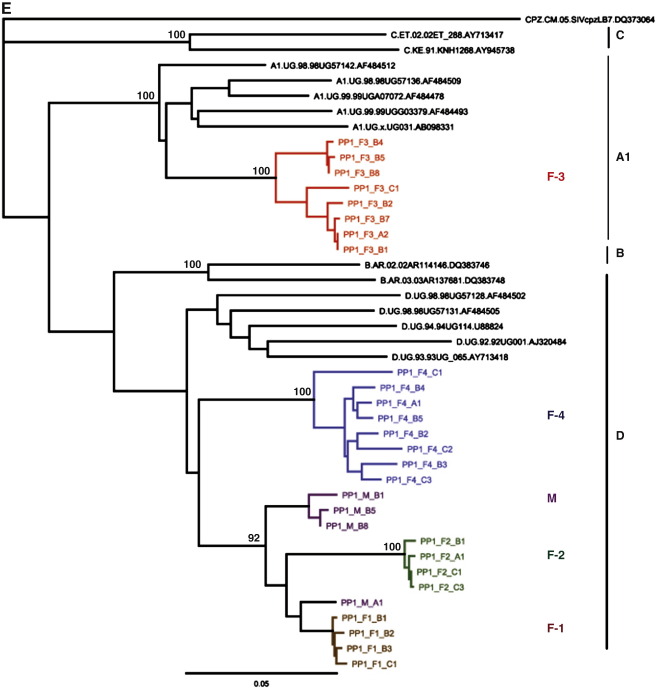
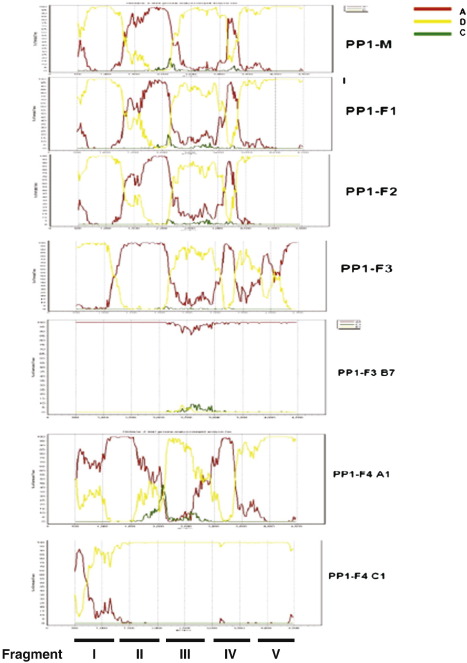
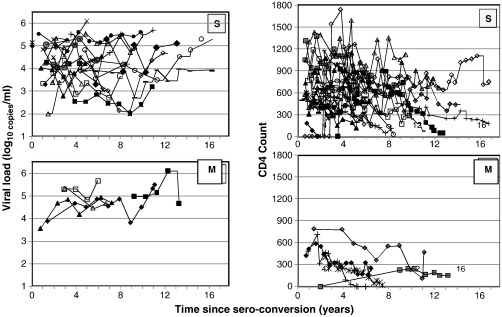
We report on the frequency of multiple infections, generation of recombinants and consequences on disease progression in 35 HIV-1 infected individuals from 7 monogamous and 6 polygamous partnerships within a Rural Clinical Cohort in Uganda. The env-C2V3, gag-p24 and pol-IN genes were sequenced. Single genome amplified half genome sequences were used to map recombination breakpoints. Three participants were dually infected with subtypes A and D, one case with subtype A and A/D recombinant and the fifth with 2 phylogenetically distinct A/D recombinants. Occurrence of A/D recombination was observed in two multiple infected individuals. Rate of late stage WHO events using Cox regression was 3 times greater amongst multiple infected compared to singly infected individuals (hazard ratio 3.35; 95% CI 1.09, 10.3; p=0.049). We have shown that polygamous relationships involving subtype discordant partnerships was a major contributor of multiple infections with generation of inter subtype recombinants in our cohort.


Figures

Fig. 1
Fig. 1
A. Phylogenetic analysis of the env-C2V3 sequences (HXB2 location 6829–7334) of Monogamous Partnerships (MP) 1–7 and Polygamous Partnerships (PP) 1–6. All PPs are coloured PP1 (red), PP2- (purple), PP3 (dark blue), PP4 (light blue), PP5 (black) and PP6 (green). Bootstrap values greater than 80% are shown. M—male partner and F—female partner. The phylogenetic plots do represent consensus sequences of the patients. B. Phylogenetic analysis of the gag-p24 sequences (HXB2 location 1123–1589) of Monogamous Partnerships (MP) 1–7. Bootstrap values greater than 80% are shown. M—male partner and F—female partner. The phylogenetic plots do represent consensus sequences of the patients. C. Phylogenetic analysis of the gag-p24 sequences (HXB2 location 1123–1589) of Polygamous Partnerships (PP) 1–6. Bootstrap values greater than 80% are shown. M—Male. D. Phylogenetic analysis of the pol-IN sequences in Polygamous Partnerships PP1, 4 and 6 (including clone and direct sequences HXB2 location 4470–4807). Bootstrap values greater than 80% are shown. M—male partner and F—female partner.
Fig. 1
Fig. 1
A. Phylogenetic analysis of the env-C2V3 sequences (HXB2 location 6829–7334) of Monogamous Partnerships (MP) 1–7 and Polygamous Partnerships (PP) 1–6. All PPs are coloured PP1 (red), PP2- (purple), PP3 (dark blue), PP4 (light blue), PP5 (black) and PP6 (green). Bootstrap values greater than 80% are shown. M—male partner and F—female partner. The phylogenetic plots do represent consensus sequences of the patients. B. Phylogenetic analysis of the gag-p24 sequences (HXB2 location 1123–1589) of Monogamous Partnerships (MP) 1–7. Bootstrap values greater than 80% are shown. M—male partner and F—female partner. The phylogenetic plots do represent consensus sequences of the patients. C. Phylogenetic analysis of the gag-p24 sequences (HXB2 location 1123–1589) of Polygamous Partnerships (PP) 1–6. Bootstrap values greater than 80% are shown. M—Male. D. Phylogenetic analysis of the pol-IN sequences in Polygamous Partnerships PP1, 4 and 6 (including clone and direct sequences HXB2 location 4470–4807). Bootstrap values greater than 80% are shown. M—male partner and F—female partner.
Fig. 2
Fig. 2
A. Phylogenetic analysis of the first SGA fragment (approx. 1000 bps) sequences in Polygamous Partnership 1. Bootstrap values greater than 90% are shown. M—male partner and F—female partner. B. Phylogenetic analysis of the second SGA fragment (approx. 1000 bps) sequences in Polygamous Partnership 1. Bootstrap values greater than 90% are shown. M-Male partner and F-Female partner. C. Phylogenetic analysis of the third SGA fragment (approx. 1000 bps) sequences in Polygamous Partnership 1. Bootstrap values greater than 90% are shown. M—male partner and F—female partner. D. Phylogenetic analysis of the fourth SGA fragment (approx. 1000 bps) sequences in Polygamous Partnership 1. Bootstrap values greater than 90% are shown. M—male partner and F—female partner. E. Phylogenetic analysis of the fifth SGA fragment (approx. 1000 bps) sequences in Polygamous Partnership 1. Bootstrap values greater than 90% are shown. M—male partner and F—female partner.
Fig. 2
Fig. 2
A. Phylogenetic analysis of the first SGA fragment (approx. 1000 bps) sequences in Polygamous Partnership 1. Bootstrap values greater than 90% are shown. M—male partner and F—female partner. B. Phylogenetic analysis of the second SGA fragment (approx. 1000 bps) sequences in Polygamous Partnership 1. Bootstrap values greater than 90% are shown. M-Male partner and F-Female partner. C. Phylogenetic analysis of the third SGA fragment (approx. 1000 bps) sequences in Polygamous Partnership 1. Bootstrap values greater than 90% are shown. M—male partner and F—female partner. D. Phylogenetic analysis of the fourth SGA fragment (approx. 1000 bps) sequences in Polygamous Partnership 1. Bootstrap values greater than 90% are shown. M—male partner and F—female partner. E. Phylogenetic analysis of the fifth SGA fragment (approx. 1000 bps) sequences in Polygamous Partnership 1. Bootstrap values greater than 90% are shown. M—male partner and F—female partner.
Fig. 3
Fig. 3
Bootscanning of half genome sequences (approx. 4800 bps) from the 5 partners in Polygamous Partnership 1 (PP1-M, PP1-F1, PP1-F2, PP1-F3 and PP1-F4). PP1-F3 and PP1-F4 each have 2 sequences and the other 3 partners each have one sequence. Query sequences are shown on the upper part of each partner's figure. Sequences to be compared with the query sequence are indicated on the right side of the figure. When comparisons were done, SimPlot generates a graph of percentage of permutated trees obtained using a sliding window of 200 nucleotides. The y-axis gives the percentage of permutated trees M—male partner and F—female partner. The fragments I–V analysed are shown at the bottom of the figure.
Fig. 4
Fig. 4
Viral load and CD4 count following HIV seroconversion. Only measurements taken prior to initiation of ART are depicted. Viral load (log10 copies/ ml) is plotted against time since seroconversion (years) in the left panels. No viral load measurements taken for five singly infected individuals. CD4 count is plotted against time since seroconversion (years) in the right hand panels. CD4 measurements were not available for one singly infected individual; for a further 3 singly infected individuals, CD4 measurements were not available prior to initiation of ART. S = singly infected individuals; M = multiple infected individuals.

References

    1. Altfeld M., Allen T.M., Yu X.G., Johnston M.N., Agrawal D., Korber B.T., Montefiori D.C., O'Connor D.H., Davis B.T., Lee P.K., Maier E.L., Harlow J., Goulder P.J., Brander C., Rosenberg E.S., Walker B.D. HIV-1 superinfection despite broad CD8+ T-cell responses containing replication of the primary virus. Nature. 2002;420(6914):434–439. - PubMed
    1. Bezemer D., van Sighem A., de Wolf F., Cornelissen M., van der Kuyl A.C., Jurriaans S., van der Hoek L., Prins M., Coutinho R.A., Lukashov V.V. Combination antiretroviral therapy failure and HIV super-infection. AIDS. 2008;22(2):309–311. - PubMed
    1. Blish C.A., Dogan O.C., Derby N.R., Nguyen M.A., Chohan B., Richardson B.A., Overbaugh J. Human immunodeficiency virus type 1 superinfection occurs despite relatively robust neutralizing antibody responses. J. Virol. 2008;82(24):12094–12103. - PMC - PubMed
    1. Casado C., Pernas M., Alvaro T., Sandonis V., Garcia S., Rodriguez C., del Romero J., Grau E., Ruiz L., Lopez-Galindez C. Coinfection and superinfection in patients with long-term, nonprogressive HIV-1 disease. J. Infect. Dis. 2007;196(6):895–899. - PubMed
    1. Delwart E.L., Busch M.P., Kalish M.L., Mosley J.W., Mullins J.I. Rapid molecular epidemiology of human immunodeficiency virus transmission. AIDS Res. Hum. Retroviruses. 1995;11(9):1081–1093. - PubMed

Publication types

MeSH terms

Substances

Associated data