. 2010 Apr 30;141(3):536-48.
doi: 10.1016/j.cell.2010.02.025.

The Q system: a repressible binary system for transgene expression, lineage tracing, and mosaic analysis

Affiliations

The Q system: a repressible binary system for transgene expression, lineage tracing, and mosaic analysis

Christopher J Potter et al. Cell. .

Abstract

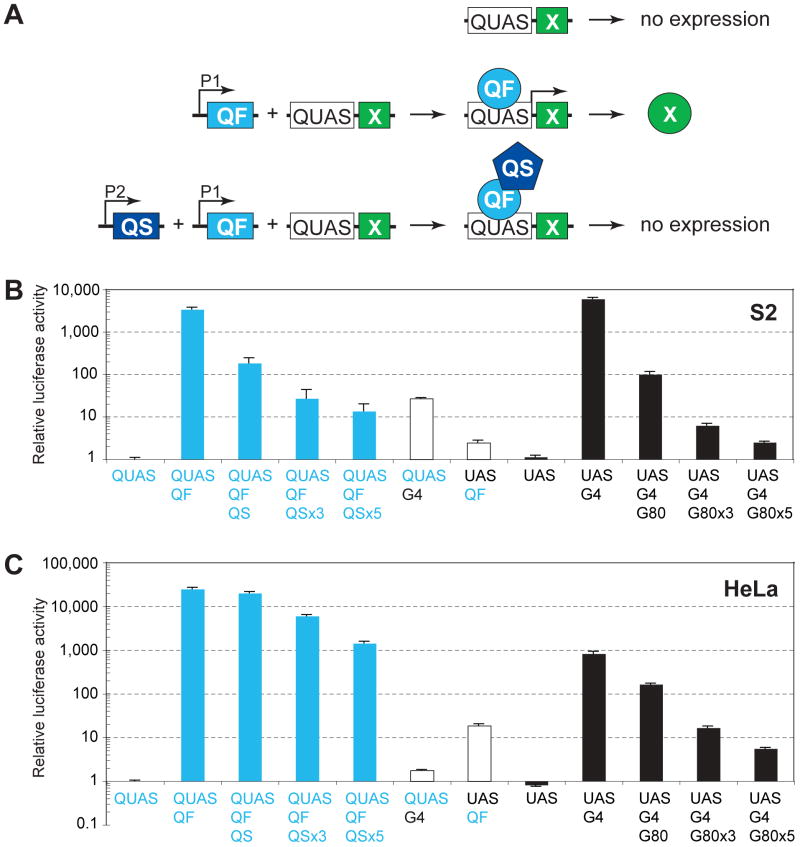
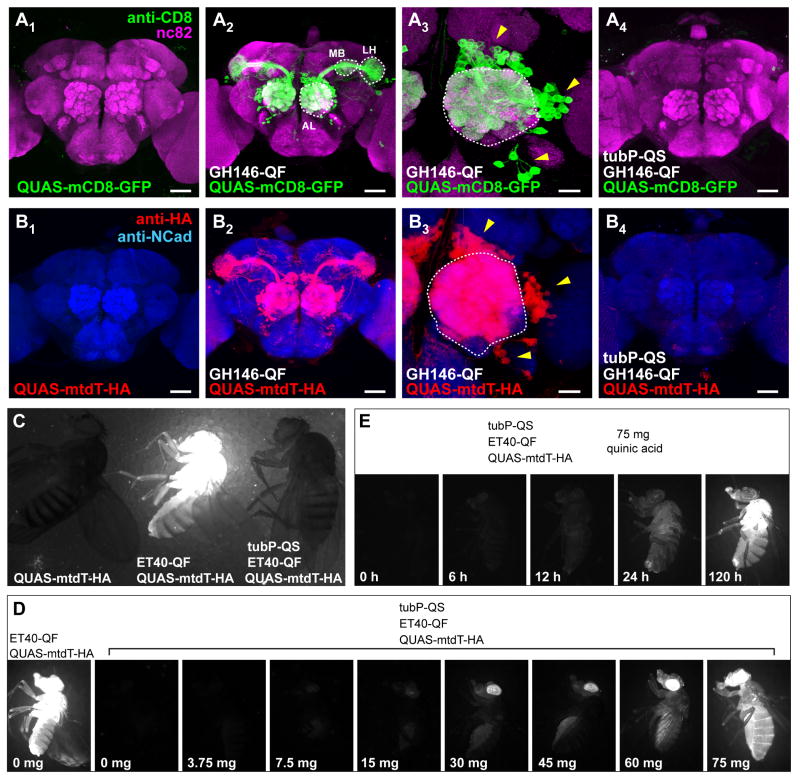
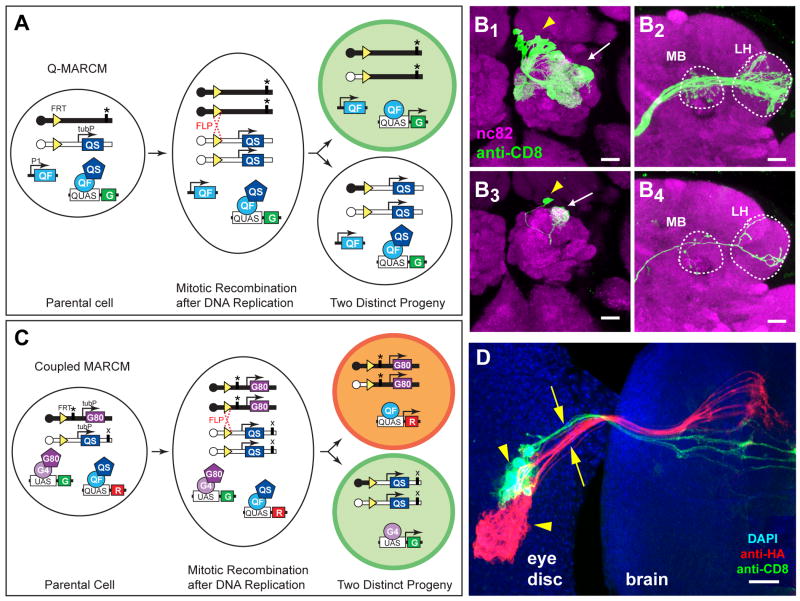
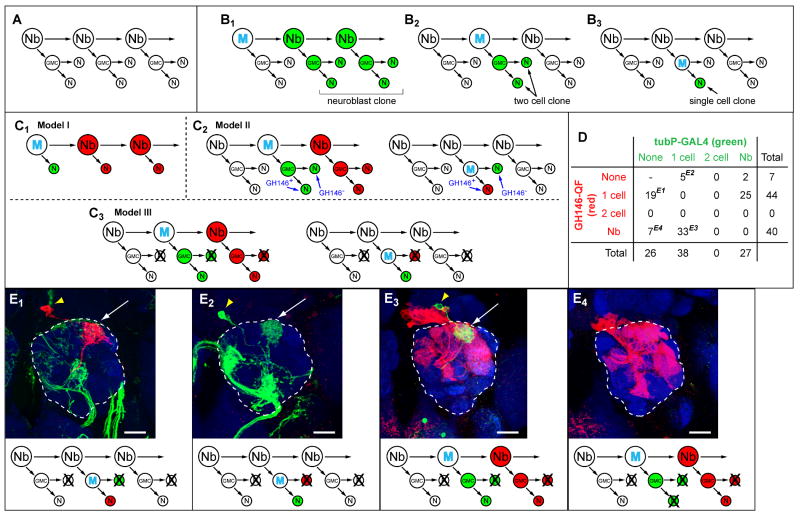
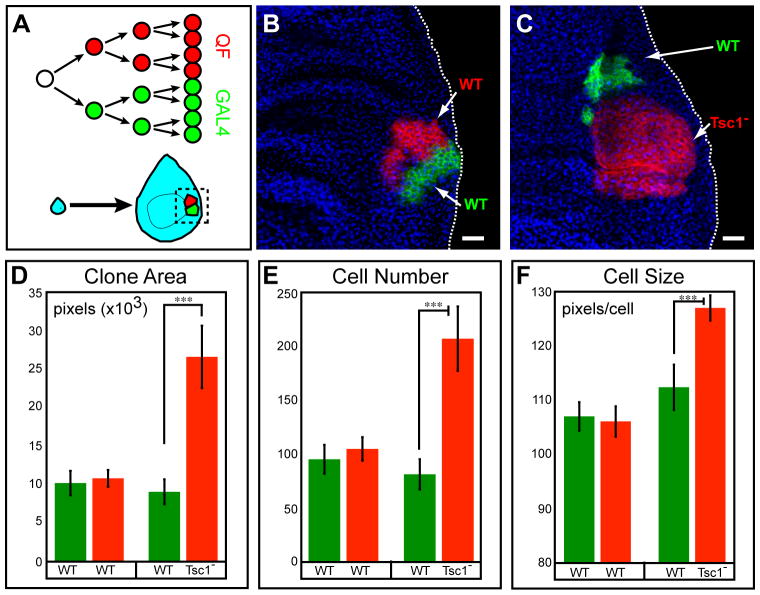
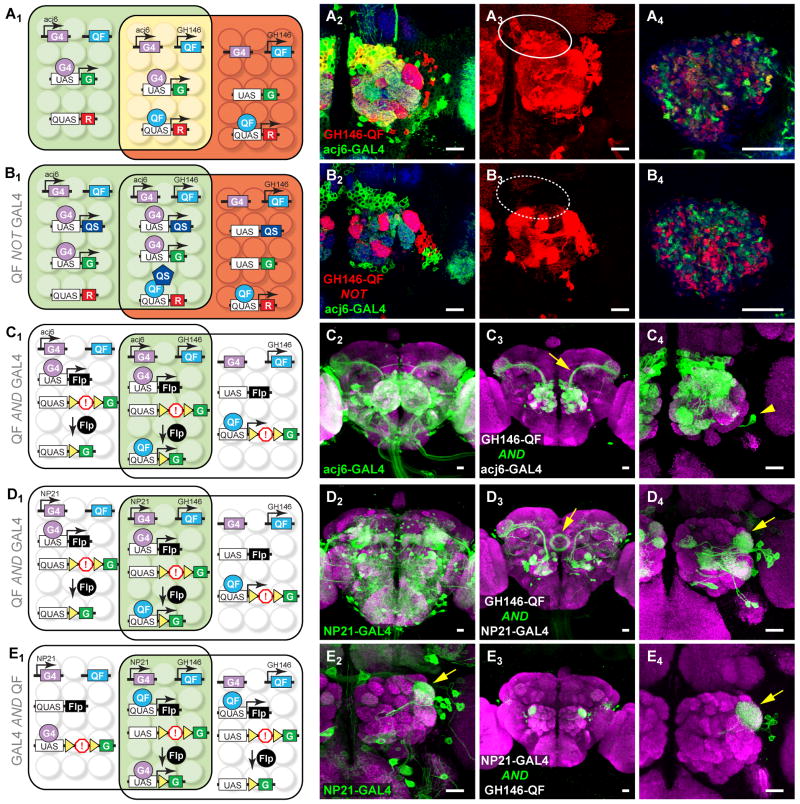
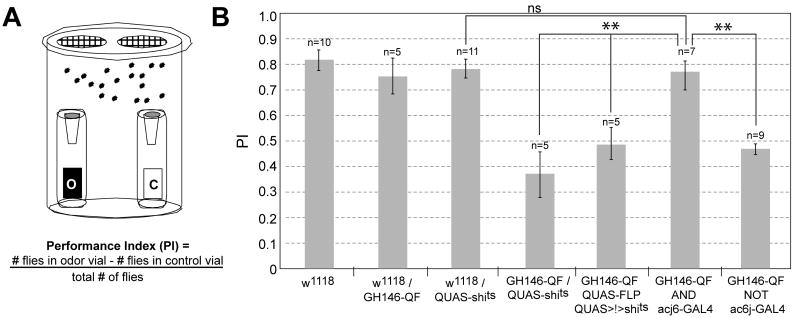
We describe a new repressible binary expression system based on the regulatory genes from the Neurospora qa gene cluster. This "Q system" offers attractive features for transgene expression in Drosophila and mammalian cells: low basal expression in the absence of the transcriptional activator QF, high QF-induced expression, and QF repression by its repressor QS. Additionally, feeding flies quinic acid can relieve QS repression. The Q system offers many applications, including (1) intersectional "logic gates" with the GAL4 system for manipulating transgene expression patterns, (2) GAL4-independent MARCM analysis, and (3) coupled MARCM analysis to independently visualize and genetically manipulate siblings from any cell division. We demonstrate the utility of the Q system in determining cell division patterns of a neuronal lineage and gene function in cell growth and proliferation, and in dissecting neurons responsible for olfactory attraction. The Q system can be expanded to other uses in Drosophila and to any organism conducive to transgenesis.


Figures

Figure 1
Figure 1. Characterization of the Q-system in Drosophila and Mammalian Cells
(A) Schematic of the Q repressible binary expression system. In the absence of the transcription factor, QF, the QF-responsive transgene, QUAS-X, does not express X (top). When QF and QUAS-X transgenes are present in the same cell where QF is expressed (promoter P1 is active), QF binds to QUAS and activates expression of gene X (middle). When QS, QF and QUAS-X transgenes are present in the same cell, and both P1 and P2 promoters are active, QS represses QF and X is not expressed (bottom). (B) Characterization of the Q-system in transiently transfected Drosophila S2 cells. Relative luciferase activity (normalized as described in Extended Experimental Procedures) is plotted on a logarithmic scale on the y-axis, with QUAS-luc2 alone set to 1. Error bars are SEM. Plasmids used for transfections are noted below the x-axis. QUAS, pQUAS-luc2 reporter; QF, pAC-QF; QS, pAC-QS; UAS, pUAS-luc2 reporter; G4, pAC-GAL4; G80, pAC-GAL80; ×3 and ×5, 3 and 5-fold molar excess of QS over QF or GAL80 over GAL4. (C) Characterization of the Q-system in transiently transfected human HeLa cells. Explanations and abbreviations as in (B) except: QF, pCMV-QF; QS, pCMV-QS; G4, pCMV-GAL4; G80, pCMV-GAL80. Figure S1 shows the effects of quinic acid on the Q and GAL4 systems.
Figure 2
Figure 2. In Vivo Characterization of the Q system in Flies
(A) Representative confocal projections of whole mount Drosophila brains immunostained for a general neuropil marker (monoclonal antibody nc82) in magenta, and for mCD8 in green. Genotypes are indicated at the bottom. A3 is a higher magnification image centered at the antennal lobe (AL; outlined). QF is driven by the GH146 enhancer that labels a large subset of olfactory projection neurons (PNs). PN cell bodies (arrowheads in A3) are located in anterodorsal, lateral or ventral clusters around the AL. PNs project dendrites into the AL, and axons to the mushroom body calyx (MB) and the lateral horn (LH) outlined. The green channel for A1 and A4 was imaged under the same gain, which is 15% higher than for the images shown in A2 and A3. (B) Representative confocal projections of whole mount Drosophila brains immunostained for a general neuropil marker N-cadherin in blue, and for HA in red. The genotypes are indicated at the bottom. B3 is a higher magnification image centered at the AL (outlined). Arrowheads denote PN cell bodies. The red channel for B1 and B4 was imaged under the same gain, which is 15% higher than for the images shown in B2 and B3. The red staining in B4 is due to the DsRed transgenic marker associated with the GH146-QF transgene vector. (C) Fluorescence images of three adult flies with genotypes as indicated. (D) Fluorescence images of adult flies with genotypes indicated on top. Numbers on the bottom indicate the amount of quinic acid (dissolved in 300 μl of water) added to the surface of ∼10 ml fly food, on which these flies developed. (E) Fluorescence images of adult flies showing time course of derepression of QS by quinic acid. The adult flies of the genotype listed on top were moved from vials with regular food to vials containing 75 mg quinic acid and imaged after the time interval shown on the bottom. Scale bars: 50 μm for A1,2,4 and B1,2,4; 20 μm for A3 and B3. Figure S2 characterizes additional QUAS reporters and QF enhancer trap lines.
Figure 3
Figure 3. Q-MARCM and Coupled MARCM
(A) Scheme for Q-MARCM. FLP/FRT mediated mitotic recombination in G2 phase of the cell cycle (dotted red cross) followed by chromosome segregation as shown causes the top progeny to lose both copies of tubP-QS, and thus becomes capable of expressing the GFP marker (G) activated by QF. It also becomes homozygous for the mutation (*). QF and QUAS reporter transgenes can be located on any other chromosome arm. P1, promoter 1. tubP, tubulin promoter. Centromeres are represented as circles on chromosome arms. (B) Q-MARCM clones of olfactory PNs visualized by GH146-QF driven QUAS-mCD8-GFP. (B1-B2) Confocal images of an anterodorsal neuroblast clone showing cell bodies of PNs (arrowhead), their dendritic projections in the antennal lobe (arrows) and axonal projections in the MB and LH (outlined). (B3-B4) Confocal images of a single cell clone showing the cell body of a DL1 PN (arrowhead), its dendritic projection into the DL1 glomerulus (arrow) of the antennal lobe and its axonal projection in the MB and LH (outlined). (C) Scheme for coupled MARCM. The tubP-GAL80 and tubP-QS transgenes are distal to the same FRT on homologous chromosomes. Mitotic recombination followed by specific chromosome segregation produces two distinct progeny devoid of QS or GAL80 transgenes, respectively, and therefore capable of expressing red (R) or green (G) fluorescent proteins, respectively. QF and GAL4 transgenes (not diagramed), as well as QUAS and UAS transgenes, can be located on any other chromosome arm. ‘*’ and ‘x’ designate two independent mutations that can be rendered homozygous in sister progeny. (D) A coupled MARCM clone of photoreceptors, showing clusters of cell bodies (arrowheads) in the eye imaginal disc and their axonal projections (arrows) to the brain. The green clone was labeled by tubP-GAL4 driven UAS-mCD8-GFP; the red clone was labeled by ET40-QF driven QUAS-mtdT-HA. Blue, DAPI staining for nuclei. Image is a z-projection of a confocal stack. Scale bars: 20 μm. Figure S3 shows the lack of cross-activation and cross-repression of the Q and GAL4 systems in vivo, and a schematic of independent double MARCM.
Figure 4
Figure 4. Lineage Analysis Using Coupled MARCM
(A) General scheme for neuroblast division in the insect CNS. Nb, neuroblast; GMC, ganglion mother cell; N, postmitotic neuron. (B) Three types of MARCM clones predicted from the general scheme. M, mitotic recombination. (C) Three models to account for the lack of two cell clones in GH146-labeled MARCM. (C1) Each neuroblast division directly produces a postmitotic GH146-positive PN without a GMC intermediate. (C2) Each GMC division produces a GH146-positive PN and a GH146-negative cell. (C3) Each GMC division produces a GH146-positive PN and a sibling cell that dies. For models II and III, simulations of coupled MARCM results are shown for mitotic recombination that occurs either in the neuroblast or in the GMC. (D) Tabulation of coupled MARCM results. Superscripts next to the numbers correspond to the images shown in (E) as examples. (E) Examples of coupled MARCM that contradict models I and II, but can be accounted for by model III (bottom). (E1-E2) A single QF- (E1) or GAL4- (E2) labeled PN in the absence of labeled siblings. These events contradict model I (C1). In both examples, the additional green staining in the antennal lobe belongs to tubP-GAL4 labeled axons from olfactory receptor neurons. (E3) A single tubP-GAL4 labeled sibling (green) of a GH146-QF labeled neuroblast clone (red). This observation contradicts model II (C2). (E4) An occasional QF-labeled neuroblast clone with no tubP-GAL4 labeled siblings. All images are z-projections of confocal stacks; green, anti-CD8 staining for UAS-mCD8-GFP; red, anti-HA staining for QUAS-mtdT-HA; blue, neuropil markers. Arrowheads, PN cell bodies; arrows, dendritic innervation in the antennal lobe (outlined). Scale bars: 20 μm. See Figure S4 for a schematic for these coupled MARCM experiments.
Figure 5
Figure 5. Coupled MARCM for Clonal Analysis of Mutant Phenotypes
(A) Schematic for coupled MARCM labeling of dividing cells during imaginal disc development. (B) A control coupled MARCM clone. Both GAL4- and QF-labeled siblings are wild type. Genotype: hsFLP, QUAS-mtdT-HA, UAS-mCD8-GFP (X); ET40-QF, QUAS-mtdT-HA/+ (II); tubP-GAL4, 82BFRT, tubP-GAL80/82BFRT,tubP-QS (III). (C) A coupled MARCM clone where GAL4-labeled sibling (green) is wild type, while QF-labeled sibling (red) is homozygous mutant for Tsc1. Genotype: hsFLP, QUAS-mtdT-HA, UAS-mCD8-GFP (X); ET40-QF, QUAS-mtdT-HA/+ (II); tubP-GAL4, 82BFRT, tubP-GAL80, Tsc1Q600×/82BFRT, tubP-QS (III). Green, anti-CD8; Red, anti-HA; Blue, anti-fibrillarin (labels nucleoli). Scale bars: 20 μm. (D-F) Quantification of clone area, cell number and cell size for experiments in B and C. n=30 for WT vs. WT; n=21 for WT vs. Tsc1. Error bars are ± SEM. ***, p<0.001. Figure S5 shows additional characterization of the effects of QF, GAL4, or QF+GAL4 expression on imaginal disc differentation.
Figure 6
Figure 6. Intersectional Methods to Refine Transgene Expression
(A1) Schematic showing two partially overlapping cell populations: one expressing an acj6-GAL4-driven green marker (within the left rectangle), and the other expressing a GH146-QF-driven red marker (within the right rectangle). Cells in the center express both GAL4 and QF and appear yellow. (A2-A4) Single confocal sections (A2, A4) or a z-projection (A3) of the adult antennal lobe (A2-A3) or mushroom body calyx (A4) from flies with the genotype shown in A1. Green, red and yellow cells in A2 represent PNs that express acj6-GAL4 only, GH146-QF only, or both, respectively. Their dendrites form green, yellow and red glomeruli (A2). Their axons form green, red, and yellow terminal boutons in the mushroom body (A4). (A3) is the z-projection of the red channel for A2; the oval highlights cell bodies of anterodorsal PNs. Green: anti-CD8 staining for UAS-mCD8-GFP; Red: anti-HA staining for QUAS-mtdT-HA. Blue: neuropil marker. (B1) Schematic for ‘QF NOT GAL4’ for acj6-GAL4 and GH146-QF. UAS-QS is added to A1, resulting in the repression of QF activity in cells that express both QF and GAL4 (center). QF reporter expression is thus subtracted from the overlapping population of cells. (B2-B4) Equivalent samples as A2-A4, except with UAS-QS added. Compared to A3, anterodorsal PNs no longer express QUAS-mtdT-HA (dotted oval in B3). There are no yellow cells and glomeruli in the antennal lobe (B2), or yellow terminal boutons in the mushroom body (B4). Note: In the experiments shown in A and B, to clearly visualize only non-ORN processes in the antennal lobe, antennae and maxillary palps were removed 10 days prior to staining, causing all Acj6-expressing ORN axons to degenerate. (C1) Schematic for “QF AND GAL4” for acj6-GAL4 and GH146-QF. GAL4 driven FLP results in the removal of a transcriptional stop (!) from a QUAS reporter (within the left rectangle), but the reporter can only be expressed in cells where QF is expressed (within the right rectangle). Thus, only the cells in the overlap (center) express the reporter. (C2) Confocal stack of a whole mount central brain showing reporter (mCD8-GFP) expression from acj6-GAL4, which labels many types of neurons including most ORNs, olfactory PNs and optic lobe neurons. (C3-C4) The AND gate between GH146-QF and acj6-GAL4 (genotype as in C1) limits mCD8-GFP expression to a cluster of anterodorsal PNs and a single lateral neuron (arrowhead in C4). Arrow in C3, axons of anterodorsal PNs. (D1) Schematic for “QF AND GAL4” similar to C1, but for NP21-GAL4 and GH146-QF. (D2) Confocal stack of whole mount central brain showing reporter (mCD8-GFP) expression from NP21-GAL4. (D3-D4) The AND gate between GH146-QF and NP21-GAL4 limits reporter expression to a few classes of PNs that project to several glomeruli including DA1 (arrow in D4) and to neurons that project to the ellipsoid body (arrow in D3). (E1) Schematic for an alternative approach to “GAL4 AND QF” for NP21-GAL4 and GH146-QF. Here, FLP is driven by QF, and the reporter is driven by GAL4. (E2) High magnification of NP21-GAL4 expression pattern centered at the antennal lobe. In the adult, only one class of lateral PNs projecting to the DA1 glomerulus (arrow) is evident. (E3-E4) This AND gate between GH146-QF and NP21-GAL4 limits expression to a single class of lateral PNs that project to the DA1 glomerulus (arrow in E4). Occasional expression is also found in a few cells in the anterior lateral region of the brain. Genotypes: (A) acj6-GAL4, GH146-QF, UAS-mCD8-GFP, QUAS-mtdT-HA; (B) acj6-GAL4, GH146-QF, UAS-mCD8-GFP, QUAS-mtdT-HA, UAS-QS; (C2) acj6-GAL4, UAS-mCD8-GFP; (C3, C4) acj6-GAL4, GH146-QF, UAS-FLP, QUAS>stop>mCD8-GFP; (D2 E2) NP21-GAL4, UAS-mCD8-GFP; (D3, D4) NP21-GAL4, GH146-QF, UAS-FLP, QUAS>stop>mCD8-GFP; (E3, E4) NP21-GAL4, GH146-QF, UAS>stop>mCD8-GFP, QUAS-FLP; “>”, FRT site. Scale bars: 20 μm. Figure S6 shows strategies to generate 12 QF and GAL4 intersectional logic gates.
Figure 7
Figure 7. Defining PNs Responsible for Olfactory Attraction Using Intersectional Methods
(A) Schematic of the olfactory trap assay. O,1% ethyl acetate in mineral oil; C, control (mineral oil alone). A performance index (PI) is used to measure olfactory attraction. (B) Performance index plots of flies of listed genotypes. Error bars are ± SEM. **, p≤0.01. ns, not significant. Genotypes: (GH146-QF AND acj6-GAL4) acj6-GAL4, GH146-QF, UAS-FLP, QUAS>stop>shibirets1; (GH146-QF NOT acj6-GAL4) acj6-GAL4, GH146-QF, UAS-QS, QUAS-shibirets1. “>”, FRT site; “>!>”, transcriptional stop>.

References

    1. Baum JA, Geever R, Giles NH. Expression of qa-1F activator protein: identification of upstream binding sites in the qa gene cluster and localization of the DNA-binding domain. Mol Cell Biol. 1987;7:1256–1266. - PMC - PubMed
    1. Berdnik D, Fan AP, Potter CJ, Luo L. MicroRNA processing pathway regulates olfactory neuron morphogenesis. Curr Biol. 2008;18:1754–1759. - PMC - PubMed
    1. Brand AH, Perrimon N. Targeted gene expression as a means of altering cell fates and generating dominant phenotypes. Development. 1993;118:401–415. - PubMed
    1. Bryant PJ, Simpson P. Intrinsic and extrinsic control of growth in developing organs. Q Rev Biol. 1984;59:387–415. - PubMed
    1. Clyne PJ, Certel SJ, de Bruyne M, Zaslavsky L, Johnson WA, Carlson JR. The odor specificities of a subset of olfactory receptor neurons are governed by Acj6, a POU-domain transcription factor. Neuron. 1999;22:339–347. - PubMed

Publication types

Associated data

LinkOut - more resources