

Exposing malaria in-host diversity and estimating population diversity by capture-recapture using massively parallel pyrosequencing
- PMID: 21041629
- PMCID: PMC2993407
- DOI: 10.1073/pnas.1007068107
Exposing malaria in-host diversity and estimating population diversity by capture-recapture using massively parallel pyrosequencing
Abstract
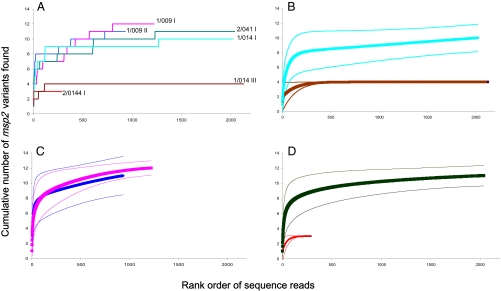
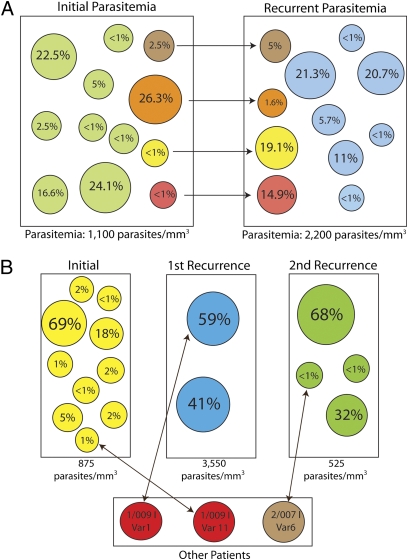
Malaria infections commonly contain multiple genetically distinct variants. Mathematical and animal models suggest that interactions among these variants have a profound impact on the emergence of drug resistance. However, methods currently used for quantifying parasite diversity in individual infections are insensitive to low-abundance variants and are not quantitative for variant population sizes. To more completely describe the in-host complexity and ecology of malaria infections, we used massively parallel pyrosequencing to characterize malaria parasite diversity in the infections of a group of patients. By individually sequencing single strands of DNA in a complex mixture, this technique can quantify uncommon variants in mixed infections. The in-host diversity revealed by this method far exceeded that described by currently recommended genotyping methods, with as many as sixfold more variants per infection. In addition, in paired pre- and posttreatment samples, we show a complex milieu of parasites, including variants likely up-selected and down-selected by drug therapy. As with all surveys of diversity, sampling limitations prevent full discovery and differences in sampling effort can confound comparisons among samples, hosts, and populations. Here, we used ecological approaches of species accumulation curves and capture-recapture to estimate the number of variants we failed to detect in the population, and show that these methods enable comparisons of diversity before and after treatment, as well as between malaria populations. The combination of ecological statistics and massively parallel pyrosequencing provides a powerful tool for studying the evolution of drug resistance and the in-host ecology of malaria infections.
Conflict of interest statement
The authors declare no conflict of interest.
Figures
References
-
- World Health Organization . World Malaria Report 2008. Geneva: World Health Organization; 2008.
-
- Bell AS, de Roode JC, Sim D, Read AF. Within-host competition in genetically diverse malaria infections: Parasite virulence and competitive success. Evolution. 2006;60:1358–1371. - PubMed
-
- Mideo N, et al. Understanding and predicting strain-specific patterns of pathogenesis in the rodent malaria Plasmodium chabaudi. Am Nat. 2008;172:214–238. - PubMed
Publication types
MeSH terms
Substances
Associated data
- Actions
- Actions
- Actions
- Actions
- Actions
- Actions
- Actions
- Actions
- Actions
- Actions
- Actions
- Actions
- Actions
- Actions
- Actions
- Actions
- Actions
- Actions
- Actions
- Actions
- Actions
- Actions
- Actions
- Actions
- Actions
- Actions
- Actions
- Actions
- Actions
- Actions
- Actions
- Actions
- Actions
- Actions
- Actions
- Actions
- Actions
- Actions
- Actions
- Actions
- Actions
- Actions
- Actions
- Actions
- Actions
- Actions
- Actions
- Actions
- Actions
- Actions
- Actions
- Actions
- Actions
- Actions
- Actions
- Actions
- Actions
- Actions
- Actions
- Actions
- Actions
- Actions
- Actions
- Actions
- Actions
- Actions
- Actions
- Actions
- Actions
- Actions
- Actions
- Actions
- Actions
- Actions
- Actions
- Actions
- Actions
- Actions
- Actions
- Actions
- Actions
- Actions
- Actions
- Actions
- Actions
- Actions
- Actions
- Actions
- Actions
- Actions
- Actions
- Actions
- Actions
- Actions
- Actions
- Actions
- Actions
- Actions
- Actions
- Actions
- Actions
- Actions
- Actions
- Actions
- Actions
- Actions
- Actions
- Actions
- Actions
- Actions
- Actions
- Actions
- Actions
- Actions
- Actions
- Actions
- Actions
- Actions
- Actions
- Actions
- Actions
- Actions
- Actions
- Actions
- Actions
- Actions
- Actions
- Actions
- Actions
- Actions
- Actions
- Actions
- Actions
- Actions
- Actions
- Actions
- Actions
- Actions
- Actions
- Actions
- Actions
- Actions
- Actions
- Actions
- Actions
- Actions
- Actions
- Actions
- Actions
- Actions
- Actions
- Actions
- Actions
- Actions
- Actions
- Actions
- Actions
- Actions
- Actions
- Actions
- Actions
- Actions
- Actions
- Actions
- Actions
- Actions
- Actions
- Actions
- Actions
- Actions
- Actions
Grants and funding
LinkOut - more resources
Full Text Sources
Medical
Research Materials
